NetCrunch Guide
Program documentation is constantly updated with every new build. It is also available online.
Please help us make it better. If you find any topic incomplete or missing - let us know. Click on the small icon at the top right corner and send us an anonymous comment.
Monitoring Foundations
In this chapter, we explore the foundational principles of network monitoring through the concept of the monitoring pyramid. We introduce the three essential layers, Observability, Monitoring, and Notification, explaining their distinct roles and interconnections.
Introduction
Describing key monitoring layers and their role
Effective monitoring is the cornerstone of maintaining a healthy and efficient infrastructure in network management. The concept of monitoring can be visualized as a pyramid, with each layer building on the previous one to create a comprehensive strategy.
Observability
At the foundation lies observability, which involves collecting monitored data and events. This layer is crucial because unobserved information is lost, and extensive data collection is essential for thorough analysis. Observability means gathering detailed insights about the system's behavior without immediately assessing or acting upon it.
Monitoring/Alerting
The second layer is monitoring, which begins with alerting. This is commonly misunderstood; alerts are not merely notifications, but events the monitoring system observes and can act upon. These alerts, particularly those categorized as warnings or informational, provide a detailed picture of network behavior over time. They are vital for automation and triggering corrective actions, helping to maintain network stability and performance.
Notifications
At the pinnacle of the pyramid is the notification layer. Notifications should include only critical alerts for parts of the network infrastructure that require immediate action. This distinction is significant, as many users mistakenly disable monitoring rather than just notifications, analogous to "cutting off the leg because the toe hurts."
Understanding and implementing this pyramid approach ensures a robust, effective monitoring system that enables proactive management and swift issue resolution.
Data Collection - Observability
Types of data collected across the network for a comprehensive overview
Definition and Importance
Data collection, often called observability in modern network management, forms the base of the monitoring pyramid. This layer continuously gathers various data and events from across the network. Observability is critical because it provides the raw information for analysis, troubleshooting, and decision-making. As the saying goes, "You can't manage what you don't measure." Collecting more data than initially needed ensures that no crucial information is missed, which can be invaluable for future analysis and understanding of network behavior.
Types of Data
A robust data collection strategy involves capturing a wide range of information, including:
-
Network Traffic: Data packets traveling across the network help understand bandwidth usage, identify bottlenecks, and detect potential security threats. Monitoring network traffic is crucial for maintaining network performance and identifying unusual patterns that may indicate congestion or malicious activity.
-
System Performance Metrics: CPU usage, memory utilization, disk I/O, and other performance indicators from servers and network devices. These metrics are essential for assessing the health and efficiency of the infrastructure. Monitoring these metrics helps predict potential failures and optimize resource allocation.
-
Application Logs: Logs generated by applications running on the network. These logs provide insights into application behavior, errors, and user interactions. Application logs are invaluable for diagnosing application-specific issues, understanding user activity, and ensuring application security.
-
User Activity: Data on user access and actions within the network. Monitoring user activity is crucial for security monitoring and compliance, helping detect unauthorized access, track changes, and ensure user actions align with organizational policies.
-
Status Data: Information describing the state of various elements within the network and beyond, such as IoT devices. Status data can be determined internally, such as service availability, or received and checked from external sources. This data is essential for understanding the operational state of devices and systems, ensuring they function correctly, and detecting any deviations from expected behavior.
Collecting this type of data provides a comprehensive view of the network's operation, enabling proactive management and swift issue resolution. Organizations can maintain optimal network performance and security by integrating network traffic, system performance metrics, application logs, user activity, and status data into a unified monitoring strategy.
Benefits
Implementing a comprehensive data collection strategy provides several key benefits:
-
Historical Data for Trend Analysis: By maintaining historical data, network administrators can identify trends and patterns over time, which helps in forecasting future needs and detecting long-term issues.
-
Baseline Establishment for Normal Behavior: Collecting extensive data allows for creating baselines that define normal network behavior. These baselines are essential for detecting anomalies and potential problems.
-
Root Cause Analysis for Issues: When problems arise, having detailed historical data enables more accurate and quicker root cause analysis, leading to faster resolution and minimizing downtime.
In conclusion, the data collection layer is the foundation of effective network monitoring. By prioritizing comprehensive data collection and implementing robust storage and retention practices, organizations can ensure they have the information needed to maintain network health, proactively address issues, and support informed decision-making.
Monitoring - Alerting
Identify common misconceptions about alerts. Learn about their role in network management and workflow automation
Definition and Distinction from Notifications
Monitoring, often associated with alerting, is the second layer in the monitoring pyramid. This layer involves continuous network monitoring and the generation of alerts based on predefined conditions. It is crucial to distinguish alerts from notifications:
- Alerts as Events: Alerts are specific events triggered when monitored data meets certain criteria. These events can trigger automated responses, such as running scripts, adjusting configurations, or creating new alerts. Alerts help identify potential issues before they become critical.
- Common Misconception: Alerts are often mistakenly treated as notifications. However, alerts are not merely notifications; they are actionable events that provide insights into network behavior and can drive automated responses.
Types of Alerts
Alerts can be categorized into three main types, each serving a distinct purpose:
-
Critical Alerts: These alerts indicate severe issues that require immediate attention. They are usually triggered by events that could lead to significant downtime or security breaches. Examples include server outages, security violations, and critical application failures.
-
Warning Alerts: Signify potential issues that might not require immediate action but should be addressed to prevent escalation. These alerts help identify trends or conditions that could become critical if left unattended. Examples include high CPU usage, nearing disk capacity, and unusual network traffic patterns.
-
Informational Alerts: Provide data about normal but noteworthy events within the network. These alerts help track changes, understand usage patterns, and maintain a historical record of network behavior. Examples include system reboots, user logins, and configuration changes.
Configuration and Management
Effective alert management involves careful configuration and ongoing adjustments to ensure relevance and accuracy:
-
Setting Thresholds for Alerts: Establishing appropriate thresholds for triggering alerts is crucial. Thresholds should be based on historical data, industry standards, and specific organizational needs. Regularly review and adjust these thresholds to adapt to changing network conditions.
-
Customizing Alert Parameters Based on Network Behavior: Different network environments have unique behaviors and requirements. Customizing alert parameters enables more accurate anomaly detection. This customization includes defining alert conditions, specifying alert severities, and setting up alert dependencies to avoid redundant alerts.
Benefits
Implementing a well-structured alerting system provides several key benefits:
- Automated Corrective Actions: Alerts can trigger automated scripts or workflows to address issues immediately, reducing the need for manual intervention and speeding up problem resolution.
- Comprehensive View of Network Behavior: Alerts provide real-time insights into network conditions, helping administrators understand current performance and anticipate potential problems.
- Improved Response Times and Reduced Downtime: By identifying and responding to issues promptly, alerts help minimize network downtime and improve overall system reliability. This proactive approach ensures that potential problems are addressed before they impact users.
In conclusion, the monitoring/alerting layer is essential for maintaining network health and performance. By effectively configuring and managing alerts, organizations can ensure timely responses to potential issues, automate corrective actions, and gain a comprehensive understanding of their network behavior. This approach enhances the ability to maintain a stable and efficient network infrastructure.
Notifications
Criteria and best practices for effective notifications in network management
Definition and Purpose
Notifications represent the top layer of the monitoring pyramid, where the most critical information is communicated to human operators. Unlike general alerts that can trigger automated responses, notifications are reserved for critical alerts that require immediate human intervention. These notifications ensure that relevant personnel promptly address issues impacting the network's core functionality.
Criteria for Notifications
To ensure the effectiveness of notifications, it is essential to adhere to strict criteria:
-
Only Include Critical Alerts: Notifications should be limited to critical alerts that signify severe issues needing immediate attention. This ensures that the most pressing problems are prioritized and acted upon swiftly.
-
Focus on Critical Parts of Network Infrastructure: Notifications should target the most crucial components of the network infrastructure, such as core servers, main communication links, and essential applications. This focus helps safeguard the network's critical functions and minimize the impact of any disruptions.
Best Practices
Implementing notifications effectively requires adherence to best practices designed to maximize their utility and minimize potential drawbacks:
-
Avoiding Alert Fatigue by Minimizing Notifications: Excessive notifications can lead to alert fatigue, where operators become desensitized to alerts and may overlook or ignore them. To prevent this, minimizing notifications to only the most critical issues is crucial, ensuring each notification receives the necessary attention.
-
Prioritizing Notifications to Ensure Important Alerts Are Addressed: Notifications should be prioritized based on severity and impact. This prioritization helps ensure the most critical problems are addressed first, optimizing response time and reducing the risk of significant network disruptions.
Common Pitfalls
Avoiding common pitfalls in the notification process is essential for maintaining an effective monitoring strategy:
-
Disabling Monitoring Instead of Notifications: A common mistake is turning off monitoring due to overwhelming notifications. This approach is akin to "cutting off the leg because the toe hurts"—it addresses the symptom but not the underlying problem. Instead, refine the notification criteria to reduce noise without compromising overall monitoring.
-
Misconception Analogy: Understanding the distinction between monitoring and notifications is crucial. Disabling notifications when overwhelmed should not lead to disabling the entire monitoring system. Instead, it requires fine-tuning the notification parameters to ensure they serve their purpose without causing unnecessary disruption.
In conclusion, the notification layer is critical to an effective monitoring strategy. Organizations can ensure their network infrastructure remains stable and resilient by focusing on critical alerts, adhering to best practices, and avoiding common pitfalls. Properly configured notifications enable timely human intervention, safeguarding the network's core functions and maintaining overall system performance.
Validating the Layered Monitoring Approach
Case studies and research on the layered monitoring approach for building the network monitoring strategy
Additional Information and Evidence
The layered monitoring approach is grounded in extensive research, case studies, and established industry standards. Here are some key references and insights supporting this approach:
-
Research on Monitoring Best Practices
Effective network monitoring relies on comprehensive data collection, proactive alerting, and targeted notifications. Keysight’s white paper on network monitoring emphasizes the importance of technologies such as network packet brokers for filtering and efficient data management.
Keysight White Paper – Best Practices for Network Monitoring -
Case Studies Demonstrating Successful Implementation
Apriorit discusses how detailed monitoring and proper data analysis improve network performance and issue resolution.
Apriorit Case Study on Network Monitoring -
Industry Standards and Guidelines
Established frameworks such as NIST SP 800-137 and ITIL promote a structured monitoring strategy that emphasizes data collection, alerting, and notification.
NIST SP 800-137 – Continuous Monitoring Guidelines
ITIL Best Practice Solutions
Benefits of the Layered Monitoring Approach
Adopting a layered strategy yields several key advantages:
-
Comprehensive Monitoring and Data Availability
Extensive observability ensures critical data is captured for deeper analysis and anomaly detection. This supports informed, strategic decisions.
Keysight White Paper – Best Practices for Network Monitoring -
Facilitates Proactive Network Management
Monitoring and alerting detect real-time issues and trigger automated responses to minimize impact.
Apriorit Case Study on Network Monitoring -
Efficient Response and Resolution
Critical notifications are directed to the right personnel to ensure rapid intervention and minimal downtime.
NIST SP 800-137 – Continuous Monitoring Guidelines
In summary, the layered monitoring model—comprising observability, alerting, and notifications—is a validated, research-backed framework that enhances the ability to maintain healthy network infrastructure.
References
Books and Articles
- The Practice of Network Security Monitoring – Richard Bejtlich
- Network Management: Principles and Practice – Mani Subramanian
- Effective Monitoring and Alerting – Slawek Ligus and Stephen Thorne
- Keysight White Paper – Best Practices for Network Monitoring
Industry Guidelines
References
Links to books, articles, and industry guidelines
Books and Articles
- "The Practice of Network Security Monitoring: Understanding Incident Detection and Response" by Richard Bejtlich: This book provides a comprehensive overview of network security monitoring concepts and practices, including data collection and analysis techniques.
- "Network Management: Principles and Practice" by Mani Subramanian: This book covers various aspects of network management, including monitoring strategies and tools, providing foundational knowledge for understanding and implementing effective network monitoring.
- Keysight White Paper on Network Monitoring Best Practices: A detailed white paper discussing various best practices for network monitoring, emphasizing the importance of comprehensive data collection and proactive alerting. Read the white paper.
- "Effective Monitoring and Alerting" by Slawek Ligus and Stephen Thorne: This book explores strategies for building effective monitoring systems and creating meaningful alerts that help manage complex IT infrastructures.
Industry Guidelines
- NIST Special Publication 800-137: Information Security Continuous Monitoring (ISCM) for Federal Information Systems and Organizations: This document provides guidelines for establishing, implementing, and maintaining an effective continuous monitoring program. Explore NIST guidelines.
- ITIL (Information Technology Infrastructure Library) Best Practices: ITIL provides a comprehensive set of best practices for IT service management, including effective monitoring and alerting guidelines. Learn more about ITIL.
- ISO/IEC 27001: Information Security Management: This standard specifies the requirements for establishing, implementing, maintaining, and continually improving an information security management system, including guidelines on monitoring and measurement. Read ISO/IEC 27001 standard.
Expanding the Monitoring Horizon with NetCrunch
Read how NetCrunch goes beyond typical network monitoring to deliver a comprehensive service-based monitoring solution for industrial monitoring, smart city monitoring, IoT, and physical security systems
Network monitoring has evolved beyond traditional approaches to encompass a service-based model in today's interconnected world. This shift is driven by the increasing variety of devices and systems that connect to networks. NetCrunch exemplifies this modern approach by offering the capability to monitor virtually any device or service, from coffee machines to traffic lights, lab equipment, and physical security devices like alarms and cameras. Here's how NetCrunch goes beyond typical network monitoring to deliver a comprehensive service-based monitoring solution.
Beyond Traditional Network Monitoring
Traditional network monitoring focuses primarily on ensuring the performance and availability of network infrastructure—servers, switches, routers, and similar hardware. While essential, this approach is no longer sufficient in an era where an ever-growing array of devices and services are network-connected. NetCrunch expands the scope of monitoring to include:
- IoT Devices: Devices such as intelligent coffee machines, thermostats, and lighting systems.
- Industrial and Lab Equipment: Sensors, lab machines, and environmental monitoring tools.
- Smart City Infrastructure: Traffic lights, public transportation systems, and environmental sensors.
- Physical Security Systems: Alarms, surveillance cameras, and access control systems.
Treating Everything as a Service
NetCrunch's flexible architecture allows it to monitor any device or service that can connect to a network, treating them as services. Several key features facilitate this service-based approach:
-
Custom Scripting and Telemetry: NetCrunch allows users to write custom scripts and send telemetry data to the platform. This capability is critical for integrating unique or non-standard devices into the monitoring framework.
-
REST Protocol Integration: Using the ubiquitous REST protocol, NetCrunch can receive data from virtually any device or application. This open and flexible approach ensures that NetCrunch can adapt to various monitoring needs and device types.
-
Expanding Protocol Support: With each new version, NetCrunch adds support for more protocols and extends its abilities to connect with an increasing variety of device categories. This continuous enhancement ensures that NetCrunch remains compatible with emerging technologies and devices.
Use Cases
Smart Facilities Management
Monitoring HVAC systems, lighting, and security devices in smart buildings. NetCrunch can provide real-time data on energy usage, environmental conditions, and security alerts.
Industrial IoT
Supervising the performance and status of industrial equipment and sensors. This includes real-time monitoring of production lines, equipment health, and environmental conditions in manufacturing facilities.
Healthcare and Laboratories
Monitoring critical lab equipment and environmental conditions. NetCrunch can ensure that lab conditions remain within specified parameters, preventing costly equipment failures or compromised experiments.
Smart Cities
Managing and monitoring public infrastructure, including traffic lights, street lighting, and public transportation systems. NetCrunch can help cities optimize traffic flow, enhance public safety, and improve energy efficiency.
Future-Proofing with NetCrunch
NetCrunch's commitment to expanding its monitoring capabilities ensures it remains a versatile and future-proof solution. As new devices and technologies emerge, NetCrunch's ability to integrate and monitor them ensures that organizations maintain comprehensive visibility and control over their entire network ecosystem.
In conclusion, NetCrunch's service-based monitoring approach allows it to go beyond traditional network monitoring, providing comprehensive oversight of various devices and services. By leveraging custom scripting, telemetry data, REST protocol integration, and continuous protocol expansion, NetCrunch offers a robust solution that adapts to the ever-evolving landscape of network-connected devices. This flexibility and extensibility make NetCrunch an invaluable tool for modern network management.
System Overview
Discover all of NetCrunch capabilities, concepts, and components.
NetCrunch employs unique concepts for data organization and monitoring settings management to monitor today's complex networks.
System Requirements
The basic requirements are a 64-bit Windows Server, 2 processors, and 3.5 GB of RAM—an SSD driver is also welcome. NetCrunch is designed to run efficiently on both virtual and physical server machines.
Hardware Requirements
Server
NetCrunch must be installed on a 64-bit Windows Server (Windows Server 2016, 2019, 2022, 2025). It has a web server and an embedded SQL database for storing and monitoring event data.
NetCrunch can be installed on a virtual machine, provided you assign at least 4 cores and 4 GB RAM.
More processors are better for monitoring 1000+ nodes; the recommended number in such cases is at least 8 CPU cores.
Monitoring a large volume of performance metrics (100,000 network interfaces) requires additional RAM (500,000 performance metrics will need an extra 4GB).
The other important component is the hard drive. We strongly recommend using SSD drives.
The Architecture and Concepts section explains why this is so important.
Administration Console
NetCruch Console runs on 32-bit or 64-bit Windows 10 or later systems with at least 4 GB of RAM. It requires a 24-bit color depth and high resolution. It should be run on at least Full HD screens or multiple monitors. The console also works excellently with touchscreen Windows tablets.
Web Console
Web Console is compatible with modern, evergreen browsers, including the latest versions of Chrome, Opera, Edge, Firefox, and Safari.
Antivirus on Server
Interference with NetCrunch
NetCrunch keeps part of the data in memory, writes some to trend log files (NetCrunch opens thousands of them), and stores other data in an SQL database. A problem can occur when NetCrunch writes a file containing a snapshot of in-memory data, and antivirus software attempts to access it at the same time.
Antivirus software can sometimes cause high disk and CPU utilization and may prevent NetCrunch from accessing data.
Excluding data folders
We know that sometimes you can't change the company policy, and after Solorigate, it seems even better practice to run security software on servers. In this case, you must exclude all data directories where NetCrunch writes data.
Our experience shows that servers sometimes behave in unexpected ways, depending on the antivirus vendor.
Please also note that disabling antivirus software resembles disabling stability control in your vehicle—it's only partially off. The hooks installed in the system are still in place and continue to unpredictably alter the system's behavior. The other problem is that antivirus software might sometimes cause 100% utilization of a single processor.
Avoid Server Sharing
Depending on the processed data, NetCrunch can heavily utilize a server machine. Avoid competing with other programs for resources. NetCrunch includes many servers, such as the database, monitoring, and web server, so we are already putting a heavy load on a single machine.
In some cases, NetCrunch cannot process all data (events) due to hardware limitations. Remember that a single machine's speed is limited by its slowest components (hard drive, memory, or lack of cores).
Use Appropriate VM resources
Assign the machine an appropriate amount of processing time. Memory must also be physically available, as disk swapping should not occur. You need to reserve at least 4 cores and 4 GB. We recommend doubling these numbers to monitor more than 100 nodes.
NetCrunch is a real-time Network Monitoring System.
Architecture and Concepts
Overview of NetCrunch Server architecture. Learn more about Monitoring Engines, NetCrunch Consoles, databases, additional tools, and critical concepts of advanced network visualization.
Architecture
NetCrunch is a comprehensive system consisting of many components that communicate with each other. Most of them work on the NetCrunch Server, and configuration can be done with the Administration Console that users can run remotely (recommended). An additional NetFlow Collector with its database is also a part of the NetCrunch Server environment. The monitoring engine is responsible for performing monitoring tasks - the same set of processes included in the Monitoring Probe. The Dashboard server in the form of GrafCrunch Server can run on another machine.

The server works best on a dedicated machine (virtual or physical) with the appropriate resources assigned. If you want to process Gigabytes of data, you need SDD disks and a multicore machine. Read more in System Requirements.
NetCrunch Server also works well with vSphere Fault Tolerance, which provides continuous availability for NetCrunch Server.
NetCrunch Components
Server Services
The complete list of NetCrunch services is as follows:
- NetCrunch Server
- A central server provides monitoring logic, performance trend storage, and communication infrastructure for other components. It is a parent process for additional services, such as
Monitoring Engine,NC ServicesandNC Event DB. - NC Services
- Additional background processes working as server extensions. It handles actions, integrations, message processing, task scheduling, etc.
- NC Event DB
- It handles the event database and all its tasks.
- NC Reports
- Report rendering engine
- NetCrunch Advanced SQL Server
- Provides storage, processing, and controlled access to the Event Log data.
- NetCrunch Flow Collector
- Collects and analyzes flow data (NetFlow, sFlow, IPFix, and others).
- NetCrunch Data Updater
- Updates various files used by NetCrunch.
- NetCrunch Guard Service
- Watches server execution.
- NetCrunch Web Server
- NetCrunch embedded Web Server provides Web Console, Mobile Console, and REST API services. It uses the latest security patches and includes support for HTTPS, including TLS 1.3
- NC Hooks
- Webhook processing plugin for NetCrunch Web Server
- NC REST API
- Separate process for handling REST queries. Plugin for NetCrunch Web Server
- Client Requester
- Communication relay between Web Server and NetCrunch
Monitoring Engine
The monitoring engine process is the monitoring probe integrated into the server. It collects all monitoring data. It runs as a separate entity and manages separate engines for monitoring Network Services, SNMP, Interfaces, OS Monitors, Virtualization, and hundreds of sensors.
Operating system monitoring for Windows, macOS, Linux, Solaris, BSD, ESXi, or Hyper-V depends on appropriate node settings. See: Automatic Monitoring and Organizing.
Consoles
Administration Console
You can configure NetCrunch with the Desktop Administration Console, which you can install on any Windows system.
The console can utilize three different connection encrypted methods:
- local (TCP)
- WebServer (WSS)
- NetCrunch Connection Cloud (HTTPS, WSS)
We recommend using an SSL certificate for the NetCrunch Web Server, even for local use. This allows your Desktop Console to establish a secure SSL connection as well. For remote access, you can safely use the console over the internet through NetCrunch Connection Cloud.
The console caches large amounts of data and transfers only changes over the network, ensuring that updates appear instantly without requiring a manual refresh. It also supports the creation and saving of complex screen layouts, including multi-screen setups.
GrafCrunch
NetCrunch comes with a fork of the open-source project Grafana v7, one of the top open-source performance visualization projects. Grafana dramatically increases the possibilities of creating live performance dashboards and allows you to present data from various sources. Grafana has a separate installer and integrates with NetCrunch. It gives you an easy way to create dashboards from multiple NetCrunch Servers and other sources that Grafana supports.
Web Console
It is a modern HTML console that allows instant access to the server. It requires browsers not older than 1 year. You can manage access to the console through user accounts and access rights profiles.
Web Console provides mostly browsing capabilities. You might need an Administration Console to edit monitoring configuration and monitoring policies. Graphical Data views can be edited in Web Console, though.
Basic Concepts
NetCrunch was initially designed to monitor hundreds of devices and thousands of parameters. However, it scales seamlessly to monitor thousands of devices and hundreds of thousands of parameters using a single server. Our approach to scaling emphasizes both performance and ergonomics.
The policy-based configuration makes managing complex infrastructures straightforward. Rather than setting individual alerts and reports for each monitored node, which can be time-consuming in other programs, NetCrunch automatically applies these settings based on predefined policies. This significantly reduces the time required to configure and manage each node.
Network Atlas
Network Atlas is a central database containing all your network data. It's organized by the hierarchy of the Atlas Node Views.
It contains all your network data and helps you organize it into various views. Many of the views are created automatically.
The fundamental element of the Atlas is a network node—a single-address network endpoint. The Atlas Tree shows the hierarchy of all views and helps you quickly recognize the status of each element.
Atlas Views
Atlas Node View shows various aspects of the group of nodes in the Network Atlas and consists of multiple pages such as nodes, maps, dashboards, and others.

Atlas begins with a top root view of all nodes. This view shows top-level dashboards such as Status, Top Charts, and Flows.
The rest of the views are divided into sections:
IP Networks
This section consists of IP network views/maps. Each network can be periodically re-scanned to reflect its current state, and you can create a custom graphical map for each view. By default, node view shows node icons automatically arranged by device model and OS name.

Sites
We introduced the concept of sites (aka address spaces) to prevent confusion when monitoring nodes with the same network addresses.
- Local - NetCrunch Server - means all addresses visible (local) by NetCrunch Server. You can place an additional Monitoring Probe within this address space for load balancing.
When two locations use the same private network address, they create two distinct sites.
Network Topology
This section contains views regarding network topology. It includes logical (routing) and physical connection maps (layer 2).
Routing Map
The view shows connections between IP networks and devices, providing these connections (routers).
Physical Connections
The top-level view shows connections between switches, and then each switch port mapping is represented on a separate view. Each segment (single switch) view automatically presents the traffic summary on each switch port.

Live Network Interface Status
NetCrunch offers views of ports and interfaces of the switch and provides live status for the particular interface.

Custom Views
This section allows you to organize your network data in any way you need. It contains both user-created views and predefined automatic views.
Dynamic Node Views & Folders
Based on typical customer atlases, we prepared many automatic (and dynamic) views for you, such as:
- Nodes with Issues
- Unresponding Nodes
- Responding Nodes with Active Alerts
- Monitoring Probes
- Receiver Nodes
- Business Status Nodes
- Server Types (i.e., Linux, Windows Server, etc.)
- Device Groups (Printers, Switches, Wireless, etc.)
- Workstation Types (Windows 7, Windows 8, Windows 10, etc.)
- Locations (Office, Building 1, Server Room - based on SNMP or manually entered data)
- Network Roles (Network, Printers, Servers, Workstations)
- Windows Domains
- Virtual Machine Hosts
- Organizations
- VLANs
- Operating System Monitoring
- Nodes Using Templates
The views are dynamic, which means they are automatically updated as needed.
Live Maps, Diagrams, and Dashboards (Graphical Data Views)
Graphical views are designed to present various performance and status data in graphical form. They can be diagrams or maps, where you can put many small elements. If they do not fit on the screen, you can drag and zoom as you would on regular maps.
Another option is to create a panel with given proportions and put elements inside it. Such a panel will fit a screen of a given proportion regardless of size. Panels are not scrollable and are always scaled to fit into available space.
Add some screenshots and link to the setup
Monitoring Dependencies
Monitoring Dependencies reflect network connections and allow for preventing false alarms and disabling monitoring of unreachable network components.
NetCrunch allows setting dependencies upon node routes, virtualization hosts, and known switch Layer 2 connections.

Monitoring Packs
Monitoring Pack is a group of performance parameters and events monitored and collected for the reports.
Monitoring Packs can be assigned to a node automatically (by a specific rule like for every Windows Server or for every Cisco switch) or manually. NetCrunch comes with many predefined Monitoring Packs.
Automatic Monitoring by Device Types
Many predefined Monitoring Packs are automatically assigned to nodes based on the node Device Types' setting. The setting can be either automatically discovered or set manually.
Setting a proper Device Type is one of the essential tasks in configuring NetCrunch.
Device types will likely be set automatically for network components retrieved from Active Directory. NetCrunch can also automatically discover many SNMP devices.
Other devices, such as printers or Linux machines, need proper Device Types to monitor.
For example:
When you need to monitor a new macOS device, there are only two easy steps to do:
- add the device to the Atlas
- and set its device type to macOS system.
Then, the node will automatically receive a macOS Monitoring Pack.
It's that simple.
Events & Alerts
Alerts are an essential part of the monitoring program and one of its fundamental use cases. NetCrunch allows advanced alert processing, including correlation, conditional events, conditional actions, and escalation.
To clarify, whether we watch or not, events happen. "Event" becomes an "Alert" as we assign some reaction to it (it becomes an element of interest).
The simplest (default) action stores information about the event in the NetCrunch Event Log. We can assign a different list of actions to each event. The actions can include a notification (email, SMS texting) or some corrective actions, like executing scripts or programs (also on a remote machine). NetCrunch executes actions after the alert starts and when it's closed (finished).
External Events
As a monitoring program, NetCrunch is a primary source of status events and performance metrics alerts (counters). The program can also monitor external events. It matches incoming events with rules and triggers alerting actions for them. This feature allows you to trigger alerts and actions on SNMP traps, syslog messages, text logs, or Windows Event Log entries.
Active Alerts
As many alerts are short-lived and can be self-corrected (like connection or power loss), administrators should concentrate on existing problems instead of constantly looking into the log.
NetCrunch simplifies alert management by correlating all internal alerts so they disappear from the Active Alerts view if closed.
The program allows for correlating external events (SNMP Traps, syslog, etc.) by defining the list of closing events for each external alert.
Conditional Alerts
Simple alerts work when alerting conditions are met, such as "node is down" or when some external notification has been received.
What about something that did not happen, or is it not happening regularly? You can solve such problems with conditional alerts, which allow more complex scenarios such as: notifying when the syslog message was not received or if an event happened in a specified time range.
Available conditions:
- On event
- if event happened after (x) of time
- if the event happened more than (x) times
- Only if within a time range
- Only if not within a time range
- If the event has not happened in a given time range
- if the event did not happen after (x) of time
- if the event is active for more than (x) of time
Correlation
Advanced correlation allows you to trigger events only if multiple events (from different nodes) have happened within a given time range or all are active simultaneously. Active event correlation requires all correlated alerts to be in an active state. This feature easily allows you to define an alert when two redundant interfaces are down.
Alert Actions and Escalation
In response to an event, NetCrunch can execute a sequence of actions. Actions can be executed immediately or with a delay (if the alert is not cleared), and the last action can be repeated. For example, you can send a notification to a particular person and then execute a server restart operation if the event remains active after some time.
See: Alerting Actions
Conditional Actions
Each action can be limited to run only if a triggering network node belongs to a given atlas view (these can be created by rules or manually) or within a given time range. This ability allows you to create flexible alerting scripts, such as sending different notifications depending on the node location. Alerting scripts can be used for multiple alerts, so you can limit actions to executing only when an alert is of a given severity.
Preventing False Alerts
NetCrunch uses various techniques to avoid false alerts or protect against alert floods, sometimes caused by device malfunctions. The program waits several seconds for a device to send a syslog message or SNMP traps to NetCrunch. If the same message appears several times, it won't trigger multiple alerts. NetCrunch uses an event suppression technique to detect false events caused by intermediate connection failures.
NetCrunch Tools
IP Tools
IP Tools is a set of network monitoring tools that allow testing the availability of devices and network services on a host, scanning ports, and checking the routes of test packets or connection bandwidth.
Performance Trend Analyzer
A tool for accessing NetCrunch performance data. You can analyze trend charts and data distributions for a given time. You can compare multiple parameters on a single chart.
SNMP MIB Compiler
This program allows compiling MIB files to extend NetCrunch's MIB library.
Reports
Allows for viewing and managing various NetCrunch reports.
What Is a Node in NetCrunch?
This topic explains the definition of a Node in NetCrunch. It clarifies why a Node is treated as a service endpoint rather than a physical device, and how this distinction improves monitoring accuracy for modern infrastructure.

Core Concept
In NetCrunch, a Node is a Service Endpoint, not necessarily a physical device.
While a Node often corresponds to a physical device (such as a switch or server), NetCrunch defines it as a logical root entity to which monitoring data is attached. This distinction allows you to monitor what is running and reachable, rather than just the hardware box itself.
Why This Distinction Matters
Traditional monitoring tools often use a "Device-Centric" model, where each piece of hardware corresponds to a single entry in the monitoring tree. This approach struggles with modern infrastructure:
- Virtualization: One physical server may host dozens of critical, distinct virtual machines.
- Cloud & SaaS: A service like "Office 365" has no physical device you can manage, but it is a critical endpoint.
- Shared IPs: A reverse proxy or load balancer may serve multiple distinct applications on a single IP address.
By treating the Node as an Endpoint, NetCrunch allows you to model these scenarios accurately without being tied to physical hardware constraints.
Types of Nodes
NetCrunch supports several node types to cover various monitoring scenarios:
1. IP Node (Network Endpoint)
The most common type. It represents a network-reachable entity, usually identified by a DNS name or IP address.
- Use case: Servers, routers, switches, printers.
- Key characteristic: It can host multiple network services (HTTP, SSH, SQL), which are monitored as sensors attached to this node.
2. Cloud Service Node
Represents an external API or SaaS platform.
- Use case: AWS CloudWatch metrics, Azure monitoring, Office 365 status.
- Key characteristic: Models service availability and performance, abstracting away the provider's infrastructure.
3. Telemetry Node
A data ingestion point for push-based metrics.
- Use case: Receiving data from scripts, IoT devices, or applications that push JSON/XML data to NetCrunch.
- Key characteristic: Often has no network address to ping; it simply exists to receive and visualize data.
4. Virtual & Composite Nodes
Logical nodes are used to group dependencies or calculate business status.
- Use case: A "Corporate Email" node that aggregates status from the SMTP server, the DNS server, and the Cloud Gateway.
- Key characteristic: Exists purely as a status root for business logic.
Practical Example: One Server, Multiple Nodes
To understand the power of the Endpoint model, consider a single physical Linux server running both a database and a web server for two different departments.
In NetCrunch, you can model this as:
- Node A (Infrastructure): Monitors the Linux OS, CPU, RAM, and disk space.
- Node B (Web Service): Monitors the HTTP endpoints and SSL certificates.
- Node C (Database): Monitors the SQL performance metrics.
Even though they share the same hardware, they can have different:
- Alerting rules (SQL team vs. Web team)
- Dependencies
- Reporting schedules
Summary: The NetCrunch Mental Model
When adding a Node to NetCrunch, do not ask: "What physical hardware is this?"
Instead, ask:
- What acts as the endpoint? (IP, URL, API, or Logical Group)
- What data belongs to this endpoint?
This shift allows you to build a monitoring strategy that mirrors your services, not just your inventory list.
Monitoring Architecture
NetCrunch supports multiple types of monitoring techniques, each suited to different levels of control, flexibility, and scale. This topic explains the key architectural types — network services, monitors, and sensors — and clarifies when to use each for best results.
Overview of Monitoring Types
NetCrunch defines three core monitoring categories:
- Network Services – Application-layer service probes that test responses, not just open ports.
- Monitors – High-level modules with shared credentials and connection config, used with monitoring packs.
- Sensors – Standalone checks targeting specific metrics, services, or custom logic.
Each category serves a different purpose and optimizes different aspects of the monitoring workflow.
Network Services
Network services operate at the application protocol level, not just the transport level.
Key Properties
- Purpose: Verify that a service responds correctly to a real request, not just that the port is open.
-
Behavior:
- Sends protocol-specific requests (e.g., HTTP GET, SMTP HELO).
- Validates response content and timing.
- Measures latency and detects incorrect or failed responses.
- Configuration: Centralized; can be auto-applied during discovery or assigned manually.
- Customization: Users can create custom service definitions for proprietary protocols or extended validation.
- Examples: HTTP, SMTP, DNS, LDAP, POP3, SSH, SNMP.
These are useful for confirming basic service availability and performance without requiring full sensors. They’re widely used in discovery and network-level health checks.
Monitors
Monitors are high-level modules that use shared configuration to efficiently manage a wide range of systems.
Key Properties
- Purpose: Collect broad sets of metrics across nodes using one set of credentials and connection rules.
-
Behavior:
- One configuration defines access credentials (e.g., SNMP, WMI, SSH, REST).
- Metrics and checks are defined by monitoring packs.
- A monitor manages many nodes of the same type efficiently.
-
Advantages:
- Reduces repetition by applying the same connection settings across nodes.
- Ideal for infrastructure-wide monitoring (e.g., all Windows servers).
- Monitoring packs define alerts, counters, and metrics in reusable groups.
Examples
- Windows Monitor
- SNMP Monitor
- Linux/SSH Monitor
- ESXi Monitor
Monitors are powerful building blocks. They act as gateways for monitoring packs, enabling broad observability with minimal configuration effort.
Sensors
Sensors are individual monitoring objects applied directly to nodes or templates.
Key Properties
- Purpose: Collect targeted metrics, validate conditions, or trigger alerts based on custom logic.
-
Behavior:
- Each sensor operates independently.
- Requires per-sensor configuration, including credentials or input parameters.
- Flexible and granular — suitable for custom monitoring pipelines or isolated targets.
- Inheritance: WMI-based sensors can optionally reuse the WMI Monitor configuration.
Examples
- Basic HTTP
- SQL Query:Data
- IPMI Log
- DICOM C-Echo
- File, Folder, and Log parsers
- Text Log, Data File
- REST API sensors
Sensors are perfect when monitors are not available or when fine-grained control is required. They can monitor APIs, run remote scripts, or analyze logs from external systems.
When to Use Each Type
| Situation | Recommended Monitoring Method |
|---|---|
| Verify web server availability | Network Service (HTTP) |
| Monitor CPU, memory, disk on all Windows nodes | Windows Monitor + Monitoring Packs |
| Track backup job status from Veeam | Veeam Sensor |
| Test REST API for JSON metric | REST HTTP Sensor |
| Confirm that DNS resolves a domain | DNS Network Service or DNS Query Sensor |
Legacy and Forward Strategy
Some legacy network services (e.g., CHARGEN, FINGER, QDAY) remain for compatibility but may be deprecated in future versions. These services reflect older protocols and rarely-used checks.
Future monitoring logic favors monitors and sensors, which offer more flexibility, scalability, and integration options.
Summary
NetCrunch separates monitoring into three architectural types:
- Monitors manage large groups of nodes via a central config and monitoring packs.
- Sensors provide precise control and customization per check.
- Network Services validate service responses at the protocol level and serve as fast, lightweight probes.
Choosing the right type depends on your scale, granularity needs, and monitoring strategy.
What can I monitor?
NetCrunch can monitor nearly anything: devices, applications, systems, databases, and files. The program can be extended using scripts; data from various sources can be sent to NetCrunch or polled from files, databases, or websites.
There are many different usage scenarios for NetCrunch. In general, NetCrunch retrieves and processes three types of data:
- Events
- Information about some occurrences generated by NetCrunch or external sources such as Windows Event Log, SYSLOG, or SNMP trap.
- Performance Counters (Metrics)
- Numerical values (64-bit integer or floating-point)
- Status
- The status of various objects in NetCrunch, such as nodes, services, monitoring engines, etc.
The server allows you to set various conditions to filter incoming events or set alerts on performance counters. You can even create new calculated counters. See the Managing Calculated Performance Counters topic for details.
Network Infrastructure (SNMP)
NetCrunch can be used solely for network monitoring, focusing mainly on SNMP devices such as printers, switches, routers, cameras, and others. NetCrunch supports SNMP v1/v2c/v3, including encryption and authentication.
Connectivity & Response Monitoring
NetCrunch monitors the availability of over 70 predefined TCP/UDP network services, including DNS, FTP, HTTP, POP3, SMTP, and more.
The program can monitor network service performance by counting the number of packets sent and received, calculating response times, and calculating the percentage of packets lost and received.
The program checks connectivity, validates service response, and measures response time for each monitored service. For each sensor, the program allows monitoring of various conditions (e.g., whether the text contains a pattern, whether a file exists, and so on) and performance metrics (e.g., response time or data size).
You can create custom service definitions or duplicate an existing definition and change its port. Services support TCP, UDP, and SSL connections. Response patterns can be defined as text, binary data, or regular expressions.
Node Up/Down Status
NetCrunch determines node up/down status based on network service status and other monitors (for servers). When a node is down, only the leading service is being monitored. A node is considered "down" when no services respond, and "up" when the leading service responds.
DNS Health Monitoring
DNS is the most critical service in a network. Without it, nothing works at all. Therefore, monitoring the DNS service to check its availability is an obvious task for a monitoring system. However, availability monitoring only verifies whether the service is responding and the response time.
In addition to pure availability monitoring, NetCrunch allows you to verify DNS responses to given queries, which can enable you to discover unexpected (unauthorized) DNS changes.
Switch and Router Monitoring
NetCrunch supports switch and router monitoring, including network interface status, error and discard monitoring, and bandwidth monitoring. It allows traffic to be monitored on interfaces and port mappings, and to create Layer 2 graphical maps.
NetCrunch allows you to monitor Cisco IP SLA operations. The program tracks the status of operations and also their performance metrics. Cisco IPSLA allows you to monitor VOIP jitter and other protocols and parameters.
Vendor-Specific Monitoring via SNMP
SNMP is ubiquitous, but implementations vary. NetCrunch includes an MIB compiler that lets you add vendor-specific MIBs.
Since basic MIBs have been only partially defined in RFCs, vendor MIBs can be tricky to compile. If you have no experience compiling MIBs and find it difficult, please ask AdRem support for help. We will try to help you, and if the device is popular on the market, we can add it to the precompiled MIB set. Please note that NetCrunch's built-in database already contains more than 8,850 vendor MIBs.
Servers and Applications
NetCrunch supports agentless monitoring of the major operating systems, including Windows, macOS, Linux, BSD, Solaris, and VMWare ESXi. Additionally, the Windows system supports application monitoring by monitoring its performance parameters and service status.
You can also use SNMP to monitor these systems, but please be advised that using SNMPv2 can create a security loophole in operating systems, as SNMPv2 transmits data in plain text.
Windows Monitoring
Performance Counters
NetCrunch allows you to monitor all Windows performance counters, including disk counters, remotely. The list of available counters depends on the specific system and installed applications. Nine different trigger types can be used to set alert triggers on counters.
Windows Services
Monitoring Windows services is essential for monitoring most applications installed on Windows Server. The most frequent alert set on services is Service is not running. NetCrunch also offers a Windows services view in the node status window, allowing remote service control.
Windows Event Log
NetCrunch can remotely gather, filter, and analyze data from multiple Windows machines using WMI.
The program allows you to define simple alert filters to convert event log events into NetCrunch alerts. These filters are automatically converted into complex WQL queries.
WMI Sensors
NetCrunch includes 16 WMI sensors. WMI Perform resembles perfmon using the WMI protocol, WMI Query object allows you to write your query, and then you can add alert triggers on the result object properties. Process and Process Group summaries are handy for monitoring processes and their resources. Using the Process Group Summary sensor, you can easily track the total resources used by a web browser or other program using multiple process instances.
Hardware and Software Inventory
NetCrunch can collect hardware and software inventory information from Windows computers. The program shows detailed information about each machine and lists installed fixes. NetCrunch lets you compare each audit and display hardware and software changes. The program includes a software summary view for multiple nodes.
Monitoring Files, Folders, and Text Logs
This type of monitoring is available for Linux (and other Unix family systems) and Windows. These file sensors allow you to monitor file presence, size, and modification time. It can also search file contents, find new text log entries, and convert them into NetCrunch alerts.
The Folder sensor allows you to monitor specific folder contents, such as when a new file is added or if any files are removed.
These sensors support FTP/s, HTTP/s, SSH/bash, SFTP, and Windows/SMB protocols.
Linux, macOS, Solaris, and BSD
NetCrunch can track over 100 performance counters to determine the health of Linux servers running kernel 2.4 or newer. The program has been tested to monitor the following Linux distributions: CentOS, Red Hat, Fedora, Novell OES, Ubuntu Desktop, and Server.
NetCrunch also offers fully integrated Mac OS monitoring. All macOS versions are supported, including the latest one.
The most important parameters being monitored:
- System (uptime/downtime, logged-in users)
- Processor utilization
- Memory usage
- Disk usage
- Network interface statistics
- Processes (CPU & memory per process utilization)
- User (CPU & memory)
- TCP statistics
Monitoring VMware
NetCrunch supports ESXi versions 5.5 and later. It can connect directly to ESXi servers or via vCenter. When NetCrunch works in vCenter mode, and vCenter becomes unavailable, it can automatically switch to direct ESXi monitoring if you provide proper credentials for each ESXi server.
NetCrunch includes preconfigured Automatic Monitoring Packs for ESX when the device type is set to ESX.
Mail Server, Mailbox, and Email Monitoring
NetCrunch allows monitoring of mailboxes (IMAP or POP3), checking email content (extracting data or events from emails) using the Data Email sensor, or checking full mail server functionality by sending and receiving control email (Email Round-Trip Sensor)
SQL Database Monitoring
NetCrunch offers two sensors. The first allows checking a single-row answer from the SQL query, which can be treated as a status object. The second can interpret multiple rows as a list of metrics. This way, NetCrunch can monitor database connectivity and authentication (with an empty SQL query), query execution time, and query results, which can be a single row representing a status object (so you can track changes in the state of properties) or metrics that can be kept for trend or used for performance triggers. NetCrunch natively supports Oracle, SQL Server, MySQL, MariaDB, and any ODBC (system) source.
Security Monitoring - SSL Certificate Sensor
Every web sensor in NetCrunch can report an invalid certificate. NetCrunch also includes a separate SSL Certificate sensor that can be used to validate any SSL/TLS-based protocol certificate. The sensor can be used for any TLS-based service, not just HTTP/S.
Monitoring Device Uptime
NetCrunch includes a universal sensor monitoring device that can be connected to using WMI, SSH, or SNMP protocols.
Monitoring Printers (SNMP)
The program allows monitoring printers using a printer sensor that retrieves all printer statuses and metrics.
RADIUS Sensor
The sensor checks the RADIUS protocol response and availability.
Cloud Monitoring
NetCrunch provides multiple sensors for monitoring Amazon Web Services, Azure, and Google Cloud. You can add each sensor by creating a Cloud Service node.
Read more about Cloud Monitoring
Device Configuration Monitoring
NetCrunch can collect, store, and detect changes in device configuration. The configuration is stored in a text file that can later be used for editing or restoring. The sensor and code are based on the Oxidized open-source project, ported to a NetCrunch environment.
Window Hardware Config
Similarly, NetCriunch collects the hardware configuration of Windows machines. The hardware configuration summary is available in the Nodes tab view.
Web Monitoring
Monitoring Web Pages or Applications
NetCrunch includes an advanced Web Page monitor that can load and render dynamic web pages containing JavaScript, as if a browser were loading them. It also allows you to check pages requiring the login (supporting standard HTML or custom login forms).
Available Web Page alerts:
- page size or load time
- page content change
- alert if the text is present or missing
- if a page does not exist
- page load error
- page resource load error
- page authentication error
Available performance metrics:
- % Availability
- HTTP Status Code
- JS Errors
- Load Time
- Main Frame Body Size
- Resource Count
- Resources Error Count
- Total Size
- Operating System Monitoring
Read about monitoring Windows, macOS, Linux, BSD, Solaris, and ESXi systems.
- Monitoring Packs
NetCrunch Monitoring Packs allow efficient management of monitoring settings. You can use them to create monitoring policies by setting node filters. They can also be assigned manually to the node (or multiple nodes using multiselection). Currently, the program includes more than 223 ready-to-use Monitoring Packs for monitoring devices, applications, and operating systems.
Monitoring HTTP Requests
This sensor is more suited for sending REST requests, so it simply retrieves data over HTTP and checks the response. It also allows you to check the response content. It supports GET, HEAD, and POST requests.
Data Receiver Sensor
Allows defining a sensor on the node to receive data from an external source (a device, script, or app). Data can be sent using the REST API, and you can set alerts on collected metrics and status objects.
- Monitoring Architecture
NetCrunch supports multiple types of monitoring techniques, each suited to different levels of control, flexibility, and scale. This topic explains the key architectural types — network services, monitors, and sensors — and clarifies when to use each for best results.
- Sending Data to NetCrunch
Read how to send data to NetCrunch and create a custom monitor. You can easily turn any application or script into a NetCrunch agent.
- Adding Targets to Monitoring
This topic provides instructions for adding monitoring targets to NetCrunch, including nodes, sensors, and data collectors. It covers configuring network services, operating systems, SNMP, virtualization platforms, and setting up alerting rules and dependencies. Additionally, it guides users on adding new nodes and using monitoring templates for efficient management.
NetCrunch Monitoring Objects
Explore a hierarchical data schema to organize monitoring across devices, sensors, services, and other monitoring targets, providing detailed insights into network health.
TODO: Finish
NetCrunch data schema hierarchical structure consists of several status objects. Top-level objects are nodes of various types, and then lower are other objects such as monitoring packs or sensors.
Object State
Object state names are designed to reflect their current status accurately:
- Critical, Error, or Down: The element is not functioning or is unresponsive.
- Warning: An issue requires attention, but no immediate action is needed.
- OK, Success: The element is functioning properly.
- Disabled: Monitoring of the element has been intentionally turned off.
- Unknown: The element's state is not determined because it has not been monitored or cannot be monitored.
Nodes
IP Node
The most common node type represents a device or virtual machine with an IP address.
Telemetry Node
The object represents the remote device without an IP address. So, you can send data and events to it using the REST protocol.
Cloud Service
The object represents a single monitored cloud service. NetCrunch provides ready-to-use sensors to monitor over 30 cloud services from Azure, AWS, Google, and others.
Probe
It represents a remote monitoring engine, not the device running the probe. You need to add it to the probe separately for monitoring.
Monitor
An internal element provides generic access to thousands of metrics through SNMP, WMI, VMware, etc. Monitors need to specify the target of their monitoring more clearly. Monitors utilize monitoring packs for specific monitoring elements. Monitors are too generic to rely on their status.
Monitoring Pack
Each monitoring pack is a group of alerts or metrics that must be collected or monitored for a specific element, such as an application, service, or hardware. NetCrunch provides over 260 packs for monitoring SNMP, Windows, Linux, macOS, BSD, Solaris, and VMware.
Monitoring Pack is a group of performance parameters and events monitored and collected for the reports.
Network Service
Network services are sensors specialized in protocol checks. They are lightweight, check the connectivity and response time, and verify the response from a given application. Network services are similar to IP SLA or NQA operations but are monitored from the NetCrunch Monitoring Engine (Server or Probe).
Sensors
Sensors are focused on specific monitoring needs such as monitoring a process, text log file, pending update, camera, SQL query, or web page.
Monitoring Sensor is a software module focused on monitoring a single object, service, or device (web page, file, folder, query, etc.).
Sensor Status Object
Sensor status objects are specific to a sensor. For a camera sensor, it's Snapshot Image, the last frame captured by the camera. Other objects might contain some data collected by the sensor. Sensor objects represent the status of the monitored object and specific data, and might have a different status than the sensor itself. Other examples are the Web Page and Process objects. Currently, when the tooltip for the object is displayed, it shows data in JSON format.
Alert
Alert - the condition being watched for action to react to potential danger or get attention.
The alert status is determined by its severity level. Informational and minor alerts are often considered ok as they do not require attention.
SNMP Value
This object is only available if you add an alert on event for SNMP variable value to a given node. The object is always in a success state. If you need detailed state, look at the alert associated with this object.
IP SLA/NQA Operation
First, enable IP SLA or NQA monitoring on a node, then add monitoring operations. Then you can refer to the status of these operations.
Composite Status
Technically, this is a node - a top-level object. It represents the summary (calculated) status of objects of any type, including Composite Status. See more in Composite Status
Automatic Monitoring and Organizing
You don't have to set up views and maps by hand or node by node. NetCrunch handles these tasks automatically.
Device Types
One essential part of the NetCrunch configuration process is setting proper Device Types for all nodes. NetCrunch detects a Device Type whenever possible by getting information from SNMP or Active Directory. If it can't, the Device Type can be set manually. Currently, operating system monitoring no longer depends on the node Device Type.
Operating System Monitoring
NetCrunch allows OS monitoring to be enabled in the node settings. The monitor can be enabled automatically if the device type is detected. Otherwise, you must manually enable the respective OS monitor for monitoring Windows, Linux, macOS, Solaris, BSD, or ESXi systems.
SNMP
Settings NetCrunch System Monitoring
SNMP monitoring depends on the profile you select for each node. The profile specifies the protocol's version and protocol-specific settings, such as community or username and password (v3).
To receive SNMPv3 traps, you must create SNMP notification profiles to provide authentication and encryption parameters. The profiles are matched with a trap by the User field. SNMPv1 and v2 traps do not need any profiles. All incoming traps are visible in the External Events window, making it easier to define alerts for them.
Monitoring Packs
NetCrunch has many automatic Monitoring Packs configured to be added to nodes when they meet certain conditions.
For example:
Basic Cisco (SNMP) Monitoring Pack
 Device Class should be "Hardware Router" or
 A Switch Manufacturer name contains "Cisco."
Active Directory Monitoring Pack
 Operating System equals "Windows Server."
 Network Service List contains LDAP or "Secure LDAP" services.
You can view the complete list in the Monitoring Packs article.
Auto-Discovery
Networks are dynamic, and new devices connect over time. NetCrunch can automatically add them to the Network Atlas and start monitoring them.
Discovering Nodes
NetCrunch can run the auto-discovery process for each IP network and Active Directory container. All discovered nodes can be added automatically, or the program can display the results in a Server Tasks Notification Window so you can later decide which nodes to add.
Discovering Services and Device Types
The program automatically runs service discovery when the node is added to the Atlas. It's only checking the list of services set in Settings Monitoring Auto Discovered Services
The program also detects device type based on the information read from SNMP or Active Directory. If the device type can't be detected, it should be set manually.
The program also discovers ESX/i machines.
Read more about: Auto Discovery
Node and View Status Calculation
Node Status
NetCrunch automatically identifies the status of every network service on the node, and at least one service must be monitored. If any service is not in the OK (green) mode, the node's status changes to Warning (yellow). When no service is responding, or all monitoring engines are DOWN, the node becomes DOWN (red).
The only service marked as* leading* is monitored when a node is in a DOWN state. If the service responds again, then the monitoring of all others starts again.
Node View Status
The view's status is calculated based on all node statuses included in the given view. If any node is in the Warning or DOWN state, the View Status is Warning.
When all nodes are DOWN, the view is DOWN, and when all nodes are OK, the view is OK.
- Monitoring Architecture
NetCrunch supports multiple types of monitoring techniques, each suited to different levels of control, flexibility, and scale. This topic explains the key architectural types — network services, monitors, and sensors — and clarifies when to use each for best results.
- Network Services Monitoring
Availability and performance monitoring of 70 network services such as FTP, HTTP, SMTP, etc.
- Monitoring SNI SSL Certificates
This topic explains how to monitor multiple SSL certificates on a single IP address (SNI) by treating each domain as a separate Node in NetCrunch, and how to accurately aggregate their status using a Composite Status Node.
- Glossary of Terms
- -Node Status
Automatic Atlas Views
Based on typical Atlases used by our customers, we prepared many automatic views in NetCrunch. You can delete or edit them if they don't meet your data organization's needs. Grouping nodes makes creating reports and watching the status of a given group easy.
Each group's status is calculated based on the included elements (nodes or map links).
Dynamic Views
The dynamic view presents a group of nodes based on the filtering criteria (query).
Predefined Dynamic Views:
- Nodes with Issues
- Unresponding Nodes
- Responding Nodes with Active Alerts
- Monitoring Probes
- Receiver Nodes
- Business Status Nodes
Dynamic Folders
In addition to views, there is another level of grouping: The Dynamic Folder. It creates Dynamic Views automatically.
For example, we can quickly create the following hierarchy:
- Folder for each location
- Each view shows servers in a location grouped by OS types
List of predefined and automatic folders:
- Server Types (i.e., Linux, Windows Server, etc.)
- Device Groups (Printers, Switches, Wireless, etc.)
- Workstation Types (Windows 7, Windows Vista, Windows 8, 10, etc.)
- Locations (Office, Building 1, Server Room - based on SNMP or manually entered data)
- Network Roles (Network, Printers, Servers, Workstations)
- Virtual Machine Hosts
- Organizations
- VLANs
- Operating System Monitoring
- Nodes Using Templates
- Windows Domains
The views are dynamic, which means they are automatically updated as needed.
Link to how to create automatic map layouts
Extending and Customizing
You can customize NetCrunch to suit your needs. Consider adding more MIBs and counters, creating views, and incorporating new device types, node fields, and node icons. Think about adding new background images for views, modifying notification message formats, defining new calculated counters, extending the node database, and developing alert action scripts.
You can: add more backgrounds, icons, device types, MIBS, Monitoring Scripts, Calculated Counters (Virtual), SNMP Views, Notification Message Formats, Additional Node Fields,
NetCrunch comes with many predefined resources, such as precompiled MIBs, Monitoring Packs, and icons. However, this might not be enough in the specific production environment, so we let you extend these resources accordingly.
Extending
SNMP MIBs
Now you can find any MIB for your device online. You can find collections of more than 65 thousand MIB definitions.
NetCrunch has its own MIB compiler, allowing you to compile any MIB. Because some MIBs contain bugs, they may be cumbersome to compile.
If you have any problems compiling MIBs, please let us know, and we will try to compile MIBs for you.
SNMP Views
NetCrunch contains definitions for the forms and tables displayed for SNMP data from a device. There are groups of specific, detailed views for certain devices, such as printers, switches, and other devices.
Using these forms, you can change SNMP variables. You can also create custom view forms and tables using SNMP View Editor.
rlinks##SNMP-view-editor
Custom Fields
Network nodes in NetCrunch are kept in an in-memory database and stored in XML files.
You can easily extend node data by adding additional fields.
It will allow you to classify and group network data to suit your needs.
The feature allows the creation of dynamic views based on these additional fields and using them to manage an alerting action as well.
Example:
- Problem:
- You want to notify a different group of Administrators (using groups is always more flexible than a single user), depending on the department and location where the server is located.
- Solution:
- Add a custom field for the department and set the location. Set up dynamic node views based on the department and location fields. In the Alert action list, you can now define different notifications for each defined view.
what is kept where??
Calculated Counters
Sometimes the device returns parameters that need to be calculated before further processing. For instance, the data needs to be divided, or we want to have percentages instead of raw values. You can solve such a problem by adding a Calculated Counter calculated upon the given expression. See Managing Calculated Performance Counters.
Custom Monitoring
You can extend NetCrunch monitoring using external scripts or programs, or create a custom parser for data processing. The script can be run locally on the NetCrunch Server or remotely on other machines. You can also poll data via HTTP or let the parser process data from a remote location via the REST API. Read more in Sending Data to NetCrunch
Customizing
Custom Views
In NetCrunch, you can create your views of node groups that make managing alerts and reports easier. You can create your graphical views with customized icons and widgets.
There are separate tables for each node group view showing data specific to a given Monitoring Engine. You can customize each view easily.
Customizing the Administration Console Screen Layout
The Administration Console can be very flexible: it can run on multi-monitor systems, and you can create a custom multi-monitor layout.
Customizing Notification Messages
Most events include many details describing their context. You would not be able to see all of them in the text message on your smartphone or even in the email. You can create message formats suitable for notification types and specific alert types. Include the information you need. The program automatically creates HTML emails (you can also customize them) when sending an email, and it uses plain text for SMS/text messages.
add link to window
Integrating NetCrunch with other NMS
You can easily integrate NetCrunch with existing management systems to extend its capabilities.
If you are already using some management system and would like to team it with NetCrunch as an extension of the overall network management system.
There are several ways to do it.
Integration by SNMP traps
If your system uses SNMP, the best approach is to use it. You can monitor and collect data in NetCrunch and send alerts using SNMP traps to the external system. NetCrunch can automatically define SNMP traps for each alert defined, so after reading NetCrunch generated MIB, you can successfully receive these traps in an external system.
Integration by Event files
(hamburger menu)Settings Alerting & Notifications Alerting Scripts Add Alerting Script Add Logging Write to unique file This is the most effective method of transferring events from NetCrunch to an external program. You can use an alerting action that writes each alert to a separate, uniquely named file.
The action allows using (write) some program periodically scanning the folder and importing event files to the external system. In this way, the disk is used as the queue for alerts. Each event can be stored in XML format.
Webhook Action
(hamburger menu)Settings Alerting & Notifications Alerting Scripts Add Alerting Script Add Logging Trigger Webhook
A webhook is a simple action that sends an HTTP request to a given URL, with all event data in JSON or XML.
Integration by External Program
Unlike previous methods, this method should be used only for a small number of events, as it requires running the process for each transferred alert, which can be quite slow.
Exporting NetCrunch SNMP MIB with traps
(hamburger menu)Settings Monitoring Export NetCrunch SNMP MIB
After defining all alerts, you might decide to generate NetCrunch MIB, containing SNMP trap definitions for all NetCrunch-defined alerts.
Exporting Performance Trends Data
You can also periodically export performance data from NetCrunch and import it to the other systems.
Add a description of user actions like executing a program or writing a unique file.
Active Directory Integration
It makes agentless Windows monitoring much easier.
Server Integration
NetCrunch runs on Windows Server and needs to integrate with Active Directory in order to properly access other Windows machines in the domain.
Starting from Windows 2003, every newer Windows Server version takes security settings to a higher level. This makes it impossible to access Windows machines without explicitly setting access rights.
When installing on a Server in Active Directory
-
The default option is to run the program on the local system account (which makes easy accessing local resources and communication between server components) and set up default credentials, common profile, or credentials for each machine (it's easy, as you can use multi-selection to do it). The only drawback is that it might trigger a security warning on some server systems, as the process running under the local system account first attaches as a machine object (machines are separate objects in AD), then logs in with the given credentials.
-
You can run NetCrunch Server services on a domain account that is a member of the local Administrator group of each monitored computer (including the server running NetCrunch Server). Sometimes it's a good solution, but it can also be hard or impossible to configure. It requires modifying AD security policies (remember, they need time to replicate).
Setting Active Directory account for the NetCrunch will give you:
- Proper security settings to remotely access performance data (Remote Registry, WMI, CIM).
- Access to AD information about computers and their systems.
You will still be able to access other Windows machines by giving local credentials for them, but it means that you have to input the necessary settings for each of them individually
User Accounts Integration
NetCrunch can use Active Directory user accounts as NetCrunch users. This allows keeping single passwords and makes management easier.
All you need to do is tick the Active Directory User checkbox when adding a new user. The username should be in the format:
<Domain>\
Managing NetCrunch Users through Active Directory Groups
You can manage access to NetCrunch by assigning access profiles to Active Directory groups.
A member of such a group can log in to NetCrunch with AD credentials and will receive the NetCrunch account automatically. NetCrunch will assign an access profile according to the group setting.
If the user is a member of multiple AD groups, he will receive his profile according to the order of the groups.
Distributed Monitoring
Learn about monitoring probes that expand on-premises monitoring into distributed environments across multiple sites and address spaces
NetCrunch allows distributed monitoring using Monitoring Probes. The probe is a single agent installed remotely and can monitor an isolated network without additional agents.
Monitoring Probes can also be installed at the same location as the NetCrunch Server, and you can offload the network monitoring to additional probes with a single click.
The Concept
We designed distributed monitoring to integrate with the existing monitoring concept seamlessly. If the node is located in a separate address space, its address includes an additional suffix.
 the above diagram has been created in NetCrunch
For example:
- When you see
192.168.0.234, it means it's the network address local to NetCrunch (Local - NetCrunch Server) - Where
192.168.0.234@New Yorkis the address located in theNew Yorkaddress space
Sites
$$
Site is a group of private networks usually behind NAT. When two locations use the same private network address, they create two distinct address spaces.
Monitoring Probe
Monitoring Probe is a monitoring agent software installed on a separate machine to increase the monitoring capabilities of the server or monitor a remote location within isolated networks otherwise not accessible by the primary monitoring system. It connects to the parent system.
The monitoring probe provides all monitoring and scanning features except the flow collector.
Adding nodes to be monitored by the Monitoring Probe
- First, you should add a Monitoring Probe node to NetCrunch Atlas. It doesn't have to be installed yet.
- Add an IP Node and select your probe from the Monitoring Providers list
You can add sensors to the node and install the probe agent at any time.
Installing Monitoring Probe
- Ensure the probe's NetCrunch communication port (default 12009) is accessible. You might need to map ports on your firewall.
- Install the probe on the Windows machine. It can even be a Home edition, as it doesn't violate the Microsoft CAL license. It's an agent that will connect to the server and other machines. It should work on any Windows system, but is tested to run on Windows 10 or newer (an x64-bit system is required).
- After installing the software probe, the configurator starts automatically.
- You must log in to NetCrunch using your NetCrunch account, select the probe node, or create a new one.
- The probe agent receives an authentication token, which will be used for sending data to NetCrunch.
Connection
NetCrunch monitoring probe uses a native client protocol connection to NetCrunch that uses AES256 encryption with the Diffie-Hellman key exchange algorithm. Because the probe connects to the server, it can be located behind a NAT and use a dynamic IP address.
Data Receiver
Invalid Reference @data-sensor
So the question is: how can you use it? You need to add the Data Receiver sensor and send data to it. Read more about Sending Data to NetCrunch. You can build your agent script (in any language) or use the existing one to create a parser for a data format.
NetCrunch Connections
Learn how clients and remote components connect to the NetCrunch Server — locally, through HTTPS, or via the NetCrunch Connection Cloud (NCC). Understand supported protocols, security levels, and available connection types.
Accessing NetCrunch
NetCrunch supports various connection types to enable access from consoles, browsers, remote probes, and external systems. Depending on your environment, you can use direct TCP, HTTPS, or NCC to securely connect.
Clients
NetCrunch allows connections from several types of clients:
- Desktop Console
- Web Console (Browser)
- Monitoring Probes
- API Clients & Webhooks
Administration Console (Desktop)
The NetCrunch Administration Console is the most powerful and optimized client, designed for fast, real-time interaction. It caches a large amount of data locally and synchronizes only the changes with the server, providing high responsiveness and reduced load.
It supports fine-grained access control, so it is no longer limited to administrators. Users with proper access rights can perform limited administration tasks — such as managing specific nodes or views — without requiring full administrative privileges.
Supported Systems
- Windows 8 or newer (recommended: Windows 11)
- Supports multi-monitor and touch devices
Connection Methods
- Encrypted TCP – Use server address or name (port
12009) - Secure WebSocket (HTTPS) – Connect via Web Server (
wss://your-server) - NCC (Cloud) – Use license ID (e.g.,
YZ-123-456) as the connection key
Features Exclusive to the Admin Console
- Configure monitors, sensors, and monitoring packs
- Manage alerting policies and response actions
- Edit node properties and apply monitoring roles
- View full alert and event history
- Use diagnostic tools: Logs, SNMP Tools, Perfmon Explorer
- Import/export configuration templates
- Access Object Explorer and MIB Browser
- Manage NetCrunch modules and task schedules
- Delegate limited admin permissions per view or node
- Faster performance than the Web Console due to local caching
Web Console (Browser)
The Web Console provides access through modern HTML5 browsers and is ideal for remote visibility and lightweight tasks.
Features
- View and edit Graphical Views
- Browse Atlas Tree, Events, and Reports
- Role-based access per user or group
- Excellent for executives or helpdesk roles
Supported Browsers
- Edge 86+, Safari 15.4+, Chrome 86+, Firefox 86+, Opera
- Internet Explorer is not supported
Monitoring Probe
The NetCrunch Probe is a remote monitoring engine designed to operate behind NAT/firewalls in branch offices or customer sites.
Connection Methods
- TCP (12009) – Standard encrypted connection to the server
- NCC Cloud – Simplest and most secure method
Sending Data to NetCrunch
External data can be pushed into NetCrunch through:
- Webhooks for status and event injection
- REST API for metrics and status objects
- Data Parsers for log or file-based input
Security & Protocols
NetCrunch supports multiple access paths. Each has a different level of security and use case:
Direct TCP (Encrypted on Port 12009)
- Security: High
- Encrypted connection using X25519 key exchange, AES-256-GCM encryption, and mutual PSK authentication
- Provides TLS-level security with FIPS 140-3–compatible cryptography, without requiring certificates
- Used by the Desktop Console and Probes to connect to the NetCrunch server
While port 12009 can be exposed to the Internet, we recommend placing the server behind a reverse proxy such as NGINX to provide an additional layer of protection against network-based attacks and unauthorized access attempts.
HTTP
- Security: Low
- Unencrypted, not suitable for production
HTTPS (Self-Signed)
- Security: Medium
- Encrypted, browser warnings expected
HTTPS (Valid Certificate)
- Security: High
- Full encryption + certificate validation
- Required for secure WebSocket (
wss://)
NetCrunch Connection Cloud (NCC)
- Security: High
- Requires no port forwarding or NAT traversal
- Works via outbound HTTPS (port 443)
-
Supports:
- Desktop Console
- Web Console
- Remote Probes
Use @<license-id> as the server address when connecting (e.g., @YZ-123-456).
Communication Scenarios
The following diagram summarizes the three common deployment scenarios:
- Local Deployment (LAN) – Direct TCP & HTTPS
- HTTPS-Only Deployment – For DMZ or simplified security models
- Cloud Relay (NCC) – No inbound traffic needed
 Diagram created using NetCrunch Graphical Views.
Deployment Considerations
- In HTTPS-only mode, all connections to the server are inbound and encrypted. This typically requires firewall rules or a reverse proxy (e.g., NGINX, HAProxy) in front of the NetCrunch server to properly route and secure access.
- In Cloud Relay (NCC) mode, the server initiates a single outbound HTTPS connection (port 443) to the NCC relay. No inbound connectivity is required.
This architecture is highly resilient and an ideal solution for zero-trust environments, where inbound ports are blocked, and all communication must be explicitly initiated and authenticated.
Related Topics
- What Is a Node in NetCrunch?
This topic explains the definition of a Node in NetCrunch. It clarifies why a Node is treated as a service endpoint rather than a physical device, and how this distinction improves monitoring accuracy for modern infrastructure.
- What can I monitor?
NetCrunch can monitor nearly anything: devices, applications, systems, databases, and files. The program can be extended using scripts; data from various sources can be sent to NetCrunch or polled from files, databases, or websites.
- NetCrunch Connection Cloud (NCC VPN)
A resilient, secure platform for zero-configuration access to NetCrunch from any location — ideal for modern, zero-trust environments.
- Sending Data to NetCrunch
Read how to send data to NetCrunch and create a custom monitor. You can easily turn any application or script into a NetCrunch agent.
- Azure API Management Sensor
Azure API Management sensor allows you to monitor the performance and behavior of the Azure API Management service. Azure API Management is a reliable, secure, and scalable way to publish, consume and manage APIs running on the Microsoft Azure platform.
- Azure Cosmos DB Sensor
This sensor monitors Azure Cosmos Database Service using Azure Monitor metrics.
- Azure Cost Sensor
The sensor monitors the estimated cost of resources in Azure subscription, and the progress of expenses within budgets defined in Azure subscription.
- Azure Insights Components
Azure Insights Components Sensor monitors Azure Insights Components resource, using Azure Monitor metrics. Application Insights is a feature of Azure Monitor and an extensible Application Performance Management (APM) service. You can use it to monitor your live applications. It will automatically detect performance anomalies and includes powerful analytics tools to help in diagnosing issues and understanding what users do with the app.
- Azure Logic Apps Sensor
Azure Logic Apps sensor allows you to monitor the performance and behavior of the Microsoft Cloud technology called Azure Logic Apps. Azure Logic Apps is a service in Microsoft Cloud that allows you to schedule, automate, and orchestrate tasks, business processes, and workflows when you need to integrate apps, data, systems, and services across enterprises or organizations.
- Azure Server Farm Sensor
Azure Server Farm Sensor monitors Azure Server Farm resources, using Azure Monitor metrics. The Microsoft Server Farm simplifies the provisioning, scaling, and management of multiple servers for administrators and hosting providers.
- Azure Service Bus Sensor
Azure Service Bus sensor allows monitoring the metrics of the cloud apps connected to the Service Bus namespace. Azure Service Bus is a messaging service on the cloud used to connect any applications, devices, and services running in the cloud to any other applications or services. As a result, it acts as a messaging backbone for applications available in the cloud or across any device.
- Azure Storage Account Sensor
Azure Storage Account Sensor monitors Azure Storage Accounts service, using Azure Monitor metrics. Microsoft Azure Storage Accounts service allows to create a group of data management rules and apply them all at once to the data stored in the account: blobs, files, tables, and queues.
- Azure Web Site Sensor
With the Azure Web Site sensor, you can monitor the usage and performance of the web applications that are deployed to the cloud with Azure Web Apps. Azure Web Apps is a managed cloud service that allows the deployment of a web application and makes it available to customers on the Internet in a very short amount of time.
- AWS Alarm Sensor
The Alarm Sensor monitors the status of Amazon alarms with CloudWatch API.
- AWS Auto Scaling Sensor
AWS Auto Scaling Sensor monitors the parameters of AWS Auto Scaling Group. AWS Auto Scaling automatically adjusts capacity to maintain steady, predictable performance for your applications.
- Azure SQL DB Sensor
This sensor allows you to monitor the performance and behavior of the databases managed in Azure SQL DB. Azure SQL DB is Microsoft’s cloud database service, that enables organizations to store relational data in the cloud and quickly scale the size of their databases up or down as business needs change.
- AWS Cost Sensor
The sensor monitors the estimated cost of services in the AWS cloud and the progress of expenses within AWS Budgets.
- AWS EBS Sensor
The sensor allows monitoring of key metrics of AWS Elastic Block Store.
- AWS EC2 Sensor
AWS EC2 Sensor allows monitoring usage of Amazon Cloud service Elastic Compute Cloud (EC2) Instance resources.
- AWS ElastiCache Sensor
AWS ELB Sensor allows monitoring of the performance of the AWS ElastiCache service.
- AWS ELB Sensor
AWS ELB Sensor allows monitoring metrics of AWS Elastic Load Balancers.
- AWS SQS Sensor
AWS SQS Sensor allows monitoring of key metrics of AWS Simple Queue Service (SQS). SQS is a fully managed message queuing service that enables you to decouple and scale microservices, distributed systems, and serverless applications.
- Cloud Drives
This sensor allows monitoring of Microsoft OneDrive storage usage.
- Microsoft 365 Service Status
This sensor allows you to monitor the health of Microsoft 365 services.
- External Event Sources
See how to create an alert for Syslog messages, SNMP traps, Web Messages, and Windows Event Log entries.
- Receiver - External Events Window
The window allows to see all incoming traps and syslog messages and define alerts with a single click.
- IP Tools - Remote Network Diagnostic
Overview of NetCrunch IP Tools as remote-capable diagnostic utilities available in both Desktop and Web Console, with flexible execution backends including server, probes, and NCC.
NetCrunch Connection Cloud (NCC VPN)
A resilient, secure platform for zero-configuration access to NetCrunch from any location — ideal for modern, zero-trust environments.
Overview
NetCrunch Connection Cloud (NCC) provides a reliable, secure, and cost-effective way to access the NetCrunch Server from any location without requiring firewall changes or VPN configuration. Much like point-to-point VPNs, NCC establishes an encrypted HTTPS tunnel from the server to the cloud — enabling remote access without exposing any inbound ports.
Unlike traditional VPNs, NCC does not expose the internal network. Instead, it functions as a relay, brokering HTTPS connections from clients (e.g., Console, Browser, Probe) to the server.
The only requirement is that the server must be able to make an outbound connection on port 443.
Key Features
Zero Configuration Access
- No need to expose ports or reconfigure firewalls.
- The NetCrunch server connects outbound to the NCC service.
- Users connect using a simple ID (your license number).
Optimized for Zero Trust Environments
- No inbound connectivity required to your internal infrastructure.
- Minimizes attack surface and simplifies perimeter security.
- Works with any network that allows outbound HTTPS traffic.
High Availability & Regional Redundancy
- NCC runs in multiple regions for low-latency, fault-tolerant access.
- Connections are relayed via the geographically closest NCC node.
Secure Data Transmission
- No data is stored in the cloud — NCC functions purely as a tunnel.
- HTTPS is used end-to-end between client and server.
- NCC never sees decrypted monitoring data or credentials.
Enterprise Customization
- Enterprise customers can request a private NCC node, ensuring that connections bypass public relays entirely.
- Enables complete isolation and compliance with sensitive data requirements.
Full Client Compatibility
NCC supports secure connection from:
- Desktop Console — Choose “Connection Cloud” and enter your license ID
- Monitoring Probes — Use
@<license-id>instead of an IP address - Web Console — Open
https://ncconsole.net/rc/connect/<license-id>in your browser
The <license-id> is your NetCrunch license number, visible in the About box of the Console.
GDPR Compliance
NCC is designed from the ground up to comply with strict privacy laws like the GDPR.
Data Privacy by Design
- NCC stores no personal data or monitoring content.
- It acts solely as a connection broker, forwarding encrypted HTTPS traffic.
- No metadata is retained about sessions beyond what is required to establish routing.
Regional Data Flow
- Connections are routed through the closest NCC region.
- Regional relaying helps reduce cross-border data movement.
- For enterprise customers, private relays can be deployed in specific countries or data centers.
Enterprise-Level Security
- Exclusive nodes ensure single-tenant isolation.
- Supports secure TLS transport with certificate validation.
- Future roadmap includes support for MFA and SSO.
By meeting these criteria, NCC helps organizations stay compliant while maintaining top-tier network security.
Why Choose NCC?
- Perfect for remote workers, branch offices, and MPLS-free environments
- No NAT, port forwarding, or VPN configuration
- Maintains outbound-only security posture
- Enables a true zero trust deployment model
- Backed by high-availability relay infrastructure
Connecting
To connect using NCC:
- Desktop Console → choose Cloud Connection and enter your license ID (e.g.,
@YZ-123-456) - Monitoring Probe → enter
@<license-id>in the server field - Web Console → visit
https://ncconsole.net/rc/connect/<license-id>
The license-id is your NetCrunch license number.
 Excerpt from the NetCrunch Connections diagram — highlighting the Cloud Relay (NCC) communication model.
Diagram created using NetCrunch Graphical Views.
Related Topics
- Architecture and Concepts
Overview of NetCrunch Server architecture. Learn more about Monitoring Engines, NetCrunch Consoles, databases, additional tools, and critical concepts of advanced network visualization.
- What Is a Node in NetCrunch?
This topic explains the definition of a Node in NetCrunch. It clarifies why a Node is treated as a service endpoint rather than a physical device, and how this distinction improves monitoring accuracy for modern infrastructure.
- What can I monitor?
NetCrunch can monitor nearly anything: devices, applications, systems, databases, and files. The program can be extended using scripts; data from various sources can be sent to NetCrunch or polled from files, databases, or websites.
- NetCrunch Connections
Learn how clients and remote components connect to the NetCrunch Server — locally, through HTTPS, or via the NetCrunch Connection Cloud (NCC). Understand supported protocols, security levels, and available connection types.
- Essential Sensors
DNS Query, System Uptime, RADIUS, SSL Certificate & SSH Remote Ping.
- Monitoring SNI SSL Certificates
This topic explains how to monitor multiple SSL certificates on a single IP address (SNI) by treating each domain as a separate Node in NetCrunch, and how to accurately aggregate their status using a Composite Status Node.
- Windows Monitoring Setup
Reading this topic will make your Windows monitoring experience much better.
- Monitoring Web Pages & Data
NetCrunch can monitor requests, pages, and data on the web.
- Device Config Sensor
The sensor enables tracking changes to device configurations and stores multiple backups of device configurations using the
telnetorsshprotocol. - Azure API Management Sensor
Azure API Management sensor allows you to monitor the performance and behavior of the Azure API Management service. Azure API Management is a reliable, secure, and scalable way to publish, consume and manage APIs running on the Microsoft Azure platform.
- Azure Cosmos DB Sensor
This sensor monitors Azure Cosmos Database Service using Azure Monitor metrics.
- Azure Cost Sensor
The sensor monitors the estimated cost of resources in Azure subscription, and the progress of expenses within budgets defined in Azure subscription.
- Azure Insights Components
Azure Insights Components Sensor monitors Azure Insights Components resource, using Azure Monitor metrics. Application Insights is a feature of Azure Monitor and an extensible Application Performance Management (APM) service. You can use it to monitor your live applications. It will automatically detect performance anomalies and includes powerful analytics tools to help in diagnosing issues and understanding what users do with the app.
- Azure Logic Apps Sensor
Azure Logic Apps sensor allows you to monitor the performance and behavior of the Microsoft Cloud technology called Azure Logic Apps. Azure Logic Apps is a service in Microsoft Cloud that allows you to schedule, automate, and orchestrate tasks, business processes, and workflows when you need to integrate apps, data, systems, and services across enterprises or organizations.
- Azure Server Farm Sensor
Azure Server Farm Sensor monitors Azure Server Farm resources, using Azure Monitor metrics. The Microsoft Server Farm simplifies the provisioning, scaling, and management of multiple servers for administrators and hosting providers.
- Azure Service Bus Sensor
Azure Service Bus sensor allows monitoring the metrics of the cloud apps connected to the Service Bus namespace. Azure Service Bus is a messaging service on the cloud used to connect any applications, devices, and services running in the cloud to any other applications or services. As a result, it acts as a messaging backbone for applications available in the cloud or across any device.
- Azure Storage Account Sensor
Azure Storage Account Sensor monitors Azure Storage Accounts service, using Azure Monitor metrics. Microsoft Azure Storage Accounts service allows to create a group of data management rules and apply them all at once to the data stored in the account: blobs, files, tables, and queues.
- Azure Web Site Sensor
With the Azure Web Site sensor, you can monitor the usage and performance of the web applications that are deployed to the cloud with Azure Web Apps. Azure Web Apps is a managed cloud service that allows the deployment of a web application and makes it available to customers on the Internet in a very short amount of time.
- AWS Alarm Sensor
The Alarm Sensor monitors the status of Amazon alarms with CloudWatch API.
- AWS Auto Scaling Sensor
AWS Auto Scaling Sensor monitors the parameters of AWS Auto Scaling Group. AWS Auto Scaling automatically adjusts capacity to maintain steady, predictable performance for your applications.
- Azure SQL DB Sensor
This sensor allows you to monitor the performance and behavior of the databases managed in Azure SQL DB. Azure SQL DB is Microsoft’s cloud database service, that enables organizations to store relational data in the cloud and quickly scale the size of their databases up or down as business needs change.
- AWS Cost Sensor
The sensor monitors the estimated cost of services in the AWS cloud and the progress of expenses within AWS Budgets.
- AWS EBS Sensor
The sensor allows monitoring of key metrics of AWS Elastic Block Store.
- AWS EC2 Sensor
AWS EC2 Sensor allows monitoring usage of Amazon Cloud service Elastic Compute Cloud (EC2) Instance resources.
- AWS ElastiCache Sensor
AWS ELB Sensor allows monitoring of the performance of the AWS ElastiCache service.
- AWS ELB Sensor
AWS ELB Sensor allows monitoring metrics of AWS Elastic Load Balancers.
- AWS SQS Sensor
AWS SQS Sensor allows monitoring of key metrics of AWS Simple Queue Service (SQS). SQS is a fully managed message queuing service that enables you to decouple and scale microservices, distributed systems, and serverless applications.
- Cloud Drives
This sensor allows monitoring of Microsoft OneDrive storage usage.
- Microsoft 365 Service Status
This sensor allows you to monitor the health of Microsoft 365 services.
- Google Analytics Sensors
Google Analytics sensors allow monitoring of various metrics provided by the Analytics Reporting API.
- - Administration Console
NetCrunch Licensing
NetCrunch licensing is node-based and allows monitoring of switch port interfaces, with a maximum of nodes.
Node License NetCrunch licensing is based on the number of nodes, but we also count monitored interfaces. If the number of monitored interfaces exceeds the number of nodes, additional interface licenses are required for the excess interfaces.
For instance, with a license for 500 nodes, you can monitor 500 nodes and 500 interfaces. If you want to monitor 500 nodes and 700 interfaces, you'll need 500 node licenses and an additional 200 interface licenses for the excess.
If you do not monitor switches, you only look for the total number of monitored nodes (devices). In other cases, if you want to monitor layer 2 connections on your switches, you need a license covering the total number of switch ports you wish to monitor, which exceeds the total number of switches.
Additive
NetCrunch licenses are additive. This means, for example, that if you purchase a 100-node/interface license and later decide to get a 50-node/interface license, you will have a total of 150 nodes/interfaces. You can purchase an additional node pack at any time and add it to your NetCrunch - no need to reinstall or restart the software; you just need to refresh the license.
Interface Monitoring
By default, interface monitoring is enabled only on SNMP devices. However, interface monitoring can be enabled on all monitored nodes if desired. Interface monitoring can be adjusted on a per-node basis within NetCrunch preferences.
By default, only All Active type interfaces are monitored. 'Other' or 'Loopback' type interfaces do not count toward license size unless you manually adjust the monitoring schema.
It's possible to create an interface-monitoring schema that includes only interfaces that match the filter you need.
To change the default schema or create additional schemas, go to (hamburger menu)Settings Monitoring Interface Monitoring Settings
Configuration
Everything you should know about configuring NetCrunch, including Initial configuration, alerts, and reports.
Before You Begin
The configuration of NetCrunch can be easy or hard, depending on how you start. There are many configuration possibilities, and if you know which one to choose in a given situation - everything becomes simple.
- Read Architecture and Concepts to quickly review the options.
- Important task you need to perform first: Windows Monitoring Setup.
Discovering your Network
This article will help you get through network discovery and the initial configuration process.
To monitor your network, NetCrunch must know device addresses, their names, and how to connect to them (credentials, types, etc.). The Network Atlas is a database that holds all that information, so the first step will be adding nodes to it.
Manually
You can add nodes from a file, then complete the rest of the setup manually. It's even possible to create an empty Atlas and add every node manually, but it's unlikely you would need that feature.
Nodes can be added from a text file containing either node names or addresses, one per line.
What to do after importing nodes? So manual configuration topic.
By Network Discovery Wizard
tabDiscoveryMethod
Discovery Methods
Search Active Directory Domain
The program searches Active Directory and adds all devices, including macOS machines.
The program scans only the Domain, where the NetCrunch Server machine object is located.
All machines from Active Directory will be added, even if they are currently not connected to the network.
Discover IP Networks
The program will scan a given range of network addresses using ICMP (ping) packets. Only connected and responding nodes can be discovered in this way, so results may vary depending on when you perform the discovery.
tabNetworkSelection
Networks to Be Discovered
NetCrunch fills the list with known networks; you can add more networks as desired.
The program uses ICMP PING packets to discover nodes in a given network, and only nodes responding to ICMP PING packets are added.
Discover and scan the neighborhood networks option
During the discovery process, NetCrunch finds connections to neighborhood networks. Enable this option to have NetCrunch automatically follow these links. You can limit the scanning depth by specifying the maximum number of hops to remote networks.
Discovery Mode
All Devices
The program will try to find and add as many devices as it can. It will look into SNMP and use a PING sweep.
Infrastructure Devices Only
The program will skip workstations.
Only devices matching the SNMP filter
Build a filter query that will include the desired devices. The program will attempt to communicate with the specified SNMP profiles and determine which profile is required for the device.
tabSNMPMode, tabSNMPSettings
Configure SNMP Profiles
This is the point where you should enter all the SNMP profiles used by your SNMP devices.
If you fail to do this now, you can enter them later, but you will have to assign them to each device individually.
If you enter the SNMP profiles now, the program will automatically determine which profile each device uses, and devices will be marked as SNMP-manageable. Additionally, device types should be discovered (via the sysObjectId SNMP variable or the device SNMP name), and automatic monitoring should be enabled.
SNMP Agents Port
SNMP Discovery assumes that you use only one SNMP port for all devices in your network. By default, SNMP agents respond on a port 161. If you use different ports for different devices, you have to set them up manually.
Add a link to the topic about managing SNMP profiles
tabNetworkServices
Select Network Services To Be Discovered
NetCrunch recognizes and can monitor about 70 network services. Discovering all of them might be time-consuming and might generate unnecessary network traffic. As a result, we decided to include 14 common services by default, and you can add more services as desired.
Here you can also set the initial parameters for each monitored network service.
- Repeat Count
- The number of requests to be sent in one monitoring check to determine the average response time properly
- Additional Repeat Count
- The number of additional requests to be sent in case base requests fail.
- Timeout
- Time after which NetCrunch gives up on waiting for a response
You can reduce timeouts by monitoring network devices on a low-latency network. Default values should work great, even for internet connections.
Next Step...
After NetCrunch discovers all your devices, it starts discovering network services on each device in the background.
This is a time for further configuration: automatic Monitoring Packs, setting credentials, setting NetCrunch users and administrator profiles, and default alerting scripts.
Go to: Configuration Wizard
Configuration Wizard
Configure automatic Monitoring Packs, set credentials for different systems, set up NetCrunch users, and profile for the Administrator. Customize the default alerting script.
tabMonitoringAreas
Automatic Monitoring Packs
Each Monitoring Pack includes the definitions of alerts and the data that NetCrunch needs to collect. NetCrunch includes predefined Monitoring Packs that are bound to nodes using filtering rules.
tabCredentials
Monitoring Credentials
To monitor anything, NetCrunch must connect to various systems using the proper credentials. You can set all default credentials (to be used if you do not set a specific one for the node) for supported operating systems (Windows, Linux, BSD, macOS, Solaris, ESX/i).
If NetCrunch runs in the Domain, it connects using NetCrunch Server account credentials by default.
See: Windows Monitoring Setup
tabAlertingScript
Notification Scheme
All predefined alerts use the Default Alerting Script. You can edit it later in detail, but you can make some preliminary settings here.
Go to: Configuration Tips
Network Atlas Views
Read about types of views and how they organize your data.
Network Atlas is a central database containing all your network data. It's organized by the hierarchy of the Atlas Node Views.
The Network Atlas is a part of the Automatic Monitoring and Organizing concept. It is a central repository of all views, grouping network nodes by categories such as nodes from the same network, a single layer 2 segment, or nodes within the same area.
The fundamental element of the Atlas is a network node: a single-address network endpoint. Because many devices use multiple interfaces, they can be grouped, allowing you to monitor only the primary interface.
Read more in Devices with Multiple Network Interfaces
Atlas Views
Atlas Node View shows various aspects of the group of nodes in the Network Atlas and consists of multiple pages such as nodes, maps, dashboards, and others.
The Atlas Views hierarchy helps you recognize each node group's status. A top-level (root) view of the Atlas contains all nodes, sub-views, and dashboards showing aggregated information for all nodes.
Common Views Properties
- Alerting & Data Collection - You can define alerts that will be inherited by all nodes in the view.
- Top Charts - Specify a list of top charts for the view.
Atlas Sections
Below the Top Level Views are four main sections of the Atlas Views.
IP Networks
This section consists of IP network views/maps. Each network can be periodically re-scanned to reflect its current state. Network maps are usually automatically arranged, and the device model and OS name can be used to group nodes.
Each IP node is a part of some network view. Deleting a node from any IP Network View will also delete it from Atlas. Deleting the View will delete all nodes it contains.
Sites
Networks are grouped into sites. By default, local networks are those accessible directly by the NetCrunch Server's network interfaces.
(0.0.0.0/8) - Empty Network
Sometimes a node is specified by its name, and its address has not yet been resolved. In this case, it belongs to the empty network view.
Specific Properties
-
Automatic node rediscovery - You can set (enabled by default) each network to be automatically scanned to find active nodes. The minimum rediscovery time is 1 hour. You can also specify the exclusions list.
-
Discover New Nodes - You can manually start the discovery of network nodes.
Network Topology
Routing Map
An automatically created view shows a map of logical connections between IP networks. The view is automatically updated when NetCrunch detects topology changes or on demand. You can edit the map and adjust node positions. A routing map is automatically created for each address space.
A routing map can be automatically laid out as a graph or a hybrid map.
Sample Routing Map

Physical Connections
This section contains a hierarchy of views showing Layer 2 connection segments. Each view is automatically arranged and shows the traffic summary for each switch port.
To start monitoring Physical Connections, you need to point the switches to be used to a network topology map. Switches must be defined in the Atlas and have their SNMP profiles correctly set.
After you click on (hamburger menu)Settings Monitoring Physical Connections Monitoring, the Physical Segments Configuration Wizard will start. It will try to find switches that meet the requirements above. If you can't find the switch but know it supports RFC 1493 MIB, please check if it's in the Atlas and its device type is set to Switch.
To create topology maps, NetCrunch primarily uses protocols such as STP, Cisco CDP, and LLDP, and as a fallback, SNMP Forwarding Tables (RFC 1493). Make sure you have enabled CDP or LLDP to ensure the best results.
NetCrunch can create a layout depending on the topology, such as a tree, star, or graph.
Example Tree Topology

Custom Views
This section allows you to organize your network data. Here, you can add your own Node Group Views and manage them using folders. You can create graphical maps for the view and link them. You can also create automatic folders to manage automatically created views.
Automatic Views & Folders
The primary goal of NetCrunch is to monitor the network's state as it changes over time. It’s better to set up and configure views based on rules to maintain dynamic network relations.
Predefined
Based on typical customer Atlases, we prepared some Automatic Views (aka dynamic views) for you:
- Nodes with Monitoring Issues
- Unresponding Nodes
- Responding Nodes with Active Alerts
- Monitoring Probes
- Receiver Nodes
- Composite Status Nodes
- Unknown Device Type
- Server Types (Linux, Windows Server, etc.)
- Device Groups (Printer, Switch, Hardware Router, etc.)
- Workstation Types (Windows 8, Windows 10, Windows 11)
- Locations (Office, Building 1, Server Room - based on SNMP or manually entered data)
- Network Roles (Networking, Servers, Workstations, Printers, Other)
- Windows Domains
- Virtual Machine Hosts
- Organizations
- VLANs
- Operating System Monitoring
- Nodes Using Templates
All Automatic Views are dynamic and automatically update as needed. By default, all empty views are hidden. These views can be modified, and you can treat them as examples of how easy it is to create dynamic views in NetCrunch.

Automatic Folders
You can create a set of automatically updated views as data changes. For example, you want a separate view of each city where devices are located.
You need to specify the node field by which you want to group nodes in views, and you may also decide to make only separate views consisting of more than five elements. Otherwise, nodes will be placed on a single view.
As these views are automatically created and deleted, you can't manage alerts and reports using them.
Specific Properties
- Node Filtering - Specify the filtering condition
- Folder Content - Specify the grouping field and manage groups and their icons
- Appearance - Set an icon for the folder
Dynamic Views
The views are managed through specified filtering conditions (query).
Example:
The domain equals ad.adrem
Specific Properties
- Node Filtering - Specify filtering conditions
Graphical Views
graphical-views
Graphical Views enable the creation of live visual dashboards, maps, and diagrams to represent network and system status. They combine diagrams and widgets with interactive, responsive rendering that adapts to user roles and device type.
Graphical Views are flexible, real-time visualizations used in dashboards, maps, and diagrams. They support both panel-style dashboards and boundless map canvases, offering a unified visual experience.
Key Concepts
-
Panel Views – designed with a fixed aspect ratio and responsive layout. Panels automatically scale to fit the display area, making them ideal for dashboards optimized for desktops, tablets, phones, or large displays. Two scaling modes are available:
- Fit all widgets – scale the panel so only visible elements fill the screen.
- Fit entire panel – scale the full layout area regardless of content.
-
Boundless Maps – scrollable and zoomable freeform canvases ideal for visualizing layouts without screen constraints. Background images (e.g., floorplans or logical schematics) can be freely positioned. These maps are designed for manual panning and zooming, useful when content intentionally exceeds the screen size.
-
Dynamic Content – elements like shapes, lines, icons, and text can be linked to live NetCrunch objects such as nodes, services, or metrics. Their appearance dynamically changes based on object state (e.g., color, visibility, shape).
-
Theming – views automatically adapt to the user's light or dark theme preference. NetCrunch uses a single view definition across themes, unlike other platforms that require duplicating views per style.
Types of Graphical Views
Each view type supports specific layout and interaction patterns:
Free-form Diagrams
Used to build logical or status-oriented network diagrams. Objects can be positioned manually and connected using live status lines.
Image: Simple network diagram

Boundless Maps
Used for large, navigable visualizations with no fixed layout size. Suitable for: - Floorplans - Wiring diagrams - Device placement maps
Image: Operating boundless diagram

Users can add a background image and freely arrange visual elements without zoom constraints.
Dashboard Panels
Responsive visual containers designed with a fixed aspect ratio. They scale to fit display dimensions while preserving layout. Ideal for: - Mobile dashboards - Status displays - Kiosk and wall-mounted views
Image: Simple dashboard example

Two smart scaling modes optimize visibility either by content or by full panel size.
Image-based Panels
Use a background image (e.g., rack, datacenter, topology drawing) placed inside a fixed-aspect panel. The image can be scaled and positioned relative to the panel, with live elements overlaid.
Image: Sample floor plan with camera widget

Geographical Maps
Predefined region-based maps with geo-location support. Over 100 maps are available (e.g., countries, states, regions). Unlike embedded browser maps (e.g., Google Maps), these are vector-based contour maps. - Users can place elements based on coordinates. - Locations can be resolved via Google’s geolocation service. - Suitable for regional monitoring dashboards or location-aware topologies.
Image: Camera locations across the world

Theming Support
- Users can switch between light and dark modes.
- A single view supports both themes automatically.
- View elements and background adapt accordingly—no duplication needed.
Alert and Report Management
Read about scheduling reports, the difference between an event and an alert, Monitoring Packs, and message formats.
Monitoring Packs, Alerting Scripts, the Escalation Process, and Inheritance (overriding alert definitions for specific nodes)
Monitoring Packs and Node Settings
Although alerting and reporting serve different purposes, their settings are very similar.
- To create an alert, you need to specify the event condition to trigger the alert.
- To create the desired report, data needs to be collected first.
NetCrunch manages alerts and data collectors in the same place through Monitoring Packs and Node Settings.
Report Scheduling
To collect data for reports, add a data collector to specific Monitoring Packs or nodes. To create a report, select one of the predefined Report Scheduling Schemes (or define a new one) and specify the user or group that should receive the report.
Read more about Customizing NetCrunch Reports
Events and Alerts – what's the difference?
Event is a thing that happens or takes place, especially one of importance.
As we assign an event condition to be watched or received by the program, it becomes an alert containing a log of the operations performed and the response to the event.
Alert - the condition being watched for action to react to potential danger or get attention.
In other words, the program is the alert guard watching for specified event conditions. When we decide to create a new alert, the default action is to write it to the NetCrunch Event Log. You can assign a common Action List to an alert or create custom sequences of each alert's actions.
Defining Events
Each Monitoring Engine defines its own set of events to watch. There are many predefined event conditions, primarily to track well-known object states such as Windows Services, Network Services, and Nodes.
There are many more events than defined in the software. For instance, when you monitor external Syslog events, you need to describe which ones you want to be NetCrunch events. If you decide to turn all Syslog messages into a single event definition, you can't differentiate actions, messages, or severities.
The most important types of events you can define are Event Triggers for Counters, which you can set on any performance counter value and allow you to set logic for observed counter values.
Common Event Definitions
When you create a new event condition to set an alert, you can save it for later use and add it later to another node or policy. Both nodes (or Monitoring Packs) will share the same event condition. You can modify it for a single node or for all nodes sharing the same condition when you want to change it.
By default, NetCrunch saves all new rules as common definitions.
If you want to change this setting, uncheck Save as common definition before saving a new event.
If you want to manage common definitions or remove unused ones, go to NetCrunchAlerting & NotificationsMonitoring Packs and PoliciesCommon Alerts
Setting Alerts & Reports
Setting alerts using Monitoring Packs: SettingsAlerting & NotificationsMonitoring Packs and Policies.
You can override or add alerts and Monitoring Packs to a node or multiple nodes by clicking on a node (or selecting multiple nodes) Node SettingsMonitoring
See Managing Multiple Node Settings
Report Types
There are two main types of reports: aggregated for a group of nodes and single-node reports. Both of them need data.
Data collection management is very similar to alert management. It needs to be specified for a specific node. You can do it through Monitoring Packs, Atlas Views, or set it directly in the Node Settings window.
Monitoring Packs
Monitoring Pack is a group of performance parameters and events monitored and collected for the reports.
Automatic Monitoring Packs
Automatic monitoring packs specify a node filtering condition, allowing you to automatically apply the Monitoring Pack to nodes.
Most predefined Automatic Monitoring Packs bind through a specified operating system type and some additional conditions.
Example:
- NetCrunch adds
Active Directorymonitoring pack settings to the node if - Operating System is equal to Windows Server and,
- Network Service List contains any of the following LDAP, LDAPS.
Each Automatic Monitoring Pack includes an Exclusion List that specifies nodes to exclude from the given condition.
Static Monitoring Packs
You can add a Static Monitoring Pack manually to a node using Node SettingsMonitoring, or you can open the properties of the Monitoring Pack and click on the Assigned to page.
See the list of predefined Monitoring Packs
Global Monitoring Packs
Settings Alerting & Notifications Monitoring Packs and Policies
In the NetCrunch Monitoring Packs & Policies window, you can find the Global group.
It contains a list of special predefined Monitoring Packs. Some apply to all nodes; some are Monitoring Packs that refer to globally collected data, such as NetFlow traffic summary. When you modify the Node Status pack, be aware that each alert will automatically be monitored across all nodes.
- Node Status - sets monitoring alerts of node status for all nodes.
- Service Status - alert on connection reliability degradation, PING RTT > 1000 ms, Any Service is DOWN, Any Service is UP.
- Global Flows - You can set triggers on summary counters from the NetFlow server. See: Network Traffic Monitoring.
- NetCrunch - sets alerts for adding or removing nodes from the Atlas, NetCrunch Server auto restart, and automatic backup of the Atlas. You can also set a NetCrunch Status Event: a heartbeat event generated periodically containing NetCrunch status.
- NetCrunch Self Monitor - This monitoring pack for NetCrunch Server monitoring contains alerts about various NetCrunch Server components. It contains alerts about NetCrunch maintenance, backup, and more.
- NetCrunch Audit - tracks all NetCrunch users' logins and logouts, including failed logins to the program's desktop and web consoles.
- Network Traffic (SNMP) - defines data collection for traffic monitoring: Summary of Network Traffic, Network Traffic by Interface, Interfaces Utilization. It's automatically applied to devices with SNMP and interface monitoring enabled. See: Network Traffic Monitoring.
- Correlations - here, you can add alerts triggered when two or more alerts on different nodes happen simultaneously. For example, alert when two connection links are down. You can add correlations using the Active Alert state or by defining a time window during which all events must be triggered.
- Physical Segments - This automatic monitoring pack applies to all nodes connected to a switch. It contains alert rules for changes to the node's physical linkage.
Overriding Monitoring Pack settings
When you add Monitoring Packs to the node (or if they're added automatically), the node settings are a sum of the settings from multiple packs applied to the node.
You may override the settings for a specific node. Select a node (or multiple nodes) and open Node SettingsMonitoring and click on the desired Monitoring Pack, then you will be able to disable or override alert actions defined by the given Monitoring Pack. The automatic Monitoring Pack can be disabled on a particular node.
Alerting Actions
Actions are executed as a reaction to an alert. Actions are always grouped in the Action List sequence.
See Alerting Actions
Action List (aka Escalation Scripts)
The action list is the sequence of actions executed in response to the alert. It's grouped by execution delay time.
Escalation
Some actions may be executed immediately, and others may wait several minutes to start. The last action in the list can be repeated until the alert is closed ( the issue is resolved). You can also define a list of actions executed when an alert is closed. Each action can have restrictions that allow it to be executed only under certain conditions, such as alerts within a specific time range. A node can only be a member of a given Atlas View or alert if it has a certain severity.
Managing Message Formats
Settings Alerting & Notifications Message Formats
Event descriptions are very different. There are several fields common to each NetCrunch event, but most of the data comes from various external sources, such as Syslog, SNMP traps, Windows Event Log, and different Monitoring Engines.
Defining a single message format for each event and notification target is hard. It's rather apparent that sometimes you might expect to receive an HTML email full of content, and other times, a short SMS with only the most essential info to identify the problem.
Another application of Message Formats is passing parameters to various external actions, such as executing a program or writing event data to a file.
Internally, NetCrunch uses XML to represent events. Although it's a text format, you can hardly call it a "human-readable" format.
You can see the default message format assignments for all actions in this window.
Message Format Types
There are eight predefined message formats used by different actions:
- txt - text format
- short-txt - short text format
- sms-txt - short text for SMS messages
- syslog - text message for sending to syslog server
- export-txt - text format
- email - HTML email format
- email-txt - text email format
- ticket - text email format
Modifying Message Format Assignment
Each action type has a default message format assigned to it. You can change the assignment by clicking on a format name in the Message Formatcolumn.
Customizing Message for Specific Event
Switch to page Message Definitions. Here you can see message definitions grouped by Message Format. You can define a custom message format for a specific event or event class.
Example:
We want to create a custom SMS text message for the Node State Event to include the Location field's value.
- Click sms-txt.
- Click on Add in the bottom left corner.
- Select Node State Event from the event 'Class' drop-down menu. In the 'Event' field, select
. - Edit the displayed message content. Click
Add Parameterto add the Location parameter. You can remove the fields you do not want to include in these alerts. - Save the modified message by clicking OK.
Customizing NetCrunch Reports
Read about what custom reports you can create and how they can be done.
Options
Settings Resources Reports
- Limit the size of emails with reports
- Enable the option to avoid sending large emails, as some reports can span multiple pages and exceed your mailbox limit.
- Add footer signature
- It will be placed at the bottom of each report page. It can be: atlas name, netcrunch server, or custom text.
- Add logo image
- An image of size 100x40 pixels will be placed in the footer of every page. If you select a larger image, it will be automatically resized.
Creating Custom Reports
Settings Alerting & Notifications Policies Monitoring Packs and Policies
You can add new reports to the Monitoring Pack or to the node directly. For instance, you may want to add a PING availability report for the specific node.
- Open Node Settings
- Click
PING - + Add Collector
- Double-click the
in the Network Service Reports section. - Click OK (add a description for the newly created report).
This will add predefined [PING] Availability Report
NetCrunch includes several predefined template reports and the ability to create custom reports. Template reports are predefined reports that only need to be parameterized.
Revise this after making some changes in the program. Currently, groups are totally useless
Template Reports
Network Service Reports
Service Availability
The report contains:
- Total uptime and downtime summary,
- Chart of service response time in a given time range,
- Chart of service failure rate in a given time range
Network Service Map Reports
The report summarizes and compares a given number (10 by default) of top nodes.
Service Availability
The report contains a comparison of:
- Check Time - Nodes with the lowest and highest average check time
- Failure Rate - Nodes with the lowest and highest average failure rate
Service Response Processing Time
The report compares nodes with the lowest and highest average response processing time.
Response Processing Time is the estimate of the service's time spent generating the response. It's calculated by subtracting an average PING RTT from the service response time.
Service Uptime
- Service Availability (by total service uptime)
- Service Unavailability (by total service downtime)
- Longest service uptime and longest service downtime
Performance Reports
Chart Report for Performance Counter
Single Node
This report allows you to present multiple counters' trends in a single document. It shows a single-line trend chart for a given time range. You can choose to have 4 charts per page or just one.
Multiple Nodes
This report is similar to a single node, but trends from multiple nodes (and the same counter) can be grouped on a single chart. You can customize the number of trends put on a single chart.
Node Performers Counters View
This report includes the list of monitored counters with their current values.
Custom Report
You can add a custom report for any counter you want to monitor for a given node or group of nodes.
Scheduling Reports
You can have each report you add to a Monitoring Pack or Node Setting be automatically created and scheduled.
Scheduling Scheme
Settings Resources Report Scheduling Scheme
Each report can be scheduled using a predefined schema with criteria for each report type (daily, weekly, monthly). You need to specify the recipients.
Event Triggers for Counters
NetCrunch allows for the setting up of various threshold conditions on performance data regardless of origin. This works for all performance data channels, from SNMP data to data received through the REST API.
Performance Trigger generates an event upon the condition set on the performance counter value.
Thresholds
Thresholds trigger an event when a value is crossing a given border. Depending on the direction's change, it can be a rising or falling threshold condition.
A simple threshold specifies only the threshold value and the direction.
Rising threshold example:
% Processor Utilization > 50%
Falling threshold example:
% Free Disk Space < 10%
Hysteresis
Hysteresis can be used to avoid generating too many threshold events on fast-changing values. This is done by setting an additional resetting value.
Example:
- Trigger on
- % Processor Utilization > 50%
- Reset if
- value <= 45%
Thresholds can be configured based on the last value or the average value calculated over a specified time range.
Flat Value Trigger
This trigger generates an event when the counter has (or has not) the same value in the given period.
Example:
% Processor Time = 25 for the last 5 samples
State Trigger
This trigger generates an event when the monitored value changes from one value to another. You need to specify at least one value.
Example:
Network Card Error State changes from <any> to 5
The event can be reset when the value changes to the previous state or any other value.
Value Missing/Exists Trigger
This trigger generates an event if value exists or is missing (can't be read or received) in a given time range.
Example:
There might be no value until an error occurs, so the program can react to a value exists condition instead.
Delta Trigger
This trigger alerts you when the current counter value keeps growing or decreasing by a given value. You can also define the opposite condition when the counter is not growing or decreasing as expected. Delta is the difference between the last and the previous value.
Example:
Device Internal Timer Delta < 1
Deviation Threshold Trigger
This trigger allows you to specify how a counter value can differ from the calculated average over a given period. The deviation can be set as a percentage or by absolute value.
Example:
- Trigger on
- % Round Trip Time Deviation > 10%
- Reset if
- Deviation < 8%
- Calculate an average for the last
- 3 samples
Range Trigger
This trigger simplifies configuration. Instead of two separate thresholds for a low and high boundary, you can specify a range. The event triggers if a counter value is in the range or outside the range. Additionally, you can specify the reset tolerance value.
Example:
- Trigger on
- Server Room Temperature is outside the range [ 20 ... 22 ]
- Reset if
- Falls in the range with a margin of 2
Baseline Threshold Trigger
This trigger allows setting thresholds for deviation from observed baseline data. The program collects baseline data over a week and stores them for reference. The baseline is calculated for each hour and each day of the week.
The user can specify the allowed deviation from the baseline value (by a number or a percentage).
Example:
- Trigger on
- Server Room Temperature deviation from baseline > 1
Averages can be calculated only if more than 20% of data exists in the time range.
Limit Trigger
This trigger allows you to set an alert on a limit on the aggregated value of a given parameter.
For example, it might be the number of bytes transmitted per day or week.
It works to counter-represent value per second or accumulate values (increasing).
Available periods:
- current hour
- current day
- week, starting on Monday - Sunday
- month, starting on a specified month-day
Alert has no auto-close condition. For each period, a new alert will be generated. For this type of trigger, you can define Alert Correlation (by default, the alert will be closed after 2 days
Managing NetCrunch Users and Notifications
NetCrunch supports a flexible, role-based user system with access control for views, nodes, and features. You can integrate accounts with Active Directory, define granular access rights, and control notifications per user or group. This topic explains how to manage user accounts, access profiles, and notifications effectively.
User Access in NetCrunch
NetCrunch allows fine-grained control over what users can see and do. This applies to both the Desktop Console and Web Console, with different capabilities:
- Desktop Console: Fully supports user permissions and now allows delegated administration—users can be given limited admin rights scoped to nodes, views, or specific features.
- Web Console: Primarily designed for viewing and interacting with monitored data. It supports access profiles for restricting features, but does not yet offer full administrative functionality. We’re actively working on expanding these capabilities.
Both consoles require users to authenticate. Access rights, personalization settings, and notification profiles are stored per user on the server.
Types of User Profiles
Built-in Admin Profile
NetCrunch includes a predefined Admin user that always has full access—similar to a root account. It cannot be deleted. Its password can be reset from the Desktop Console using User & Access Rights Manager → Change Password.
Resetting the Admin Password Using NCCLI
If the Desktop Console is unavailable or the built-in Admin account becomes inaccessible, you can reset the password using the NetCrunch Command-Line Interface (NCCLI).
To do this:
- Open a terminal on the NetCrunch server
- Navigate to the NetCrunch\bin directory
- Run the following command:
nccli.exe reset-admin-password
Replace your_new_password with the desired password. This resets the password for the Admin account immediately. You must run this command with administrative OS privileges.
This method ensures password recovery even when no console access is available.
Standard User Profile
Every standard user has:
- A personal login and access profile
- Notification settings
- Console preferences
- Optional AD integration
You can assign users full or read-only access, or create custom access profiles for fine control.
Shared or Public Profiles
You can create shared login accounts (e.g., noc-operator) with restricted permissions. To prevent unauthorized changes:
- Enable: User cannot modify profile or password
- Ensure the profile has a defined password
- Disable profile editing in the Access Profile
This is useful for rotating operators, kiosks, or NOC stations.
Authentication Options
Local Accounts
Users can authenticate directly with credentials defined in NetCrunch.
Active Directory Integration
NetCrunch supports full AD integration, allowing centralized account management.
User Account Linking
You can link a NetCrunch user to an AD account via the Link with AD Account option. This syncs login identity and delegates password handling to AD.
AD Group Integration
Assign access profiles to AD groups to enable role-based control. When an AD user logs in:
- NetCrunch checks group membership
- The first matching access profile is applied
- If no match is found, login is denied
- If the user loses group membership, access is revoked automatically
You can control group evaluation order and priorities.
Organizations
NetCrunch supports multi-tenant visibility via organizations.
- Each user belongs to one organization (default is
<root>, which sees all nodes). - Nodes can be assigned to specific organizations.
- Users only see nodes and views relevant to their assigned organization or marked as public.
This model is ideal for MSPs, large enterprises, or restricted internal teams.
Access Profiles
Access Profiles define what a user is allowed to do or see. They control:
- UI visibility (settings, maps, dashboards, tools)
- Access to configuration features
- Permissions to edit, acknowledge, or reset data
- Profile edit rights
Predefined Profiles
- Administrator Access – Full control
- Read Only – View-only access
You can create custom profiles and assign them to users or AD groups.
Notification Profiles
Each user can define notification rules for themselves or receive alerts via assigned Notification Groups.
Personal Notification Profiles
- Each user may define multiple channels: Email, SMS (via GSM), Web Push, or integrations
- Profiles can include time filters (weekdays, time ranges)
- Message templates can be customized per channel
Notification Groups
Use groups to assign notifications by role or function (e.g., “On-call Tier 1” or “Network Engineers”). Users inherit group notifications and can override or disable them.
Password Reset and User Maintenance
Password resets and security actions are managed in the User & Access Rights Manager.
- Admins can reset passwords or force password change on next login
- Locked accounts can be unlocked
- Expired credentials can be updated manually or via AD sync
Summary
NetCrunch provides a flexible, secure user model:
- Multiple consoles, shared or personal access
- Role-based delegation using access profiles
- Full support for Active Directory
- Notification routing via profiles and groups
- Organizational scoping for multi-team environments
Whether you're managing a single admin or dozens of operational users, NetCrunch ensures each user has the right view, the right tools, and the right alerts—nothing more, nothing less.
Managing NetCrunch Access Profiles
Access Profiles in NetCrunch define what users can see and do in the system. They form the foundation of role-based access control and allow scalable, high-performance delegation of privileges to individuals and groups. This topic explains how to design and apply Access Profiles to achieve the right balance between security and usability.
Overview
Access Profiles in NetCrunch represent reusable, role-based permission sets that define access to:
- Program features (like dashboards, settings, server operations)
- Atlas views (containers, dashboards, maps)
- Specific nodes and their functions
Unlike many systems that tie permissions directly to users (and slow down as the number of users increases), NetCrunch applies permissions through shared profiles. This makes access evaluation extremely fast, even in large environments, and simplifies administration.
Each user—whether local or AD-authenticated—can have one access profile, either assigned directly or inherited through group membership.
Two Strategies for Assigning Access
NetCrunch supports two core strategies for designing access:
Deny by Default (Recommended)
This is the default model:
- Start with no access to anything
- Explicitly add access only to required views, nodes, or features
This approach is safer, easier to audit, and minimizes accidental overexposure.
Allow by Default
In this model:
- Grant access to all views and nodes initially
- Selectively deny access to sensitive or restricted elements
This approach can be useful in smaller environments or for quick setup, but it's less secure by nature.
Both strategies can be implemented in the same UI by adjusting the Atlas Defaults and View/Node Overrides in the profile editor.
Role-Based Model
Access Profiles should be treated as roles, not per-user settings.
- You create roles like "NOC Operator", "Tier 2 Support", or "Server Admin"
- Assign those profiles to multiple users or AD groups
- This ensures consistency and centralizes permission changes
Changing access rights in one profile instantly affects all assigned users, avoiding duplication and misalignment.
Profile Assignment
- For local users: assign the Access Profile directly in their account settings
-
For Active Directory users: assign the profile to an AD group
- When the user logs in, NetCrunch checks group membership
- If multiple groups match, the first matched profile (based on order) is applied
- If the user loses group membership, access is revoked
There is no limit to the number of access profiles you can define.
Access Rights Structure
NetCrunch uses a hierarchical, path-based access model. Each object or operation can be granted:
- Deny – Block access to the item or function
- Access – Allow viewing, reading, or executing
- Manage – Allow configuration or editing
Access rules are evaluated from longest path to shortest. This means more specific rules override broader defaults.
Examples:
Node→ basic access to the nodeNode > Events→ access specifically to the node’s event viewAtlas View > Nodes→ access to all nodes within a view, but not necessarily to the view itself
Access Scope
Access profiles can define rights in three scopes:
Program
Controls access to core system features:
- Server settings
- Monitoring tools
- Logs and system info
- Desktop Console access (via "Server Administration" right)
Atlas Defaults
Set default rights for all nodes or views unless overridden.
- Useful for “Allow by default” strategy
- Can grant view access without node access (or vice versa)
Views & Nodes
Here you define specific overrides—either granting or denying access at the element or feature level.
- Override default behavior from the Atlas Defaults
- Restrict access to sensitive views or critical nodes
- Allow visibility to a view but hide specific nodes in it
This distinction is key: having access to a view doesn't mean the user can see every node inside it.
Desktop Console and Web Console
Both consoles now share a unified security model. The Desktop Console functions exactly like the Web Console regarding permissions, fully honoring granular access profiles. This means the Desktop Console is no longer restricted to users with Server Administration rights; it adapts to the specific view and node-level permissions assigned to the logged-in user.
Summary
Access Profiles in NetCrunch are lightweight, scalable, and built for performance. Designed around roles, not individuals, they allow fast permission evaluation even in large user environments. Whether you're using a deny-first model for strict control or an allow-all model with exceptions, NetCrunch keeps access control simple, auditable, and efficient—with no artificial limits on how many profiles you define.
Managing Alerting Message Formats
Message formats define how alert data is rendered and delivered across notifications, integrations, and automated actions. They provide a reusable, consistent, and highly customizable layer between events and alerting mechanisms.
Purpose of Message Formats
In NetCrunch, message formats control how event information is transformed into textual output used by alerting actions such as emails, SMS messages, syslog records, scripts, or external integrations.
Instead of embedding message text directly into alert rules or actions, NetCrunch separates:
- Event detection – what happened
- Action execution – what should be done
- Message rendering – how the information is presented
This separation allows message content to evolve independently from monitoring logic and ensures consistency across all alerting channels.
Where Message Formats Are Used
Message formats are consumed by most alerting and automation mechanisms, including:
- Email notifications
- SMS and short-message gateways
- Syslog forwarding
- Ticketing and integration connectors
- Script execution (local, remote, SSH)
- Writing to files or system logs
The same event can therefore produce different representations depending on the delivery channel, without duplicating alert rules or actions.
Message Variants
A single message format can contain multiple variants, each optimized for a specific output channel or purpose.
Typical variants include:
- Full text (detailed, human-readable)
- Short text (compact summaries)
- Structured or integration-oriented text
- Channel-specific formats (email, SMS, syslog, scripts)
Variants allow you to control verbosity and structure without redefining the core message logic.
Event Scope of Message Formats
Message formats can be defined at different levels of scope:
Global (Default) Formats
Global formats act as system-wide defaults. They are used whenever no more specific format is defined for an event or rule.
This ensures that every alert action always has a valid message representation.
Event Class–Specific Formats
Formats can be assigned to an event class, applying to all rules that belong to that class.
This is useful when a group of related events requires: - A common structure - Shared terminology - Consistent parameter usage
Rule-Specific Formats
For maximum precision, formats can be overridden for individual event rules.
Rule-specific formats are ideal when: - A particular event needs additional context - External integrations require a custom layout - Certain alerts must be more concise or more verbose than others
Parameters and Dynamic Content
Message formats are built using parameters, which are resolved dynamically at runtime.
Parameters may include:
- Common event metadata (time, severity, state)
- Source object information (node, device type, address)
- Event-specific properties
- Extended data provided by sensors or monitoring logic
This allows a single format definition to adapt automatically to different events and objects.
Reuse and Consistency
One of the key advantages of message formats is reuse.
- The same format can be referenced by multiple actions
- Updates to a format automatically affect all consumers
- Teams can standardize alert wording across departments and tools
This is especially valuable in larger environments where alerts are consumed by: - Operations teams - External systems - Automation workflows
Default Message Formats for Actions
NetCrunch allows you to define default message formats per action type.
This establishes a clear baseline, for example: - Emails use a detailed format - SMS uses a short format - Syslog uses a structured format - Scripts receive a predictable text payload
Defaults reduce configuration effort while still allowing overrides when needed.
Design Best Practices
When designing message formats, consider the following guidelines:
- Keep human-facing messages readable
- Keep machine-facing messages predictable
- Avoid unnecessary verbosity for high-frequency alerts
- Use extended parameters only where they add value
- Prefer reuse over duplication
A well-designed set of message formats significantly improves alert clarity, reduces noise, and simplifies integrations.
Conceptual Summary
Message formats are a core abstraction in NetCrunch alerting:
- They decouple alert content from alert logic
- They enable consistent communication across channels
- They scale from simple notifications to advanced integrations
By treating message rendering as a first-class concept, NetCrunch allows alerting to remain flexible, maintainable, and future-proof.
Managing Calculated Performance Counters
Create calculated counters from existing performance counters and use them like regular metrics.
Settings Resources Calculated Performance Counters
Calculated Performance Counters let you define new counters by applying arithmetic formulas to existing counter values.
Use them when a device, system, or monitoring engine provides raw values, but you need a derived metric such as utilization percentage, total throughput, remaining capacity, or a normalized value.
For example, a device may expose bytes sent, bytes received, and interface speed separately. You can create a calculated counter that returns interface bandwidth utilization as a percentage.
Calculated counters extend counters from a monitoring engine by using named source counters and a numeric expression.
After you define a calculated counter, NetCrunch exposes it like any other counter from the selected monitoring engine. You can use it in charts, reports, dashboards, and performance trigger alerts.
Opening Calculated Performance Counters
pgcPage1
Open the Calculated Performance Counters window from:
Settings Resources Calculated Performance Counters
The window contains:
- a searchable list of calculated counters grouped by monitoring source
- existing counter definitions for Linux Counters, Mac OS Counters, SNMP Metrics, and other available engines
- an editor for the selected counter
- a variables section listing source counters used by the expression
- an expression editor
- save controls
Counter List
The left panel shows calculated counters grouped by monitoring engine or counter source.
You can:
- search counters by name
- expand or collapse counter groups
- select an existing calculated counter
- add a new calculated counter by clicking the + button
- delete a selected counter by clicking the delete icon
Counter groups depend on available monitoring engines and configured counter sources. Typical groups include:
- Linux Counters
- Mac OS Counters
- SNMP Metrics
Creating a Calculated Counter
pgcPage2
Click + in the counter list to add a new calculated counter.
Select or create the group where the calculated counter should belong. The group determines where the calculated counter will be available later when selecting performance counters.
Setting the Counter Name
pgcPage3
Enter the full calculated counter name in the Name field.
Use the standard counter path format:
Object/Counter.Instance
The instance part is optional and depends on the counter type.
Examples:
Interfaces/% HD Bandwidth Utilization
Cisco Memory/% Memory Used
Disk Performance/Total I/O Operations/sec
System/% Free Memory
Counter names should be structured consistently with existing counters because users will later browse and select them in the same way as native counters.
Adding a Description
Use the Description field to explain what the calculated counter measures.
Example:
Half Duplex Interface bandwidth utilization
A useful description should state:
- what the counter measures
- which source values it uses
- whether the result is a percentage, rate, total, or normalized value
- any assumptions, such as full duplex or half duplex calculation
Adding Source Counters as Variables
pgcPage4
The Variables section lists source counters used by the calculated counter.
Each variable maps a readable variable name to an existing counter.
Example:
$BytesSent = Interfaces(_VCounter)\Bytes sent/sec
$InterfaceSpeed = Interfaces(_VCounter)\Speed
$BytesReceived = Interfaces(_VCounter)\Bytes received/sec
Variables must be referenced in the expression by using the $ prefix.
Example:
$BytesSent
$BytesReceived
$InterfaceSpeed
Click + in the Variables section to add another source counter. NetCrunch assigns or lets you define a variable name for the selected counter.
Use variable names that describe the value clearly. Avoid short or ambiguous names unless the expression is trivial.
Good examples:
$BytesSent
$BytesReceived
$InterfaceSpeed
$MemoryUsed
$MemoryFree
Poor examples:
$a
$b
$x1
Editing the Expression
pgcPage5
Use the Expression editor to enter the arithmetic formula for the calculated counter.
Example:
($BytesReceived + $BytesSent) / $InterfaceSpeed * 800
This example calculates half-duplex interface bandwidth utilization by adding received and sent bytes per second, dividing the result by interface speed, and converting bytes to bits.
The expression can use:
- variables defined in the Variables section
- arithmetic operators
- numeric constants
- supported functions such as
min()andmax()
Variables must match the names defined in the Variables list.
Expression Examples
Interface bandwidth utilization
($BytesReceived + $BytesSent) / $InterfaceSpeed * 800
Use this formula when byte counters are measured per second and interface speed is measured in bits per second.
Memory used percentage
100 * ($MemoryUsed / ($MemoryUsed + $MemoryFree))
Use this formula when a device exposes used and free memory as separate raw counters.
Free memory percentage
100 * ($MemoryFree / ($MemoryUsed + $MemoryFree))
Use this formula when you want the inverse of used memory percentage.
Total disk operations per second
$ReadsPerSec + $WritesPerSec
Use this formula when read and write operation rates are exposed separately.
Clamped utilization value
min(100, max(0, $Utilization))
Use this formula when a calculated result should be limited to a valid percentage range.
Saving Changes
Click Save after changing the counter name, description, variables, or expression.
The Save button is enabled only when the definition contains changes that can be saved.
Editing Existing Calculated Counters
Select an existing calculated counter from the list.
You can edit:
- name
- description
- source variables
- expression
Changing an existing calculated counter affects every place where the counter is used, including reports, dashboards, and alert definitions.
Review dependencies before changing the meaning or unit of an existing counter.
Deleting Calculated Counters
Select a counter and click the delete icon.
Before deleting a counter, verify that it is not used by:
- monitoring packs
- node settings
- performance trigger alerts
- reports
- dashboards
- graphical views
Deleting a counter that is already used can leave dependent configuration incomplete.
Best Practices
Use clear names that follow existing counter naming patterns.
Keep expressions simple enough to audit later.
Describe the expected unit in the description when the unit is not obvious.
Avoid changing the meaning of counters already used in alerts or reports.
Create a new calculated counter instead of rewriting an existing one when the old formula may still be needed.
Test calculated counters on real devices before using them in alert thresholds.
Common Problems
Variable is not recognized
Check that the variable exists in the Variables section and that the expression uses the $ prefix.
Correct:
$BytesSent + $BytesReceived
Incorrect:
BytesSent + BytesReceived
Result is much too small or too large
Check unit conversion. Network counters may be reported in bytes per second, while interface speed is often reported in bits per second.
Counter does not appear where expected
Check that the calculated counter was created under the correct monitoring source or counter group.
Expression is valid but alert thresholds behave unexpectedly
Verify the calculated counter unit and scale before creating performance trigger alerts.
Summary
Calculated Performance Counters convert existing counter values into derived metrics. They are useful when raw device counters do not directly match the value you want to monitor.
A calculated counter consists of:
- a counter name
- a description
- source counters mapped to variables
- an arithmetic expression
Once saved, the calculated counter becomes available like any other performance counter in NetCrunch.
Devices with Multiple Network Interfaces
Monitor multi-interface devices with granular control and flexible grouping options
In NetCrunch, each IP Node represents a single network interface, not the whole device. This design enables granular monitoring, as each interface may run different services and require distinct monitoring profiles.
To simplify the view and reduce data collection on less critical interfaces, NetCrunch allows you to group multiple interfaces under one primary node:
- Primary Interface: Fully monitored with performance data collected
- Secondary Interfaces: Placed into Simplified Monitoring, checking only the up/down status without storing performance metrics
Grouping Interfaces
There are several ways to combine multiple interfaces into a single logical device:
- Select multiple nodes and use Represent nodes as one device
- Open the Primary Interface properties and add Secondary Interfaces
- Open a Secondary Interface and select its corresponding Primary Interface
This approach keeps monitoring efficient and organized, especially for servers or infrastructure devices with multiple NICs.
Time Restriction Scheme
Custom scheduling options for monitoring, alerts, and notification, allowing for precise control over various program activities.
The program uses time restrictions to define time conditions for various elements, such as node monitoring, alerting conditions, or notification schemes.
In recent versions, the time restriction scheme has been extended to allow different schemes to be set for each weekday. You can select a single time range by including or excluding a specific time range, providing greater flexibility in scheduling.

Time Restriction Scheme is used for:
- Actions
- You can set when an action can be executed.
- Event Condition
- For some conditions such as: event not happened in the time between.
- Notification
- In the user profile, each notification type can have different time range settings. For example, you can receive some notification types on weekdays and others on weekends.
- Atlas Monitoring
- Here, you can set a global monitoring scheme for Atlas.
- Node Monitoring Scheme
- Each node can have its monitoring time scheme.
- Node State Alert
- You can set an alert if the node is not in the right state at the given time (for example, in instances when it should be DOWN at night).
Action Restrictions
Tailored action restrictions for complex and situational action execution in response to alerts, such as time-specific activities, location-based notifications, and critical condition responses.
Each action can have its restrictions.

This makes action lists more flexible as you can limit the execution of the action to:
- Alert Severity
- Time Range (see Time Restriction Scheme)
- Node Importance (execute notification for critical nodes)
- Node Group
- Organization
This allows for defining complex conditions and action lists.
Usage Examples
Run different actions for different times of day or weekday
Define two actions and set different times of the day or different weekdays.
Run actions based on node location
You may want to notify different groups of administrators depending on the node location. NetCrunch creates Atlas views for locations. Also, you can create custom views based on custom fields (be it additional information like department or some organizational unit name) and assign each view to each action.
Restart the server if the alert is critical after some time. Weekend nights only.
You might assign a restart action to a specific alert, but you might also decide to restart servers after a certain amount of time if the issue remains unresolved. This needs limiting action only to nodes being members of the Servers view. As each action has time after it executes since the alert started, you can decide to run restart after some time. Additionally, you might want to repeat these steps only on weekend nights.
Managing Event Log Views
Automatic and customizable event log views with a visual query builder for efficient filtering, enabling tailored analyses without a need for time-consuming text searches.
Automatic Views
Several views are created automatically and can be selected from the drop-down menu. These views are generated for Monitoring Packs and Sensors, providing quick access to relevant information.

Creating Custom Views
NetCrunch can store millions of events in a history event log. These events are fully searchable, but searching them in the text form would be very slow.
To make it easy, we added a visual query builder, which allows you to create filtering conditions for the database. Once you define your view, you can store it and select it later.

You can create views using many event fields. You can also search for event parameters.

Filtering Event Parameters
We recommend creating a bracket condition and adding parameter names and their values as desired.
Time Range
The view definition doesn't contain the time range, which is selected for each view separately.
Managing Multiple Node Settings
Read how to change node settings, such as monitoring time and device type for multiple nodes, and how to manage the alerting and reporting settings differently.
You can always select multiple nodes, but if you want to manage nodes as a group, consider creating a separate Atlas view for the group.
Creating a new Atlas View by selecting multiple nodes and dragging them into the Custom Views section is effortless.
Changing Node Settings
NetCrunch allows you to manage multiple node settings easily. Select multiple nodes in a table or on the graphical icon view, and then select Node Settings from the context menu.
You can use existing Atlas views to narrow your selection.
For instance, if you want to select all Windows servers, you can view Atlas TreeCustom ViewsServer TypesWindows Server and press Ctrl+A to select all nodes in the view. Then, you can select Node Settings from the context menu or press Shift-F2.
Managing Alerts & Reports
We strongly encourage you to create Monitoring Packs with the same settings for multiple nodes. Then, you can select multiple nodes and add your new Monitoring Pack to them.
On every single node, you can override settings assigned by Monitoring Packs. For instance, you can change actions (add some) or even disable some alerts.
When you select multiple nodes, however, you can only add or remove Monitoring Packs.
Configuring Notification Services
Read to configure emails and text messages (SMS) with NetCrunch notifications.
You can receive notifications about alerts and reports as emails or text messages (SMS). First, you need to set up the configuration parameters.
Go to the Options page and click `Notification' option.
Configuring external email server
You can use the built-in NetCrunch mechanism or you can define a list of external SMTP mail servers. The system also supports the TLS encryption protocol, if needed.
Configuring GSM modem or phone
For alert notifications via text messages (SMS), you need to select the COM port used to communicate with the mobile phone, SMS settings and options related to the GSM device such as the PIN of the SIM card.
You may also need to enter AT+C commands if they require additional configuration.
You can even use a standard cable attachment, which after installation will be visible in the system as one of the computer's COM ports.
- COM Port
- Shows the COM port selected for communication with the mobile phone. Clicking the Browse button opens the GSM Device Discovery dialog window, where you should choose/configure the appropriate COM port and test if NetCrunch can connect to the device. If there are any connection problems, check the modem documentation to see what speed is required to work properly.
SMS Settings
- Limit to Single Message
- Messages longer than 160 chars will be split into several messages. You will receive them as a single piece, but you will pay for the number of messages at your operator's rates.
- Encoding
- The Auto option is enabled by default here. Change it if you receive text messages with encoding issues.
Modem Settings
- PIN
- You can set the PIN number of the SIM card related to your GSM device.
- Initialization AT+C Commands
- Select this check box if the modem requires additional initialization AT+C commands.
Managing Node Custom Data
You can easily extend the NetCrunch node database by adding custom fields to each node. This allows for creating views and controlling alerting action execution.
NetCrunch allows you to add custom fields to node properties. There are several predefined fields. Some fields (like Info1 and Info2) are there for compatibility with old versions. Fields can be used to organize data.

You can add these fields: number, text, date, time, or picklist.
Additionally, Text type can be converted to a picklist anytime and vice-versa.
Custom node fields can create dynamic views (defined by filtering conditions). Atlas View membership also controls alerts and action execution. See Action Restrictions
Configuration Tips
Read what configuration problems you should fix to make sure everything works fine.
NetCrunch does many things automatically, but it needs your input in some places. For instance, it's necessary to provide proper credentials to access operating systems and valid SNMP profiles.
Resolve the Monitoring Issues
Monitoring Issues are problems related to the monitoring process. They require your attention. In most cases, they are related to invalid or missing credentials.
Fix Missing Device Types
NetCrunch uses Device Types to implement automatic monitoring. For example, if a device is not set to be a Windows type, Windows monitoring will not start or even be accessible for the node.
Open a network map and look for icons with a question mark, which indicates that they are missing a device type. NetCrunch automatically detects device vendors, which can help set the device type.
Only Windows (and other systems if added to Active Directory) and SNMP devices should have their device type set automatically. You must manually set their device type for other devices (those displayed as the "unknown device type").
Review the Settings page
Please check the Settings page to see what is enabled or disabled in your monitoring configuration.
For example, you can enable monitoring of the Physical Segments or NetFlow here.
Adding Custom Root Certificates to NetCrunch
NetCrunch uses node.js for secure SSL/TLS & HTTPS connection. Some of the certificate authorities might be not included. You can add additional root certificates to the external\Root Certificates folder in the NetCrunch Server data directory.
The certificate must be in PEM format.
(no links)
Node Monitoring Templates
Use templates for streamlined setup, allowing creation from existing nodes or scratch, customizable section inclusions, and easy application to IP nodes, with interactive sensor configurations requiring reference nodes for detailed settings.
[+] Monitoring Template
Node Monitoring Template is a settings node. Its sole purpose is to provide settings to other nodes. When parameters change, they propagate automatically to associated nodes.
You can create a template from scratch or choose the existing node as a source for the template. Additionally, you can assign the template to the prototype node.
The template can contain all sections or sections that can be excluded, so when the template is applied to the node, it won't override these parts.
Except for sensors, you can set up all node monitoring settings similarly, like on the real monitored node. When setting a sensor, you need to select a reference node. Many sensor configurators are interactive and need to pull some data from the actual node. For example, the WMI sensor may need to read WMI classes; the SQL sensor needs a list of databases.
Using Templates
You can use templates for IP nodes monitored by NetCrunch Server. Monitoring probe nodes are not supported. Using templates is even easier than creating them.
- Select the template for the node.

- Template sections will cover your node settings. You can see the settings applied underneath.

- You can override the settings of a particular section by clicking on the pencil icon at the top right corner.
Core Monitoring
Everything about monitoring configuration. Read how you can monitor various aspects of the network hardware and software.
Monitoring Concepts
Review basic concepts like Monitoring Engines, Node State Monitoring, and how to disable monitoring.
Monitoring Packs,
Monitoring Dependencies,
Event Suppression, Monitoring Issues
The main purpose of NetCrunch is to monitor your network. It also offers you documenting and organizing services.
So, everything in NetCrunch is well organized - the Atlas root is at the top, the views go below, then there are nodes, and finally, on the lowest level, there are various objects and their performance metrics and status objects.
Monitoring Engines
Monitoring Engine is a software component responsible for the specific type of monitoring.
Monitoring Engines simplifies the monitoring configuration, as they are responsible for a certain monitoring channel.
For example, you might define many things being monitored using the SNMP Engine. Still, all of them share the same configuration parameters for a particular node such as SNMP port and profile to be used. A very similar situation happens with other operating systems where the configuration contains credentials for the connection.
If you are familiar with other concepts such as sensors or probes, please be advised that they are much more comparable to Monitoring Packs in NetCrunch.
NetCrunch Monitoring Engines
- SNMP - requires SNMP to be configured on node
- Windows - Windows monitor must be enabled
- Linux - Linux monitor must be enabled
- macOS - macOS monitor must be enabled
- BSD - BSD monitor must be enabled
- Solaris - Solaris monitor must be enabled
- Inventory - requires Windows OS monitor to be enabled
- VMware ESX/i & vCenter - monitoring of vCenter, ESXi and virtual machines
- Network Services (MPMON) - multi-protocol monitor
- Flow Analyzer
- Sensor Engine - provide various scalable sensor monitors
Monitoring Sensors
The list of sensors is constantly growing.
See full list in Sensors
Node State Monitoring
The central part of monitoring is determining the node state. Everything being monitored on the node depends on its state.
When the node is considered to be DOWN, the node's monitoring almost stops until NetCrunch recognizes that the node is responding again.
NetCrunch determines the node state upon monitoring of network services (see: Network Services Monitoring).
Read more about Monitoring of Network Nodes
Managing Monitoring Engines
When you go to Node SettingsMonitoring, you will get the list of monitors available (bound) to the node. There you can manage engine properties for the node.
Monitoring by Device Type
Some monitoring packs use Device Type information (especially SNMP devices) to be enabled for a specific device only. In the case of the SNMP monitoring, the program automatically detects Device Type upon SNMP object data.
Read more in Automatic Monitoring and Organizing
Monitoring Issues
Monitoring Issue is a problem related to the monitoring process, like missing credentials or improper response from the device.
We decided to make issues related to the monitoring process to stand out from other problems related to your network services and devices. They are usually related to wrong or missing credentials or Windows security settings.
See also: Configuration Tips
Disabling Monitoring
As the monitoring is enabled by default, it's more interesting to know how you can disable it. You can disable it at any level.
Disabling the Atlas
Atlas Properties
You can disable monitoring for the entire Atlas. You can disable it for some time (for maintenance) or schedule being disabled for a future time range.
Disabling the Network
IP NetworkProperties
You can go to IP Networks and disable monitoring of a specific Network indefinitely, or just for a given time period.
Automatically by Dependencies
NetCrunch manages monitoring dependencies that should reflect connection dependencies. If properly set, NetCrunch automatically disables the monitoring of nodes depending on a certain connection. This helps to lower monitoring traffic and also prevents false alerts.
Read more in Preventing False Alarms
Monitoring of Network Nodes
Read about node state evaluation and node monitoring settings.
As the node represents a single network endpoint (not the device), a primary monitoring subject, everything else in monitoring depends on the node state.
Node State
NetCrunch defines the following node states:
- OK
- Everything is fine - the node and its services are responding.
- Warning
- There is some problem with a service or the Monitoring Engine on the node. Monitoring Issues also turn node into a Warning state.
- DOWN
- Node is not responding - in this state, only one service is monitored to bring the node back to the normal monitoring state.
- Unknown
- Node state can't be determined - for example, the node has no IP address or has not been monitored yet.
- Disabled
- Node monitoring is disabled for some reason. There are many reasons why the node is disabled, such as: by Atlas, by Time Restrictions, by the User, or by Dependency.
Simplified Monitoring
The program determines only a node and a service state by checking network services availability (PING) without tracking performance metrics.
Extended Service Monitoring
In some cases, the status of the node can be determined in the second interval.
Read more about Network Services Monitoring
Monitoring Dependencies
The monitoring of each node can depend on its parent node (network switch or router). This causes an automatic disabling of node monitoring in case the parent link or device is DOWN.
Read more in Preventing False Alarms
Prioritization and Event Suppression
In large networks with remote intermediate routers, NetCrunch organizes monitoring by priorities. By default, the nodes being closer to NetCrunch Server and intermediate routers are monitored before others.
Event Suppression is the technique of preventing false alarms caused by network intermediate connection failure.
Monitoring Time Mask
When a node is active in certain hours or days, you might limit monitoring to a given time range and weekdays.
Network Services Monitoring
Availability and performance monitoring of 70 network services such as FTP, HTTP, SMTP, etc.
The monitoring of network services is the basic monitoring type in NetCrunch. A node state is determined basically by the availability of network services. When a node is in the DOWN state, it's only monitored by a single network service.
Availability and Response Time
Services monitoring checks basically:
- Connectivity
- Response received
- Response Time and Failure Rate
NetCrunch sends a request, appropriate for a given service protocol, and then checks if the response matches the defined response. The process should be at least repeated 3 times to measure response time, and then the average response time is calculated. For each request, you can set an appropriate time to wait for a response.
Each monitored service provides the following performance metrics:
WTF - where is a precise description of counters?? Ask Piotrek
- Round Trip Time - total time to send and receive a single response or a connection time for extended services
- Check Time - total checking time (including sending multiple requests in extended mode)
- % Failure Rate - calculated per each service checking
- % Packets Lost - calculated per each service checking
Leading Service
Leading Service is a network service designed to be checked as the only service when the Node is DOWN.
Monitoring in seconds interval
For some critical nodes, you might want to react in seconds instead of minutes. Then you can check for leading service monitoring Monitor in seconds interval.
The option will let the leading service be monitored more often than once per minute whenever a node is DOWN or alive. As an option, you can set NetCrunch to determine the node state solely upon the state of the leading service; otherwise, it can check other services immediately after the leading service fails.
Customizing Existing Services
NetCrunch allows the monitoring of network services by their respective default ports. When you need to monitor a service on different ports, go to SettingsResourcesNetwork Services and choose New Service. Then you will be able to duplicate the service with the new name and different port. For example, define HTTP_8080 for checking HTTP on port 8080.
Simple TCP checking service
In some cases, all you need is a simple TCP port connection checking without sending any further data. In order to create simple TCP port checking go to Settings Resources Network Services, click New Service and select a desired option.
Defining Custom Services
As a third option, you might decide to create a full request/response checking service definition. In order to create such definition, go to Settings Resources Network Services click New Service and select Create from Scratch option.
- Set Protocol Type (TCP, UDP, or TLS/SSL) and Port Number.
- Define the Request to be sent (after connection if TCP is used) - you can enter either text or binary data in the hexadecimal format.
-
Define response patterns. You can set multiple patterns and decide how they should be checked.
Patterns can be text, hexadecimal binary data, or regular expression.
Pattern matching options are:
- any of the added patterns match
- all of the added patterns match
- none of the added patterns match
Automatic Discovery of Network Services
As the node status depends on the services, each time a new node is added to the atlas, NetCrunch automatically discovers services running on the node. By default, NetCrunch is configured to check only a subset of all defined services.
You can manage the list of services being automatically discovered in Settings Monitoring Auto Discovered Services
Troubleshooting
To get some monitoring services to work properly, an additional configuration task should be performed.
DHCP Server Checking Restrictions
-
NetCrunch must be able to open the 68 UDP (DHCP client) port to receive a response to the DHCP inform request. The monitoring will not be working if NetCrunch is running on a machine where the DHCP Server has been installed, as it uses the same port.
-
The IP address of the NetCrunch machine must be included in any checked DHCP Server Scope (WINDOWS DHCP Server tested). For example, if the machine where NetCrunch is running has the address 192.168.1.100, and the DHCP Server is on 192.168.88.10, then the server must have the scope with any range from 192.168.1.x addresses. A Linux-based DHCP Server must have the authoritative option enabled.
MySQL Server
We need to clarify whether it is working or not.
Monitoring MSSQL Express
To monitor MSSQL Express, the TCP/IP protocol must be enabled, and the server instance must accept a remote connection on TCP port 1433. Please refer to the MSSQL Express documentation for information about enabling the TCP/IP and allowing the remote connection to the server instance.
SSH Service
NetCrunch allows monitoring of SSH service using a protocol ver. 1 and/or ver.2. By default, the SSHv2 protocol is monitored on the network nodes. Use SSHv1 service in the case when the node supports the older version of SSH.
Network Traffic Monitoring
NetCrunch supports many flow protocols as application monitoring using Cisco NBAR.
NetCrunch supports two technologies that allow network traffic monitoring. The first gathers information from switches about the traffic on particular ports, and the second can collect flow data from routers and switches.
Monitoring Traffic on Switch Ports
Switches collect statistics about traffic on their ports, which are available in Physical Connections views. These views can give an overview of traffic between two switches or between the switch and servers.
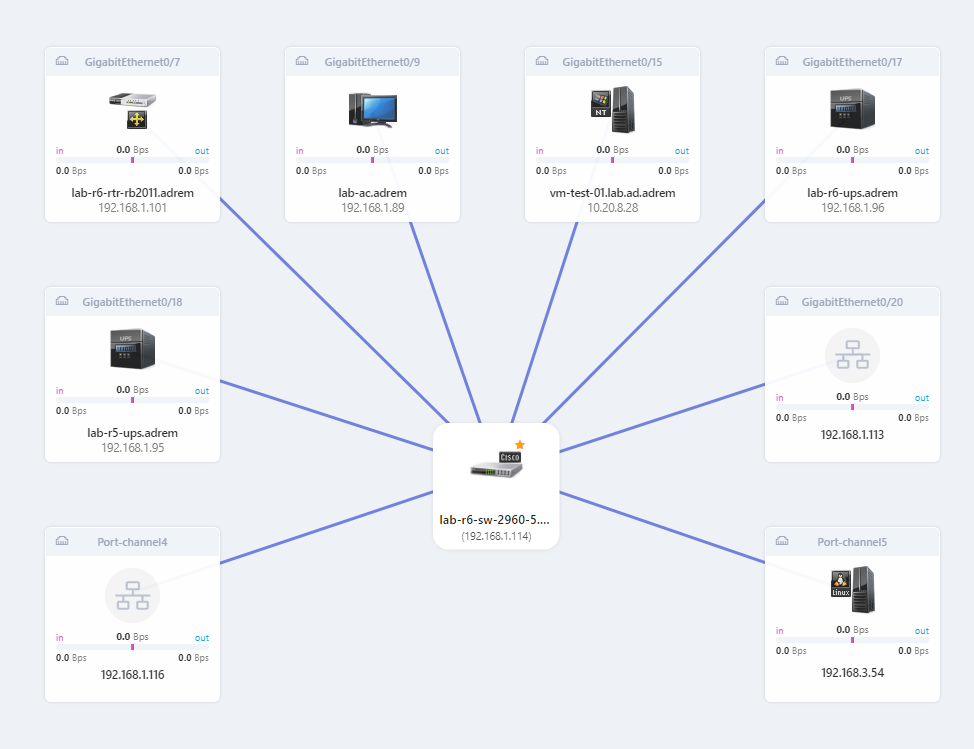
You can see aggregated traffic information in the last hour or the last 24 hours. When you select a link on the map, you can open the Connection Status details and the traffic history.
Monitoring Traffic with NetFlow
Introduction
There are many flow-export formats on the market today. Netflow is a Cisco trademark (aka cflow), but similar protocols include jFlow, rFlow, NetStream, AppFlow, and sFlow.
For the NetFlow suite of protocols, we often see version 5 (supported by most devices), some combined v5/v7 (the Catalysts), and some version 9 of the newer devices.
Supported Flow Technologies
NetCrunch supports the following flow protocols:
- NetFlow v1, v5, v8, v9, and IPFix,
- NetStream
- CFlow
- AppFlow
- rFlow
NetCrunch collects and analyzes received flows for aggregation in the 15-minute and 1-hour ranges. This allows you to analyze data in a short period and store long-term performance trends.
Currently, NetCrunch supports single flow aggregation to receive data from multiple flow sources. However, they are aggregated together on a single dashboard.
Performance
Currently, Netcrunch flows can receive up to:
~ 3000 packets/sec
~ 35000 flows/sec (average 12 flows per packet)
sFlow Disclaimer
NetCrunch is capable of receiving sFlow, but the protocol's statistical nature requires different processing and data aggregation over a much longer period.
NetFlow Views
NetFlow Dashboard
Overview Flows
NetCrunch shows global flow traffic statistics on the top Atlas Dashboard. When you click on any chart bar, you can see traffic details for a selected element.

The view shows the current aggregated statistics from all flow sources sending data to NetCrunch.
Flow Analytics
NetCrunch allows you to analyze traffic using various criteria. The program allows you to create custom application definitions and supports Cisco NBAR technology for application monitoring.

The program also allows the creation of custom application definitions based on protocol and ports.
Node Traffic

Performance Trends
Monitoring SNMP Devices
NetCrunch provides complete SNMP monitoring, including support for v3, traps, and MIB compiler.
SNMP was developed on UNIX back in 1988 - so it's a pretty mature technology now. Despite various new protocols, it's probably the most widely implemented management protocol today. SNMP is defined in RFC (Request For Comments) by IETF (Internet Engineering Task Force) and is used everywhere: servers, workstations, routers, firewalls, switches, hubs, printers, IP phones, appliances...
SNMP Versions
Today, most devices support SNMPv2c. There are available agents for operating systems, but they can be a security loophole if they don't use SNMPv3. On the other hand, network virtualization helps separate traffic so that VLANs can separate older SNMP devices.
Top hardware devices usually support SNMP v3, which adds more security to the protocol (authentication and encryption). NetCrunch supports all SNMP versions: SNMP v1, SNMP v2c, and SNMPv3, including decoding traps. NetCrunch SNMP implementation supports SNMPv3 following encryption algorithms: DES, 3DES, AES 128, AES 192 and AES 256.
Please note that SNMPv3 is more expensive in processing power (because of encryption) on both sides - the device and SNMP manager application.
To avoid device overload, we recommend limit pending SNMP requests in SNMP Settings ( icon in SNMP section) on any nodes that use SNMP.
SNMP Profiles
NetCrunch uses SNMP profiles to manage communities and passwords for SNMP. The profiles allow you to use the same SNMP security settings for multiple nodes. SNMP Profiles encapsulate settings necessary to communicate with the particular SNMP Agent.
Profiles define the SNMP protocol version and information related to protocol version and security settings: the community string (SNMPv2); or authentication user, password, and encryption to be used (SNMPv3).
Additionally, the profile allows specifying different protocols for reading and writing operations. For example, you can set up reading operations to use SNMPv2 and disable writing.
To receive and decode SNMPv3 traps, you need to define a separate SNMPv3 Traps & Trap Info profile.
Because SNMPv2 is much more efficient (it allows asking for multiple values at once), we recommend using SNMPv2 for monitoring.
Monitoring SNMP Variables
To access SNMP data on a particular node, you must make it SNMP enabled by Node SettingsMonitoringSNMP. To create an alert on the SNMP counter value, you need to set up a Performance Trigger alert.
Setting Alerts on Numerical Values
Select the node, open Node SettingsMonitoring, and you'll see the SNMP section grayed out. Please enable it. NetCrunch will use the default profile. Set the proper profile in SNMP monitor settings.
Now you can click on the Custom monitoring pack, add New Event for SNMP Performance Counter, choose one of Event Triggers for Counters, and select the SNMP variable as the counter.
We have the following options for SNMP counters:
- Enter OID
- This option allows you to enter an arbitrary OID number - you might obtain it just from the device using a simple MIB walker tool. Using OID allows accessing SNMP data even if you do not have the MIB for the device.
- Select from MIB
- To select an SNMP variable, you can browse SNMP MIB data. This method requires first importing and compiling MIB data into the NetCrunch MIB database. NetCrunch includes a database of 8700 popular MIBs. There are also websites maintaining their own set of MIBs. You can download them and use the NetCrunch MIB compiler to extend your MIB database.
- Predefined Counter
- This option is about choosing from predefined SNMP counters - these are some standard counters used. You can extend this list for later use to avoid tedious MIB tree browsing.
Setting Alerts on Text Values
Besides numerical values, you can also monitor text values returned by the SNMP agent. To do this, you have to select <New Event for SNMP Variable Value> and enter OID or select the object from the MIB database. Then you can check the following conditions:
- Value equals to given value
- Value not equals to given value
- Value contains given value
- Value does not contains given value
- Value matches regular expression
- Value does not match regular expression
- Value changed
- Value unchanged
Creating of Monitoring Pack for SNMP
Settings Alerting & Notifications Monitoring Packs and Policies
Select SNMP only from the restrictions drop-down menu when creating a new monitoring pack.
SNMP Views
SNMP only describes the variables and get/set operations, so browsing the OID MIB tree is somewhat tricky. SNMP tables often refer to other tables and raw data is not readable.
NetCrunch SNMP Views allow for creating tables and forms that are more human-readable, allowing reading and entering SNMP data.
Additionally, views are automatically managed according to device type and supported MIB.

Receiving SNMP Traps
Check if the SNMP trap listener is enabled. Settings Monitoring SNMP Trap Receiver
Node SettingsMonitoring or Settings Alerting & Notifications Monitoring Packs and Policies
NetCrunch allows receiving SNMPv1 traps, SNMPv2c, and SNMPv3, including encryption. To turn a trap into an alert, you must define an alert on the node sending the SNMP trap message.
NetCrunch receives all traps and puts them in the External Events window. You can add the necessary node and trap with one click in this window, even if the node didn't exist in the atlas before.
To receive SNMPv3 traps, you need to define SNMPv3 Traps & Trap Info first. Otherwise, the program won't be able to decode trap data.
The profile also contains the field for 'Remote SNMP Engine Id,` which you have to set according to the SNMPv3 trap specification ([see RFC2570](http://www.ietf.org/rfc/rfc2570.txt)).
Read more in Receiving SNMPv3 Notifications
Forwarding SNMP Traps
Settings Monitoring SNMP Trap Receiver
After receiving an SNMP trap, NetCrunch can forward it "as is" to another SNMP manager.
MIB Compiler
NetCrunch MIB compiler allows you to extend the NetCrunch MIB database used to select SNMP traps and variables during configuration and resolve OID to names for incoming SNMP data (traps).
It's an advanced multi-pass compiler that can set up module name aliases to compile otherwise incompatible modules.

Custom SNMP Views
Create custom SNMP forms and tables that make SNMP device data readable, editable, and easier to interpret.
NetCrunch SNMP Views let you create custom forms and tables for specific SNMP-capable device types. They make raw SNMP variables easier to read, organize, and edit.
There are two types of SNMP views:
formviews display separate SNMP variables, such assysLocationorsysUpTimegridviews display SNMP tables, such asifTable
SNMP Views are especially useful when raw MIB browsing is too low-level for everyday monitoring or administration.
Form View
The Form view displays a set of SNMP variables as fields.
name: Example
type: form
fields:
  - caption: Description
    var:
      type: oid
      ref: 1.3.6.1.2.1.1.1.0
  - caption: Location
    var:
      type: oid
      ref: 1.3.6.1.2.1.1.6.0
    writable: true
Editable Field
Add the writable: true attribute to make a field editable.
To edit SNMP values, the node must use a read-write SNMP profile.
Auto-refresh Field
NetCrunch can read a variable periodically.
Add the autoRefresh attribute to refresh the value every given number of seconds.
autoRefresh: 15
This example refreshes the field every 15 seconds.
Concatenated Field
Use a concatenated field to display two SNMP values in one field.
fields:
  - caption: Machine
    var:
      type: concat
      refs:
        - type: oid
          ref: 1.3.6.1.2.1.1.5.0
        - type: oid
          ref: 1.3.6.1.2.1.1.6.0
      concat: $1 in $2
The default format for the concat attribute is $1 $2, but you can add text between the variables.
Calculated Field
Use a calculated field to calculate a value from two SNMP variables.
fields:
  - caption: Total ICMP packets
    var:
      type: expr
      refs:
        - type: oid
          ref: 1.3.6.1.2.1.5.1.0
        - type: oid
          ref: 1.3.6.1.2.1.5.14.0
      expression: "+"
Possible expressions:
+sum-subtraction*multiplication/division%percent calculation
Mapped Field
Use a mapped field when an SNMP variable returns a numeric value that represents a known state.
For example, a UPS may return a numeric code for its current state. A Value Map can translate this raw value into readable text.
fields:
  - caption: State
    var:
      type: map
      ref: 1.3.6.1.4.1.318.1.1.1.4.1.1.0
      lookup:
        type: map
        name: apcUPSCurrentState
Table View
The Table view displays a set of SNMP columns.
All specified columns must belong to the same SNMP table. You can join a column from another SNMP table, but the row indexes in both tables must be consistent, or you must specify a lookup reference.
name: Example Table
type: grid
columns:
  - caption: Description
    var:
      type: oid
      ref: 1.3.6.1.2.1.2.2.1.2
    display:
      width: 20
      sort: asc
      summary: count
  - caption: In Octets
    var:
      type: oid
      ref: 1.3.6.1.2.1.2.2.1.10
      dataType: int
    display:
      width: 20
      summary: sum
    autoRefresh: 15
  - caption: Out Octets
    var:
      type: oid
      ref: 1.3.6.1.2.1.2.2.1.16
      dataType: int
    display:
      width: 20
      summary: sum
    autoRefresh: 15
    format:
      type: convert
      format:
        units: Digital
        from: B
  - caption: ifType
    var:
      type: oid
      ref: 1.3.6.1.2.1.2.2.1.3
To group data by a column, add the groupBy attribute and specify the column caption.
groupBy: ifType
Column Display Properties
Optionally, you can set default column properties.
display:
  width: 20
  sort: asc
  summary: count
Available properties:
width- default column widthsort- default sorting, eitherascordescsummary- summary footer. Possible values arecount,sum,min, andmax
Editable Column
Add the writable: true attribute to make column cells editable.
A read-write SNMP profile must be defined on the node to edit SNMP values.
Auto-refresh Column
NetCrunch can refresh column data periodically.
Add the autoRefresh attribute to refresh all column rows every given number of seconds.
autoRefresh: 15
Concatenated Column
Use a concatenated column to display row values from two SNMP columns in one column.
columns:
  - caption: Machine
    var:
      type: concat
      refs:
        - type: oid
          ref: 1.3.6.1.2.1.1.5.0
        - type: oid
          ref: 1.3.6.1.2.1.1.6.0
      concat: $1 in $2
The default format for the concat attribute is $1 $2, but you can add text between the variables.
Calculated Column
Use a calculated column when each row should contain a value calculated from the corresponding rows of two other columns.
columns:
  - caption: In + Out
    var:
      type: expr
      refs:
        - type: oid
          ref: 1.3.6.1.2.1.2.2.1.10
        - type: oid
          ref: 1.3.6.1.2.1.2.2.1.16
      expression: "+"
Possible expressions:
+sum-subtraction*multiplication/division%percent calculation
Lookup Column
In SNMP, values in one table often refer to values in another table.
For example, the ipNetToMediaIfIndex column 1.3.6.1.2.1.4.22.1.1 of the ipNetToMediaTable table contains the ifIndex of the interface on which the entry is effective.
To display the interface name instead of the raw index, use a lookup reference to ifDescr 1.3.6.1.2.1.2.2.1.2.
columns:
  - caption: Interface name
    var:
      type: lookup
      ref: 1.3.6.1.2.1.4.22.1.1
      lookup: 1.3.6.1.2.1.2.2.1.2
Mapped Column
Use a mapped column when an SNMP table column returns numeric codes that should be displayed as readable text.
A Value Map translates the numeric value into a label, such as Up, Down, Testing, or a vendor-specific state.
columns:
  - caption: Operational status
    var:
      type: map
      ref: 1.3.6.1.2.1.2.2.1.8
      lookup:
        type: map
        name: statusUpDown
Joining Tables
You can display columns from different SNMP tables if the row indexing in both tables is consistent. This usually means that the second table extends the first table.
Examples include:
ifTable1.3.6.1.2.1.2.2ifXTable1.3.6.1.2.1.31.1.1
In the example below, the view displays:
ifDescr1.3.6.1.2.1.2.2.1.2fromifTableifName1.3.6.1.2.1.31.1.1.1.1fromifXTable
name: Join Example
type: grid
columns:
  - caption: ifDescr
    var:
      type: oid
      ref: 1.3.6.1.2.1.2.2.1.2
  - caption: ifName
    var:
      type: lookup
      ref: index
      lookup: 1.3.6.1.2.1.31.1.1.1.1
Value Mappings
A Value Map defines how numeric SNMP values are translated into human-readable text.
Many SNMP devices return numeric status codes instead of meaningful labels. For example, an interface, UPS, printer, sensor, or power module may return values such as 1, 2, or 3. The Value Map provides the corresponding display text, so tables and forms can show readable state names instead of raw numbers.
Optionally, you can assign a color to each mapped value. When a color is specified, NetCrunch shows a colored icon before the display text. This makes states easier to distinguish visually, especially in tables with many rows.
Use Value Maps whenever an SNMP numeric value has a known textual representation.
Typical use cases:
- Interface status values
- UPS operating states
- Printer states
- Hardware sensor states
- Power supply states
- Vendor-specific status codes
For example, the predefined map statusUpDown converts numeric values such as 1 and 2 into readable states like Up and Down.
Value Map in a Table View Column
Use type: map for the variable and specify the map name in the lookup section.
columns:
  - caption: Operational status
    var:
      type: map
      ref: 1.3.6.1.2.1.2.2.1.8
      lookup:
        type: map
        name: statusUpDown
Value Map in a Form View Field
The same mapping mechanism can be used in form fields.
fields:
  - caption: State
    var:
      type: map
      ref: 1.3.6.1.4.1.318.1.1.1.4.1.1.0
      lookup:
        type: map
        name: apcUPSCurrentState
When to Use Value Maps
Use a Value Map when the raw SNMP value is technically correct but not useful for the operator.
Without a Value Map, the user sees this:
1
2
3
With a Value Map, the user sees this:
Up
Down
Testing
This improves readability and reduces the need to remember vendor-specific numeric codes.
Data Format
You can format values to make them easier to read.
String Format
You can add a unit or additional text to the value.
format:
  type: str
  format: $1 Unit
Scaling
You can multiply the value if necessary.
var:
  type: oid
  ref: 1.3.6.1.2.1.2.2.1.16
  dataType: int
  scale: 0.001
  precision: 2
Use the precision attribute to limit the number of decimal places.
Conversions
You can configure automatic unit conversion.
For example, if the value is returned in bytes:
format:
  type: convert
  format:
    units: Digital
    from: B
The displayed value is automatically converted to KB, MB, GB, or another suitable unit.
Possible input units:
- bytes:
B,KB,MB,GB - bits:
b,Kb,Mb,Gb
SNMP Time
Use the time format to convert SNMP TimeTicks, which are hundredths of a second, into a readable elapsed time.
fields:
  - caption: Uptime
    var:
      type: oid
      ref: 1.3.6.1.2.1.1.3.0
      dataType: time10msec
      format:
        type: time
        format: elapsed
Summary
Custom SNMP Views let you turn raw SNMP data into practical operator views.
Use:
formviews for selected SNMP variablesgridviews for SNMP tablesconcatvariables to combine valuesexprvariables to calculate valueslookupvariables to resolve references between tablesmapvariables and Value Maps to translate numeric codes into readable statesformat,scale, andprecisionto improve value presentation
Correctly designed SNMP Views reduce low-level MIB browsing and make vendor-specific device data easier to understand.
Cisco IP SLA operations
NetCrunch supports Cisco IP SLA technology.
Sensors
IP SLA Single Operation
Node SettingsMonitoringAdd IP SLA OperationIP SLA Single Operation
This sensor allows monitoring of the status of IP SLA operations on the Cisco devices. Select the operation previously defined on a Cisco device when you add the sensor. Operations are grouped by protocol type.
Program can alert on the following conditions:
- Operation cannot be completed successfully
- Operation is not active or does not exist on the router
Additionally, you can set performance triggers (thresholds) on the following metrics:
- % Availability
- Completion Status - status code of the operation.
- RTT - Operation completion time (ms).
IP SLA Multi-Operation
Node SettingsMonitoringAdd IP SLA OperationIP SLA Multi-Operation
The sensor can monitor all operations of a given type, or it can select operations by their parameters:
- Operation id (specify list or range)
- Target IP address
- Admin tag
- Operation group
Unlike a Single IP SLA Operation sensor, the operation configuration cannot be modified.
Default Metrics
- % Availability
- Operation RTT
Sensor alerts
- Any of the monitored operations have an invalid state.
Status
In the node status window, NetCrunch shows the status of all IP SLA operations defined on the Cisco device.

Essential Sensors
DNS Query, System Uptime, RADIUS, SSL Certificate & SSH Remote Ping.
dns-query
DNS Query Sensor
Node SettingMonitoringAdd Monitoring SensorDNS Query DNS service is the most vital part of every infrastructure. NetCrunch allows checking for DNS query results and detects unwanted changes.
DNS sensor allows you to check if the DNS responses are valid. This helps identify problems in DNS or to check whether records have been altered.
This sensor allows you to send a query for a name or an address to a given DNS server (you should add it to the DNS server node). You can enter a name to check (a domain name), and you can define alerts to check if DNS records match expected results. Predefined sensor alerts include
- Query execution error
- Request timeout
- No DNS records in response.
Also, you can set an alert on Response time and Check time. You can query IPv4 and IPv6 addresses.
You can match a value of the following record types:
- Location Record (LOC)
- Mail Exchange Record (MX)
- Name Server Record (NS)
- Resolve Canonical Name (CNAME)
- Resolve IPv4 Address (A)
- Resolve IPv6 Address (AAAA)
- Resolve Name (PTR)
- Service Locator (SRV)
- Start of Authority (SOA)
- Text Record (TXT)
Each record can be tested for conformance with a given pattern.
system-uptime
System Uptime Sensor
Node SettingMonitoringAdd Monitoring Sensor System Uptime Sensor supports WMI, SSH/Bash and SNMP.
The sensor monitors device uptime measured in seconds.
Predefined sensor alerts:
- Authentication error
- Connection Error
- Device has been restarted
Also, you can set an alert on Response Time and Check Time.
radius
RADIUS Sensor
The sensor checks the user authentication process and validates the response from the RADIUS server. If you need checking service responsiveness only, then you can use Network Services and RADIUS service from the list. See Network Services Monitoring.
Predefined sensor alerts:
- Request error
- Request timeout
Sensor measures:
- RADIUS.Sensor/Check Time
- RADIUS.Response/Time
The sensor allows setting alert on response conformance equals or doesn't equal given value.
ssl-certificate
SSL Certificate Sensor
The sensor can check any SSL/TLS connection (SSH and any other protocol working on TLS). It checks the SSL certificate expiration date and the certificate properties. The sensor allows the checking of all certificate fields.
Predefined sensor alerts:
- Connection Error
- Certificate Expired
- Certificate is about to expire
- Certificate changed
- Certificate has been revoked
- Weak public key
- Certificate authority invalid
The sensor shows warning status if the certificate is not authorized or the public key is too short. You can set an alert on the certificate field conformance and status object change for the certificate or public key.
Besides, you can set an alert on such metrics as Response Time, Check Time and a number of Days Until Certificate Expires.
ssh-remote-ping
SSH Remote Ping
The sensor checks connectivity from a remote system by running Ping remotely by the SSH server.
It allows setting threshold on the following counters:
- % Availability
- Response Time
- Check Time
Predefined sensor alerts:
- Connection Error
- Authentication Error
- Ping timeout
You can also add an alert when the Ping Response object status changed.
Composite Status
Composite Status is an atlas node representing an aggregated state of the group of other status objects. The status depends on group type, which can be critical, redundant, or influential.
Although the above statement is perfectly valid and exactly describes how the Composite Status, it doesn't answer why and when you might need it.
Because the names of object states are different, we need to clarify them.
- error is a synonym for
DownorCritical. - success is a synonym for
OK.
Let's start with an example.
As the user, I want to see the internal system's status, which depends on two internet connections, DNS, AD, and the web server. Internet connections are redundant, but all other elements are critical to the system.
You might decide to create a Business Status Node and add each element to the appropriate group in such a case. As the node can be part of another Business Status, you can even build up a tree of statuses.
Besides placing such status on the dashboard map and alerting, you can document logical dependencies of process elements.
The overall status of the Composite Status is calculated upon element groups and is the highest status of each group.
The order of statuses: Unknown OK Warning Error.
- Critical
- The group state is the highest state of any element in the group. For example, if any element is in the
Warningstate, the group state isWarning. - Redundant
- If any element is in the
WarningorErrorstate, then the composite status object is in theWarningstate. If all elements are in theErrorstate, the composite status isError. - Influential
- If any element is in the
Errorstate, then the resulting state isWarning.Even if all elements are in theErrorstate, the whole group state will be at the mostWarning.
Monitoring Printers
NetCrunch delivers sophisticated printer monitoring capabilities by utilizing SNMP protocols, facilitating detailed tracking and management of printer performance.
Printer Sensor
The Printer Sensor in NetCrunch goes beyond simple supply-level monitoring. It tracks various printer statuses and can alert you to alarms and performance issues, ensuring a comprehensive oversight of printer health. It's most effective with printers that support Printer MIB v2, a standard that offers in-depth insights into printer status and performance metrics.
Alerts
NetCrunch's Printer Sensor offers detailed and specific monitoring through several alert types:
- Alert on Performance Counter Metric: Notifies you if specific printer performance metrics exceed predetermined thresholds.
- Alert on a Status Object: Keeps you informed about changes in key printer statuses, such as operational readiness or maintenance requirements.
- Printer Alert: General alerts for a range of detected printer issues, from paper jams to connectivity problems.
- Authentication Error: Informs you of any authentication issues, ensuring secure and authorized printer access.
- Request Timeout: Alerts you if the printer fails to respond within a set time frame, indicating potential communication or hardware issues.
Counters
The Printer Sensor also tracks the following metrics:
- Printed Page Count: This feature tracks the number of pages the printer prints.
You can set a
Limit Thresholdto receive an alert when the number of pages printed exceeds the threshold value within a specified period (e.g., day, week, etc.). - Colorant Containers\% Fill Level: The percentage of ink or toner remaining in each colorant container.
- Supplies\% Remaining: The overall percentage of remaining printer supplies, like ink or toner.
- Receptacles\% Remaining: The remaining capacity percentage in waste receptacles, like toner collection units.
Default Alerts
NetCrunch includes pre-configured alerts for common issues, enabling immediate responses:
- Alert on Authentication Error
- Alert on Request Timeout
- Cover is Open
- Low Container Filling Level
- Printer Critical Alert
- Receptacle is Full
- Colorant Container Nearly Empty
- Limited Space in Receptacle
IPMI Monitoring
Intelligent Platform Management Interface (IPMI) is a set of computer interface specifications for an autonomous computer subsystem that provides management and monitoring capabilities independently of the host system's CPU, firmware (BIOS or UEFI) and operating system.
IPMI supports two types of authentications: one-key and two-key authentication. One-key authentication requires the user password. The encryption key consists of only 0's (default). Two-key authentication requires both the user password and non zero encryption key. NetCrunch sensors support both types of authentication. The encryption key can be set in the credential profile window.
basic-ipmi
Basic IPMI Sensor
IPMI v2.0/RMCP+
This sensor can monitor various hardware parameters such as system temperature, fan speed, power supply voltages, etc. The availability of these parameters depends on the hardware monitored and the IPMI configuration of the monitored device.
Common parameters:
- voltage
- fan rpm
- temperature
Available parameters for the particular device will be displayed when selecting the counters when setting up the threshold. Some counter descriptions may include thresholds values.
Credentials:
Enter your username and password for the IPMI.
Counters:
- Value [units] or % Value
Default Report
contains the following metrics:
- Basic IPMI.Fan\Value [RPM]
- Basic IPMI.Fan\% Value
- Basic IPMI.Temperature\Value [degrees C]
- Basic IPMI.Voltage\Value [Volts]
Default Alerts:
- Request Timeout
- Authentication Error
generic-ipmi
Generic IPMI Sensor
IPMI v2.0/RMCP+
This IPMI sensor can monitor all possible parameters received from the monitored device. A filter allows specifying the exact parameters to be monitored. Parameters can be filtered based on their type, entity (i.e., location), and name.
Common numeric parameters:
- voltage
- current
- fan rpm
- temperature
- altitude
The sensor also reads non-numeric parameters containing status messages.
Credentials
Enter your username and password for the IPMI.
Alerts
- Request Timeout Error
- Authentication Error
- Event on status Object Change
- Event for Monitoring Sensor Counter
ibm-imm-ipmi
IBM IMM IPMI
This IPMI sensor is configured to monitor all essential metrics from an IBM IMM device.
Monitored parameters:
- Temperature
- Power Supply
- Power Unit
- Fan
- Current
- Voltage
Default Report
contains the following metrics:
- IMM IPMI.Fan\Value [RPM]
- IMM IPMI.Temperature\Value [degrees C]
- IMM IPMI.Voltage\Value [Volts]
Alerts:
- Request Timeout Error
- Authentication Error
- Fan status has changed
- Temperature status has changed
- Power Supply status has changed
- Power Unit status has changed
hp-ilo-ipmi
HP iLO IPMI
This IPMI sensor is configured to monitor all essential metrics from an HP iLO device.
Monitored parameters:
- Temperature
- Power Supply
- Power Unit
- Fan
- Current
Default Report
contains the following metrics:
- iLO IPMI.Fan\% Value
- iLO IPMI.Temperature\Value [degrees C]
- iLO IPMI.Current\Value [Watts]
Alerts:
- Request Timeout Error
- Authentication Error
- Fan status has changed
- Temperature status has changed
- Power Supply status has changed
- Power Unit status has changed
dell-idrac-ipmi
Dell iDRAC IPMI
The sensor is configured to monitor all essential metrics from a Dell iDRAC device.
Monitored parameters:
- Fan
- Temperature
- Voltage
- Memory
- Physical Security
- Drive Slot
- Critical Interrupt
- Power Supply
Default Report
contains the following metrics:
- iDRAC IPMI.Fan\Value [RPM]
- iDRAC IPMI.Temperature\Value [degrees C]
- iDRAC IPMI.Voltage\Value [Volts]
Alerts:
- Request Timeout Error
- Authentication Error
- Fan status has changed
- Temperature status has changed
- Power Supply status has changed
- Voltage status has changed
ipmi-log
IPMI Log Sensor
The IPMI Log sensor can retrieve logs from the System Event Log (SEL), a non-volatile repository for system events, and certain system configuration information. Alerts can be set on new log entries that match user-defined expressions. Logs can be filtered based on their IPMI sensor type, event message, and event transition direction(event_dir).
Example:
A log entry with the following fields:
- IPMI sensor type: "processor",
- message: "processor presence",
- transition direction: "Assertion Event"
This indicates that the event was generated because a processor has become present (inserted). The same log entry but with the transition direction field set to "Deassertion Event" would indicate that the event was generated because the processor had become not present (removed).
Credentials
Enter your username and password specified for the Intelligent Platform Management Interface.
Alerts:
- Request Timeout Error
- Authentication Error
- Alert on text log entry
Performance Metrics
- Sensor.Check Time
Dell EMC Sensor
The Dell EMC Sensor is designed to monitor the health status and power consumption of a Dell EMC storage device. This is achieved using the Unisphere Management REST API. With this sensor, users can monitor vital information related to file systems, Logical Unit Numbers (LUNs), and storage pools present within the Dell EMC system.
Options:
-
Connection Profile: This allows you to specify details about how to connect to the Dell EMC system.
-
Authentication Profile: Define the authentication credentials required to access the Unisphere Management REST API.
Alerts:
- Connection Error: Triggered if there's an issue connecting to the Dell EMC system.
- Authentication Error: Raised if there's an authentication problem when trying to access the system.
- Filesystem space is almost full: Alerts the user when the storage space in the file system is nearing its limit.
- Pool space is almost full: Notifies the user when the storage space in a pool is close to being full.
- System Health Status Alert: Generated if there's any change in the overall health status of the Dell EMC storage device.
Default Reports:
Filesystem Report:
- Dell EMC.Filesystem\Used Size [bytes]: Represents the amount of storage space currently being used in the file system.
LUN Report:
- Dell EMC.LUN\Snap Size [bytes]: Indicates the snapshot size of a LUN.
Pool Report:
- Dell EMC.Pool\Free Size [bytes]: Shows the amount of storage space available in a pool.
- Dell EMC.Pool\Used Size [bytes]: Displays the amount of storage space that's already been utilized in a pool.
- Dell EMC.Pool\Snap Size Used [bytes]: Represents the amount of snapshot storage space used in a pool.
System Report:
- Dell EMC.System\Current Power [watts]: Displays the current power consumption of the Dell EMC storage device.
ICMP Jitter Sensor
The sensor sends a series of ICMP packets and calculates Jitter based on RTT.
Jitter is a typical problem of the connectionless networks or packet-switched networks. Each packet can be transmitted by a different path and arrive at different times from the emitter to the receiver.
Jitter means interpacket delay variance. When multiple packets are sent consecutively from a source to a destination, for example, 100ms apart, and if the network is behaving ideally, the destination should receive the packets 100ms apart. But if there are delays in the network (like queuing, arriving through alternate routes, and so on), the arrival delay between packets might be greater than or less than 100ms.
If the difference is positive, it is counted in positive jitter. A negative value is counted in negative jitter.
Counters:
- Average Time
- Maximum Time
- Minimum Time
- Jitter
- Negative Jitter
- Positive Jitter
- % Packet Loss
- Packet Count
Alerts:
- Request Timeout
- Connection degradation
- Jitter is high
- Jitter is very high
References
Traceroute Sensor
The sensor can alert when the number of hops to the destination has changed
The sensor executes traceroute to host using ICMP Echo requests.
Parameters:
- Timeout (ms) - timeout for each hop
- Maximum hop count
Counters:
- Hop Count
Alerts:
- Number of hops has changed
- Trace is incomplete
Traceroute - will be in the Warning state if trace can't be completed (target address is unreachable or maximum number of hops has been reached)
Monitoring of Network Interfaces
NetCrunch provides detailed monitoring of network interfaces for SNMP-enabled devices, combining flexible policy-based selection, full duplex-aware metrics, real-time delta calculations for errors and discards, VLAN and MAC mapping, CDP/LLDP-based topology view, and a best-in-class interface visualization and alerting system.
NetCrunch monitors network interfaces using a policy-driven approach that enables precise, automatic selection of interfaces to monitor. Monitoring is based on SNMP, allowing support for a wide range of network devices including switches, routers, firewalls, servers, and other equipment.
Each monitored interface provides detailed traffic, status, error, and topology-aware data, supporting advanced visualization and alerting capabilities.
Interface Monitoring Overview
When SNMP monitoring is enabled on a device, NetCrunch automatically adds an Interface Sensor to the node. This sensor uses a Monitoring Policy to determine which interfaces are included. Not all interfaces are monitored — typically, only those matching the configured policy (such as active, Ethernet, or IP interfaces) are selected.
Monitoring includes:
- Bandwidth usage tracking
- Admin and operational status
- Errors and discards (delta-based)
- VLAN and MAC address mapping
- Interface grouping and visualization
- Duplex-aware utilization tracking
- CDP/LLDP-based physical segment discovery
Configuring Interface Monitoring
Monitoring Policies
Interface selection is driven by Monitoring Policies. Policies use filter expressions to automatically include or exclude interfaces based on criteria like type, status, or description.
Common built-in policies:
- All – Includes all SNMP-reported interfaces.
- All active (default) – Includes interfaces that are up and active.
- Ethernet only – Selects only Ethernet interfaces.
- IP only – Selects only interfaces with an assigned IP address.
- Custom filter – Create a custom expression based on any available interface properties.
Policies can be selected during node configuration at
Node SettingsMonitoringInterfacesEdit Sensor Settings.
64-bit Counters
NetCrunch prefers 64-bit counters when available (device must support SNMPv2c or SNMPv3). 64-bit counters prevent overflow issues on high-speed links (such as 1 Gbps, 10 Gbps, or faster).
When 64-bit counters are unavailable, NetCrunch falls back to 32-bit counters but provides warnings if overflow risk is detected.
Interface Identification Templates
Correctly identifying interfaces across device reboots is crucial. SNMP indexes (interface IDs) can change, but names like ifAlias or ifDescr usually remain stable.
You can customize the identification template using tokens:
$ifAlias$ifDescr$ifName$ifIndex
Example template:
$ifAlias|$ifDescr|$ifName
This instructs NetCrunch to use ifAlias first, then ifDescr, then ifName as fallback.
Template configuration is available at
Node SettingsMonitoringInterfacesIdentification Settings.
Monitored Metrics and Counters
NetCrunch monitors a wide range of interface metrics. Deltas are calculated automatically to provide rate-per-second values.
| Counter | Description |
|---|---|
| Admin Status | Configured status (enabled or disabled by administrator). |
| Operational Status | Actual operational state (up, down, testing). |
| Last Change | Timestamp when interface state last changed. |
| Speed | Current or overridden speed of the interface. |
| Bytes Received | Total bytes received on the interface. |
| Bytes Received/Sec | Rate of bytes received per second (delta). |
| Bytes Sent | Total bytes sent from the interface. |
| Bytes Sent/Sec | Rate of bytes sent per second (delta). |
| Errors | Total packet errors detected. |
| Errors/Sec | Rate of packet errors per second (delta). |
| Discards | Total number of packets discarded. |
| Discards/Sec | Rate of packet discards per second (delta). |
| Output Queue Length | Number of packets currently queued for transmission. |
| % FD Bandwidth Utilization | Full-Duplex bandwidth usage as a percentage of interface speed. |
| % HD Bandwidth Utilization | Half-Duplex bandwidth usage as a percentage of interface speed. |
| Unknown Protocols | Total number of packets received with unknown protocols. |
| Unknown Protocols/Sec | Rate of unknown protocol packets per second (delta). |
Speed Override
In real-world scenarios, the interface speed reported by SNMP might not match the actual usable link speed because:
- Hardware limits and software configuration differ
- Internet Service Providers assign logical speeds (e.g., 500 Mbps over 1 Gbps port)
- Virtual interfaces report generic speeds
- Speed autonegotiation issues or interface misreporting
To ensure accurate bandwidth utilization calculations, NetCrunch allows manual overriding of interface speed.
Configuration path:
SettingsMonitoringInterface Monitoring Settings
You can manually set:
- Correct link speed (e.g., 100 Mbps, 1 Gbps, 10 Gbps)
- Correct unit (bps, Kbps, Mbps, Gbps)
Errors and Discards Tracking
NetCrunch tracks delta values for errors and discards:
- Delta counters measure changes between polling intervals, not accumulated totals.
- Users can reset counters at any time to start a fresh observation period.
- This helps isolate intermittent issues such as cable faults, duplex mismatches, or congestion.
VLAN & Connected Device Insights
NetCrunch displays VLAN membership and connected devices directly within the interface view.
- Each interface shows VLAN assignments
- Side panel displays connected MAC addresses and IP mappings
- Hovering or clicking on a VLAN column reveals full VLAN names and tags
- Connected nodes are automatically linked if known in the Atlas
All this data is visible without external tools or config parsing.
Physical Segment Visualization
NetCrunch uses CDP and LLDP protocols to map physical Layer 2 links, including:
- Aggregated (trunk) links
- Port-channel interfaces
- Bandwidth load on each segment
- Topology views with click-through to live traffic stats
Interface links are drawn as network segments, and clicking them reveals:
- Interface description
- Traffic chart (Live, 24h, 7d, 30d)
- Input/output byte counts
- Errors and discards
Interface Grouping and Views
Interfaces can be grouped for better navigation and analysis.
Grouping Options:
- By Switch
- By VLAN
- By Switch and VLAN
- Ungrouped View
An upcoming release adds full grouping by VLAN across the Atlas — improving visibility into broadcast domains and tagged links.
Alerts for Network Interfaces
NetCrunch includes alerting options for:
- Interface state (UP/DOWN)
- Bandwidth utilization (%)
- Errors and discards (by count or percentage)
- Any other metric threshold
Threshold types include:
- Value, Range, Deviation, Delta, Limit, and others
Alerts are policy-driven and can be reused across multiple nodes and groups.
Licensing and Interface Monitoring
- Monitored interfaces consume license units
- Default: monitors only active interfaces
-
Use filters to avoid monitoring:
- Loopback interfaces
- Tunnels or virtual devices
- Disabled ports
What Makes NetCrunch Unique
- Policy-based interface selection with reusable filters
- Interface names identified via customizable templates
- Bandwidth metrics include both Full- and Half-Duplex modes
- Errors and discards are tracked as deltas, not just totals
- VLANs and MAC addresses are fully visible
- CDP/LLDP is used to draw Layer 2 topology
- Users can override reported interface speed to ensure accurate utilization
- Live views, graphs, and clickable topology map are built-in — no separate tools required
NetCrunch doesn’t just read interface counters — it understands network topology and presents actionable, integrated insights.
Monitoring External Sources
How NetCrunch monitors data originating outside built-in collectors using telemetry, scripts, files, and external APIs.
Purpose and Scope
Monitoring External Sources describes how NetCrunch collects and monitors data that is not produced by built-in collectors such as SNMP, WMI, or native device sensors.
An external source is any system, service, or interface that provides monitoring data but requires custom retrieval or transformation before it can be used by NetCrunch.
Examples include:
- External applications exporting metrics
- Custom scripts and command-line tools
- Files generated by other systems
- REST and HTTP-based APIs
- Third-party monitoring agents or exporters
This chapter explains how external data becomes NetCrunch monitoring data, regardless of its origin.
Conceptual Model
Monitoring external sources always involves two distinct concerns:
- Where data comes from – retrieval or reception method
- What the data represents – counters and status objects
These concerns are intentionally separated.
Counters and statuses describe measurement identity and state, not location or source
Scope is resolved by the sensor and node context in which the data is produced
External Monitoring Methods
NetCrunch supports several complementary methods for monitoring external sources. Each method addresses a different integration scenario.
Telemetry (Receive Data)
Telemetry is a push-based model where external systems actively send data to NetCrunch.
Use telemetry when:
- You control the data producer
- Near-real-time delivery is required
- Polling is not suitable or possible
Key components:
- Telemetry Node
- Data Receiver or Data Sensor
- Local or cloud endpoints
Preferred data format:
- NetCrunch Native Data Formats
Other formats can be accepted if transformed using Custom Data Parsers.
Scripts (Execute and Collect)
Script-based monitoring executes code and collects its output.
Use scripts when:
- Data is only available via CLI or shell
- SSH, PowerShell, or local execution is required
- Logic must be executed close to the target system
Supported scenarios:
- Remote SSH scripts
- PowerShell scripts
- Local scripts on the NetCrunch Server
Script output can be provided in:
- NetCrunch Native Data Formats
- Arbitrary formats parsed by Custom Data Parsers
Read more about Script Sensors...
Data Retrieval (Pull External Data)
Data retrieval is a polling-based model in which NetCrunch retrieves external data via standard protocols.
Use this method when:
- Data is exposed as files or endpoints
- Periodic polling is acceptable
- Direct execution is not required
Supported protocols include:
- HTTP and HTTPS
- FTP, SFTP, TFTP
- SSH command output
- Windows or SMB file access
Retrieved data can be:
- Directly interpreted using Native Data Formats
- Transformed using Custom Data Parsers
Read more about Data File Sensor...
REST and HTTP APIs
Many modern systems expose monitoring data through REST or HTTP APIs.
NetCrunch supports:
- Custom HTTP methods
- Query parameters
- Headers and authentication
- Cookies and session handling
REST APIs are typically used together with:
- Native Data Formats preferred
- JSON, XML, or text parsed by Custom Data Parsers
Read more about REST and HTTP monitoring...
External Event Sources
In addition to metric and status collection, NetCrunch can receive external events that represent discrete occurrences rather than continuous measurements.
External event sources are typically used for:
- Log-based alerting
- Security and audit events
- Infrastructure notifications
- Application and platform events
Supported external event sources include:
- Text log files
- Windows Event Log
- Syslog
- SNMP traps and notifications, including SNMP v3
- Webhook and HTTP-based messages
- Telemetry events delivered via OTLP (OpenTelemetry)
External events are ingested, classified, and correlated with nodes and services, allowing them to:
- Trigger alerts
- Contribute to node and service status
- Be stored, filtered, and searched
Event ingestion focuses on event semantics and context, not on metric extraction.
Read more about External Event Sources...
Data Formats and Transformation
Regardless of the monitoring method used, external data must be converted into NetCrunch counters and status objects.
Native Data Formats
NetCrunch Native Data Formats provide a direct and explicit way to define counters and statuses.
They are:
- Stable and version-safe
- Independent of the ingestion method
- Preferred whenever possible
If an external source can produce data in Native Data Formats, no parsing is required.
Read more about Native Data Formats...
Custom Data Parsers
Custom Data Parsers are used when incoming data cannot be provided in Native Data Formats.
They allow:
- Extracting values from XML, JSON, HTML, or text
- Transforming arbitrary structures into counters and statuses
- Applying logic using declarative selectors or scripts
Custom Data Parsers are a transformation layer, not a data source.
They are typically used together with:
- Data Retrieval
- Script-based monitoring
- REST and HTTP APIs
Read more about Custom Data Parsers...
Choosing the Right Approach
The following guidelines can help select the appropriate monitoring method:
-
Can the external system push data
→ Use Telemetry -
Can NetCrunch execute code to obtain data
→ Use Scripts -
Is data exposed via files or network endpoints
→ Use Data Retrieval -
Can data be produced in Native Data Formats
→ Prefer Native Data Formats -
Is the data format arbitrary or legacy
→ Use Custom Data Parsers -
Are you ingesting discrete notifications or logs
→ Use External Event Sources
Summary
Monitoring External Sources allows NetCrunch to integrate with virtually any system or data producer.
Key principles:
- The monitoring method defines how data is obtained
- Data formats define how measurements are represented
- Counters and statuses describe identity, not source
- Events represent discrete occurrences, not metrics
- Scope is resolved by sensor and node context
- Native Data Formats are preferred
- Custom Data Parsers enable compatibility with non-native formats
This separation ensures flexibility, scalability, and long-term maintainability of external monitoring integrations.
NetCrunch Native Data Formats
Native payload formats used by NetCrunch to ingest external monitoring data as counters, statuses, and contextual data objects using JSON, XML, and CSV.
Purpose and Scope
NetCrunch Native Data Formats define how external systems provide monitoring results to NetCrunch in a consistent, stateless, and monitoring-oriented way.
These formats are shared across all external ingestion mechanisms, including:
- Telemetry Node payloads
- Script and SSH-based sensors
- Data File sensors (FTP, FTPS, HTTP, HTTPS, SSH, TFTP, Windows/SMB)
- Receiver and legacy receivers
- REST and HTTP-based sensors
No matter how data arrives, NetCrunch interprets it using the same data model, so it can be used uniformly for:
- Alerting and policies
- Dashboards and charts
- Node status and sensor views
- Topology and map overlays
- Trending and reporting
Why a Native Format Exists
External sources are often stateless:
- scripts run periodically and just print results
- exporters and agents push snapshots
- devices and APIs usually return only the current state
- most systems do not store historical context
NetCrunch is the stateful component:
- it stores time series for counters
- it stores the last state for statuses
- it detects state transitions
- it stores contextual snapshots for data
This design makes external integrations simpler and safer. You can produce meaningful monitoring data without SDKs, local storage, or remembering previous values.
Core Elements
Every native payload may contain three types of elements:
- Counters
- Statuses
- Data objects
CSV supports counters only and is described at the end.
Counters
Concept
A counter represents a numeric value collected repeatedly over time. NetCrunch stores counters as time series for trending and alerting.
Typical examples of counters:
- CPU usage percent
- disk free bytes
- request rate per second
- temperature in degrees
- queue length
- memory free megabytes
- network bytes per second
Counter Structure Explained
A counter is identified by up to three parts:
- Object
- Category grouping related measurements
Examples:Processor,Disk,NetworkInterface,Weather - Counter
- The specific measured value
Examples:% Processor Time,Free Bytes,Temperature - Instance
- Optional identifier of a specific object
Examples:_Total,C:,eth0,Prague
A simple mental model:
- Object answers what kind of thing this is
- Instance answers which one
- Counter answers what is being measured
External Counter Path Format
When sending external data, counter paths must use:
Object/Counter.Instance
Rules:
- Object is optional. If omitted, NetCrunch uses
Default - Instance is optional. If omitted, there is no instance
- The dot always introduces an instance
- A dot cannot be part of a counter name
- Instance syntax rule
- The dot (
.) always introduces an instance.
Weather/Temperaturehas no instance.
Weather/Temperature.Praguehas instancePrague. - Object defaulting rule
- If the object is omitted, it becomes
Default.
Temperatureis treated asDefault/Temperature.
The documentation intentionally uses explicit object names in its examples. Relying on Default is valid, but explicit objects are clearer and scale better.
Examples of External Counter Paths
Single context counter, no instance:
Weather/TemperatureSystem/CPU UsageWeb/Latency ms
Multi instance counter, instance after dot:
Weather/Temperature.PragueDisk/Free Bytes.C:NetworkInterface/Bytes Received.eth0Sensor/Value.Channel 1
Display Format in the UI
In NetCrunch UI, counters are displayed using CIM style notation:
Object(instance)\Counter
This is a display format only. External payloads use the slash-and-dot format.
Examples:
Weather(Prague)\TemperatureDisk(C:)\Free BytesProcessor(_Total)\% Processor Time
Counter Declaration and Storage
To avoid uncontrolled metric growth, counters are persisted and trended only when they matter.
A counter is stored when at least one condition is true:
- a data collector declares the counter
- a threshold is defined on a node or through the policy (monitoring pack)
- a sensor has an option to collect all counters enabled
If you send a counter that is neither declared nor referenced, NetCrunch may ignore it. This protects the system from accidental metric explosions caused by scripts emitting dynamic or unbounded counter names.
JSON
{
  "counters": {
    "Weather/Temperature": 18.5,
    "Weather/Temperature.Prague": 16.2,
    "Disk/Free Bytes.C:": 82463372032
  }
}
XML
<nc>
  <counters>
    <counter path="Weather/Temperature">18.5</counter>
    <counter path="Weather/Temperature.Prague">16.2</counter>
    <counter path="Disk/Free Bytes.C:">82463372032</counter>
  </counters>
</nc>
Statuses
Concept
A status represents a discrete state rather than a numeric trend.
Statuses:
- store only the last value
- change over time
- are evaluated on transitions
They are ideal for stateless scripts and external sources.
Typical uses:
- service health
- availability checks
- logical modes
- environmental states
Stateless State Model
External systems report only the current state.
NetCrunch:
- stores the previous value
- detects transitions
- triggers alerts on change or specific transitions
This allows stateless scripts to behave like stateful monitors.
Standard Status Values
NetCrunch recognizes these standard states:
- unknown
- ok
- warning
- error
- critical
Custom Status Values
Custom textual or numeric values are allowed:
Rain,Storm,ClearPrimary,SecondaryOpen,Closed
Custom values may require explicit mapping in dashboards or policies.
Example: Service Health and Weather
The following example reports the health of the web service and the current weather.
JSON
{
  "statuses": {
    "WebService": "ok",
    "Weather": "Rain"
  }
}
XML
<nc>
  <statuses>
    <status name="WebService" value="ok"/>
    <status name="Weather" value="Rain"/>
  </statuses>
</nc>
Detailed Status with Metadata
Statuses may include additional context such as messages or diagnostic data.
JSON
{
  "statuses": {
    "WebService": {
      "value": "error",
      "message": "HTTP 503 from backend",
      "critical": true,
      "data": {
        "endpoint": "/api/orders",
        "retryAfter": 30
      }
    }
  }
}
XML
<nc>
  <statuses>
    <status name="WebService">
      <value>error</value>
      <message>HTTP 503 from backend</message>
      <critical>true</critical>
      <data>
        <item key="endpoint">/api/orders</item>
        <item key="retryAfter">30</item>
      </data>
    </status>
  </statuses>
</nc>
Data Objects
Concept
Data objects provide contextual monitoring information that explains what is happening right now.
They are:
- collected during the monitoring cycle or via telemetry
- stored as the latest snapshot only
- displayed automatically in the Sensor View
- not trended and not used for thresholds
Use data objects for:
- lists of connected users or sessions
- runtime statistics
- diagnostic tables
- grouped distributions
Data Views
Data Views are contextual views generated from the data branch of a native payload.
While technically represented as data objects in the payload, NetCrunch renders them as views and displays them automatically on the Sensor Views page of the node status.
Counters vs Data Objects
Use counters when you need trending or alert thresholds.
Use data objects when you need context or snapshot views and want to avoid high cardinality metrics.
Example: Connected Users Table
JSON
{
  "data": {
    "connectedUsers": {
      "type": "table",
      "name": "Connected Users",
      "columns": ["User", "Source", "Login Time"],
      "rows": [
        ["alice", "10.0.1.12", "10:21"],
        ["bob", "10.0.1.15", "09:58"]
      ]
    }
  }
}
XML
<nc>
  <data>
    <object id="connectedUsers" type="table" name="Connected Users">
      <data>
        <columns>
          <item>User</item>
          <item>Source</item>
          <item>Login Time</item>
        </columns>
        <rows>
          <row>
            <item>alice</item>
            <item>10.0.1.12</item>
            <item>10:21</item>
          </row>
          <row>
            <item>bob</item>
            <item>10.0.1.15</item>
            <item>09:58</item>
          </row>
        </rows>
      </data>
    </object>
  </data>
</nc>
Example: Contextual Time Series Snapshot
JSON
{
  "data": {
    "cpuHistory": {
      "type": "time-series",
      "name": "CPU History",
      "timestamps": [1672531200000, 1672531260000, 1672531320000],
      "values": [12, 15, 10]
    }
  }
}
XML
<nc>
  <data>
    <object id="cpuHistory" type="time-series" name="CPU History">
      <data>
        <timestamps>
          <item>1672531200000</item>
          <item>1672531260000</item>
          <item>1672531320000</item>
        </timestamps>
        <values>
          <item>12</item>
          <item>15</item>
          <item>10</item>
        </values>
      </data>
    </object>
  </data>
</nc>
Example: Category Distribution
JSON
{
  "data": {
    "httpCodes": {
      "type": "category",
      "name": "HTTP Responses",
      "categories": ["2xx", "3xx", "4xx", "5xx"],
      "values": [15230, 820, 431, 98]
    }
  }
}
XML
<nc>
  <data>
    <object id="httpCodes" type="category" name="HTTP Responses">
      <data>
        <categories>
          <item>2xx</item>
          <item>3xx</item>
          <item>4xx</item>
          <item>5xx</item>
        </categories>
        <values>
          <item>15230</item>
          <item>820</item>
          <item>431</item>
          <item>98</item>
        </values>
      </data>
    </object>
  </data>
</nc>
CSV Format
CSV is supported for counters only and is intentionally limited.
Path and Value Format
Weather/Temperature,18.5
Weather/Temperature.Prague,16.2
Disk/Free Bytes.C:,82463372032
Detailed Format
Weather,Temperature,,18.5
Weather,Temperature,Prague,16.2
Disk,Free Bytes,C:,82463372032
Data File Sensor
The sensor allows getting data from various sources and processes them to get metrics and status values.
FTP/S, HTTP/S, SSH/Bash, SFTP, Windows/SMB, TFTP
The sensor loads data from a file or URL using one of the predefined file formats (including custom formats). It can alert on retrieved metrics and status values.
Available alerts:
- Alert on Monitoring Sensor counter
- File does not exist
- File exists
- File modified
- File is empty
- File is not empty
- File access error
- Authentication error
- Connection error
- File has not been updated within a given time range (file age)
- File updated too often (file age)
- File read error
Supported File Formats
Native Data Formats
NetCrunch can receive counters and status objects at once. It supports JSON and XML formats that allow passing both counters and statuses, and additionally, it supports a rather simplistic CSV format for counter metrics.
Custom Data Formats
You can make NetCrunch understand any format using Data Parsers, allowing parsing and analyzing external data. The result is always a list of counters and status objects.
See Data Parsers
Custom Data Parsers
Data Parsers transform and analyze external data, returning NetCrunch counter metrics and status objects.
Data parsers transform external data into NetCrunch's internal format, describing counters and status objects. Several sensors can use Data Parser to retrieve this data from external sources.
XPath/DOM Data Parser
You can define a list of counters and status objects, along with their respective paths. You can use either XPath or CSS selectors, whichever you prefer. While CSS selectors are typically used to select DOM nodes, we have extended the syntax to include attribute names by adding a '|' pipe character after the selector.
Example
<doc>
   <amount>10.2</amount>
   <user name="John" age="123"/>
</doc>
Selectors
- To get Amount you can use XPath selector
//doc/amountor DOM selectordoc > amount - To get John's age, you can select it by
//doc/user[@name='John']/@ageor by the extended DOM selectordoc > user[name='John'] | age.

JSONPath
JSONPath is similar to XPath in that it offers many of the same capabilities. For simple paths, you can use simple dotted paths.
Example
{
  "main" : {
      "temperature" : 10.2,
      "humidity" : 66
  }
}
This is a simple example, but very similar to the actual data provided by one of the public weather APIs.
- Temperature can be selected by simply
main.temperature - For Humidity we can use JSONPath
$..humidity

JavaScript Data Parser
JavaScript is a good solution for parsing data, as you can use regular expressions and the whole power of the JavaScript engine (V8), which implements the latest ECMAScript language standard.
Your script runs in strict mode in a separate, sandboxed Node.js environment and is killed if it exceeds the time limit. In addition to the regular runtime (which doesn't support loading any external modules), we provided the most useful utilities for parsing JSON, XML, and HTML.
Test Console
The Data Parser editor is a small development environment that lets you test a script by running it in the actual NetCrunch scripting engine. You can provide test data and use console objects to log messages to the test console.
Script Parameters and The Result
Your script receives two parameters:
- data - it contains input data. It can be text as a buffer object. It depends on the data type you expect from the source.
- result - script result object that simplifies providing a list of counters and status objects.
Counters
The counter metric represents numerical values observed by NetCrunch. This is one of the fundamental building blocks of NetCrunch. The counter path describes:
- Object - if left blank, the sensor identification will be used as the object. It describes the measured subject. The programming term describes the class of the measured subject. For example, Process, Disk.
- Counter - The name of the metric. For example, Temperature, % Utilization%.
- Instance—identifies the object's instance. It's optional, so it can be a disk ID, process name, etc.
Counter Path Format
<Object>/<Counter>.<Instance>
Examples
Process/% Processor Utilization.NCServer.exe
Website/Current Visitors
Status Objects
The Status Object describes the state of the monitored object. It can be simply a string or more complex data. Unlike for counters, there are no special requirements for the status object name.
Well-known status values:
- unknown
- ok
- warning
- error
Complex Status Object
           "Disk C:" : {
                         "value" : "ok",
                         "message" : "Working fine",
                         "retain" : 5,
                         "critical": true,
                         "data" : {
                            "type" : "SDD",
                            "upTimeSec" : 123431
                          }
            }
The status object can contain fields such as:
-
Value - a status value that can be any string, but if one of the standard values is used, NetCrunch will use the value for calculation alert conditions. The field is required to recognize the status object. Otherwise, the whole object will be treated as a text string. Standard values are: ok, error, warning, disabled, unknown.
-
Name - a name for the object; it does not have to be unique. (optional)
- Message - this can be a message describing the state (for example, an error message). (optional)
- Received - a time when the status has been read. (optional)
- Retain - how long will the status be valid if no new status is received after it becomes unknown?
- Class - status class. If specified status history will be saved to the database. The class helps UI understand data associated with the status and display it appropriately.
- Data - custom data. It can be any JSON object, except that if class points to a well-known class, it must conform to the class data format.
Providing Result
All result functions can be chained.
result.counter('Value', 10).counter('Value 2', 20);
result.counter(path,value)
Add counter value to the sensor result.
result.counter('% Utilization', 23.5);
result.counter(obj)
You can add multiple counters as a single object.
 result.counter( {
    "Temperature" : 33,
    "Humidity" : 65
 });
result.status(name,value[,message])
Set the status of the object:
result.status('Door 1', 'closed' ).status('Door 2', 'opened');
result.status(obj)
Set complex status object.
 result.status('Light 1', {
   value : 'ok',
   data : {
     color: 'red'
     switchedOn : "2021-03-11T22:20:59.903Z"
  }
result.error(message)
You can set the '@parser' status object to change the sensor status to critical. This way, if the data are not what you expect, you can pass the error to the sensor.
result.error('Missing section')
result.warning(message)
Use it to change the sensor status to 'warning'.
Examples
We assume you are familiar with ES6. You can use the older syntax, as JavaScript is backward-compatible.
Simple
It uses one of the simplest data-encoding formats. It's just a series of values without names, separated by a comma.
Test Data
10.2, 30, 100
Script
data.split(',').forEach((value,ix) => result.counter(`Value ${ix}`, value));

Parsing XML/HTML data
As JavaScript does not natively offer an XML parser, we added one. You can use XPath and CSS selectors to select elements or attributes.
Simple XML document
NetCrunch includes a DOM parser. You can use it at a low level (please refer to xmldom.js on the Internet) via the DOMParser constructor or a convenient DOM class we provided.
DOM
doc.nodes(xpath)
Returns all elements matching the given XPath.
Example
  <doc>
      <value name="Temp">10.2</value>
      <value name="Fan Speed">100.2</value>
   </doc>
Script
   const doc = new DOM(data);
   doc
       .nodes('//value')
       .map(e => ([e.getAttribute('name'), e.firstChild.data ])
       .forEach(([name,value]) => result.counter(name, value));
The script above will return all values with proper names as counters.
doc.selectByXPath(path)
Returns values of elements matching the path.
doc.valueByXPath(path)
Returns a single (first) value regardless of the number of matching elements.
valueByCSS(path)
converts the CSS selector into XPath and calls valueByXPath to retrieve a single value. To select an attribute value, add the attribute name after the pipe |.
For example:
val[name='Temperature'] | value
Allows you to select the value from the following element:
<val name="Temperature" value="23.5"></val>
cssToXPath(selector)
This function converts a CSS selector to an XPath. To select an attribute value, you can append the attribute name after the pipe separator.
For example:
val[device='Fan'] | rpm
DOM parser can also be used to parse HTML documents, even if they do not conform to XML.
Data
<doc>
   <value1>13.10</value1>
   <value2>345</value2>
</doc>
Script
 const doc = new DOM(data);
 result
    .counter('Values/Value 1',  doc.valueByXPath('//value1'))
    .counter('Values/Value 2',  doc.valueByXPath('//value2'));

CSS Selectors
You can also use familiar CSS selectors using doc.selectByCSS
doc.selectByCSS('value1')
Parsing JSON Data
JavaScript has a built-in JSON parser that converts JSON data into native JavaScript objects.
Your script can use two methods to access object attributes.
selectProperty(obj,path)
Select a property by a dotted path.
selectByJSONPath(obj,path)
Select the property element by JSONPath.
Example
Let's try to parse the data in a way similar to weather API services.
Data
{
  "main" : {
      "Temperature" : 22,
      "Humidity" : 66
  }
}
Script
   const doc = JSON.parse(data);
   result
       .counter('Temperature', selectProperty(doc, 'main.Temperature'))
       .counter('Humidity',   selectByJSONPath(doc, '$..Humidity'));

Python Data Parsers
The parser lets you write custom Python scripts (v. 3.11.0) to parse data from your sensors. In addition to the regular runtime (which doesn't support loading any external modules), we provided the most useful utilities for parsing JSON and XML. (JSON, ElementTree)
Test Console
The Data Parser editor is a small development environment that lets you test a script by running it in the actual NetCrunch scripting engine. You can provide test data and use console objects to log messages to the test console.
Script Parameters and The Result
Your script receives two parameters:
-
data - it contains input data. It can be text as a buffer object. It depends on the data type you expect from the source.
-
result - script result object that simplifies providing a list of counters and status objects.
Counters
The counter metric represents numerical values observed by NetCrunch. This is one of the fundamental building blocks of NetCrunch. The counter path describes:
-
Object - if left blank, the sensor identification will be used as the object. It describes the measured subject. The programming term describes the class of the measured subject—for example, Process, Disk.
-
Counter - The name of the metric. For example, Temperature, % Utilization%.
-
Instance - identifies an instance of the object. It's optional. So it can be a disk ID, a process name, etc.
Counter Path Format
<Object>/<Counter>.<Instance>
Examples
Process/% Processor Utilization.NCServer.exe
WebSite/Current Visitors
Status Objects
The status object describes the state of the monitored object. It can be a simple string or more complex data. Unlike for counters, there are no special requirements for the status object name.
Well-known status values:
- unknown
- ok
- warning
- error
Complex Status Object
"Disk C:" : {
               "value" : "ok",
                "message" : "Working fine",
                "retain" : 5,
                "critical": True,
                "data" : {
                    "type" : "SDD",
                    "upTimeSec" : 123431

                  }
    }
The status object can contain fields such as:
-
Value - a status value that can be any string, but if one of the standard values is used, NetCrunch will be able to use the value for calculation alert conditions. The field is required to recognize the status object; otherwise, the whole object will be treated as a text string. Standard values are: ok, error, warning, disabled, unknown.
-
Name - a name for the object; it does not have to be unique. (optional)
-
Message - this can be a message describing the state (for example, an error message). (optional)
-
Received - a time when the status has been read. (optional)
-
Retain - how long the status will be valid if no new status is received. After this time, the status becomes unknown.
-
Class - status class. If specified status history will be saved to the database. The class helps UI understand data associated with the status and display it appropriately.
-
Data - custom data. It can be any Dictionary object, except that if the class points to one of the well-known classes, it must conform to the class data format.
Providing Result
All result functions can be chained.
result.counter(path,value)
result.counter('Value', 10).counter('Value 2', 20)
Add counter value to sensor result.
result.counter(obj)
result.counter('% Utilization', 23.5)
You can add multiple counters as a single object.
result.counter( {
    "Temperature" : 33,
    "Humidity" : 65
 })
Simply set the status of the object
result.status(obj)
result.status(name,value[,message])
result.status('Door 1', 'closed' ).status('Door 2', 'opened')
Set complex status object
result.status('Light 1', {
   "value" : 'ok',
   "data" : {
     "color": 'red'
     "switchedOn" : "2021-03-11T22:20:59.903Z"
  }
You can set the '@parser' status object to change the sensor status to critical. This way, if the data is not what you expect, you can pass the error to the sensor
result.error(message)
result.error('Missing section')
Examples
Test Data
10, 15, 4.5
Script
for id, val in enumerate(data.split(', ')):
  result.counter('Value ' + str(id), float(val))
Exceptions
Scripts that are using 'import', 'exec', 'eval', or 'compile' are not allowed.
Sensors Using Data Parsers
Data File Sensor
This sensor can retrieve data from various sources, such as:
- Windows File
- HTTP/S (file or page)
- FTP/S
- SSH (SFTP or Bash)
Scripting Sensors
You can run scripts on the NetCrunch Server machine or remotely via SSH on a target machine.
Read more...
Data Sensor
The Data Sensor allows receiving data from an external source (agent). Data can be sent as JSON (native NetCrunch format) and in any other format that can be transformed using NetCrunch Data Parser.
Read more...
REST HTTP
It can send an HTTP request, including custom requests with URL query parameters. It also allows setting custom request headers and cookies. In combination with Data Parser, it can retrieve data from any external source.
Read more...
Text Parsers (Text Parsing Expressions)
Text Parsers extract named variables from incoming text logs and text messages so they can be filtered, correlated, and evaluated in alerting rules.
Purpose and Scope
Text Parsers are designed for parsing textual input, such as logs or external text messages, and transforming them into a set of named variables (key value pairs).
These variables can then be: - used in filters - referenced in alert conditions - evaluated as counters or status-like values
Text Parsers do not generate counters or status objects directly.
Their sole output is a list of extracted variables.
Parser Categories in UI
In the NetCrunch UI, Text Parsers are organized into two independent sections:
-
Text Log Parsers
Used for parsing log entries coming from log monitoring sources. -
Text Message Parsers
Used for parsing externally received text messages, such as emails or custom text inputs.
Both categories work identically in terms of parsing logic and outputs, but are applied to different data sources.
This is fundamentally different from Data Parsers, which process structured external data and output counters and status objects. Data Parsers are described separately in the Data Parsers chapter.
Parsing Expressions
Each parsing expression: - processes a single text input - declares a fixed list of output variables - assigns values to these variables based on parsing rules
Only declared variables can be produced and later used in filters.
Comma Separated Values
This is the simplest parsing format.
- Variable names describe each column
- The default separator is a comma

Key Value Pairs
This format parses text encoded as key value pairs separated by two delimiters.
Example:
from:John;val:10
Configuration:
- Pair Separator: ;
- Value Separator: :
INI-like Encoding Example
speed = 10
acceleration = 0
Configuration:
- Pair Separator: \n
- Value Separator: =
Regular Expression
Regular expressions allow advanced pattern matching.
- NetCrunch uses JavaScript-compatible regular expressions
- Variables are matched by the order of capturing groups
Example – Log4J Log Format
Pattern:
(\d{4}-\d{2}-\d{2}) (\d{2}:\d{2}:\d{2},\d{3}) (.∗?)(.∗?) ([^ ]) +([^ ]) - (.*)$
Mapped variables: - Date - Time - Thread - Severity - Module - Message
Apache Common Log Format
This parser decodes Apache logs using the Common Log Format.
You only need to provide the format string used in the Apache configuration.

Refer to Apache documentation:
https://httpd.apache.org/docs/2.4/logs.html#common
XPath and DOM Selectors
Text Parsers support XML extraction using XPath.
Only paths returning single values are supported.
Example XML
<doc>
    <amount>10.2</amount>
    <user name="John" id="123"/>
</doc>
Extractable paths:
- /doc/amount
- //user/@name
- //user/@id
Conditional Selectors
You can select nodes conditionally:
/doc/user[@id='123']/@name
DOM Selectors
XPath expressions also support DOM (CSS-like) selectors.
To extract attributes, NetCrunch extends CSS syntax using the | character.
Equivalent selectors:
- doc > amount
- user|name
- user|id

JSON Path
Text Parsers support JSON Path expressions.
Only paths returning single values are supported.
Example JSON
{
  "doc": {
    "amount": 22,
    "user": {
      "name": "John",
      "id": 100
    }
  }
}
Extractable paths:
- $.doc.amount
- $..user.name
- $..user.id

JavaScript Parser
JavaScript provides full flexibility for text parsing.
- Uses a sandboxed NodeJS (V8) engine
- Executes in strict mode
- Automatically terminated on timeout
Input
The input text is available in the text variable.
Output
The script must assign an object to the result variable.
Its properties must match declared parser variables.
Example
Test Text
{
  "probe_1": {
    "temp": 10
  }
}
Variables
- Temperature
Script
// Parse input data const data = JSON.parse(text);// Assign parser output result = { temperature: data.probe_1.temp };
Python Parser
Python parsers allow custom parsing logic using Python 3.7.
- No external modules can be loaded
- Built-in support for JSON and XML parsing is provided
Input
The input text is available in the text variable.
Output
The script must populate the result dictionary with declared variables.
Example
Test Text
{
  "probe_1": {
    "temp": 10
  }
}
Variables
- Temperature
Script
data = json.loads(text)result['temperature'] = data['probe_1']['temp']
Telemetry in NetCrunch
Telemetry enables systems to push metrics and logs into NetCrunch without polling. This topic explains when to use telemetry and how NetCrunch supports it via Telemetry Nodes and the OTLP cloud gateway.
What Is Telemetry?
Telemetry is the process of automatically collecting measurements from remote systems and sending them to a central monitoring platform. Unlike traditional polling (e.g., SNMP, WMI), telemetry:
- Is pushed from the source instead of pulled by the server
- Supports real-time streaming of data
- Is ideal for cloud-native, distributed, or event-driven systems
When to Use Telemetry
Telemetry is the right choice when:
- You have systems without direct network visibility (e.g., behind NAT or firewall)
- You want faster alerting or metric freshness
- You’re collecting data from serverless apps, containers, or CI/CD pipelines
- You want to integrate with OpenTelemetry agents, SDKs, or exporters
How NetCrunch Supports Telemetry
NetCrunch implements telemetry collection using two key mechanisms:
1. Telemetry Node
A virtual node type that is used to represent any data endpoint that sends data via REST.
- Anchors incoming metrics or status objects
- Supports JSON/form data payloads
- Accepts data via local REST API or cloud relay endpoint
- Stores received values as counters or alert statuses
- Requires no IP address or discovery
2. OpenTelemetry Gateway (Cloud-Based)
NetCrunch offers native support for OTLP (OpenTelemetry Protocol) for receiving telemetry from OpenTelemetry-compatible agents or exporters.
Supported Endpoints
-
Logs:
https://otlp.netcrunch.io/v1/[serverId]@[sensorId]@[nodeId]/logs -
Metrics:
https://otlp.netcrunch.io/v1/[serverId]@[sensorId]@[nodeId]/metrics
Traces are not currently supported.
How Logs Are Processed
- Received as NetCrunch alerts (with no active state)
- All logs match the default Any Event rule unless filtered
- To filter logs, use the rule:
Event for Received Telemetry Event - Key log fields become alert parameters:
| OTLP Field | Mapped to NetCrunch Parameter |
|---|---|
| log body | message |
| service name | description (if available) |
| attributes | Additional parameters |
How Metrics Are Processed
OTLP metrics are converted to NetCrunch counters using a standardized path model:
| OTLP Metric Element | NetCrunch Counter Path Segment |
|---|---|
| Service or scope name | Object |
| Metric name | Counter |
| Attributes | Instance (joined key=value CSV) |
- Metrics are stored as standard counters
- Description and unit will be added to metadata (feature in progress)
Histogram Support
Histograms will be supported in the future and stored in a dedicated high-volume time-series database.
Currently: not yet implemented.
Summary
Telemetry in NetCrunch enables modern, scalable monitoring for dynamic environments. Whether through the lightweight Telemetry Node or OTLP integration, you can now collect rich logs and metrics from virtually any platform, without needing traditional polling.
- Telemetry Node
A Telemetry Node is a NetCrunch node type for receiving metrics, statuses, and events from external systems via REST or OTLP. It anchors telemetry data for cloud, IoT, or custom systems, and replaces the older REST Receiver with a unified, event-capable design.
- NetCrunch Databases
NetCrunch uses several specialized databases to efficiently manage configuration, event history, real-time status, long-term metrics, and documentation. Each database is optimized for its specific role in the monitoring platform, allowing NetCrunch to scale from hundreds to thousands of nodes while ensuring high performance.
Telemetry Node
A Telemetry Node is a NetCrunch node type for receiving metrics, statuses, and events from external systems via REST or OTLP. It anchors telemetry data for cloud, IoT, or custom systems, and replaces the older REST Receiver with a unified, event-capable design.
Overview
In NetCrunch, every monitoring object must be tied to a node. The Telemetry Node is purpose-built for ingesting external metrics, statuses, and events—ideal for workloads and devices that cannot be polled or exist outside the direct network (e.g., cloud, scripts, IoT, embedded).
Common uses:
- Remote or embedded systems
- Cloud applications & APIs
- IoT/headless devices
- Apps/scripts pushing telemetry
How to Add a Telemetry Node
- Click the Add (+) button at the top of the NetCrunch UI.
- In the popup menu, select:
Telemetry Node - Enter the desired node name and choose data retention time.
- Confirm. NetCrunch assigns a
nodeIdand creates the default Telemetry Sensor (sensorId).
The sensor is always created and cannot be removed, only disabled.
Node Type Transition
- The REST Receiver node type is now deprecated and replaced by Telemetry Node.
-
Telemetry Node:
- Supports event ingestion
- Uses
sensorIdas the main identifier (not justnodeId) - Sensors are auto-added (can be disabled but not deleted)
- Legacy REST Receivers still work but are superseded
Supported Input Protocols
| Protocol | Endpoint Type | Data Format |
|---|---|---|
| REST (JSON) | Local/Cloud REST | NetCrunch JSON |
| OTLP | OTLP Gateway | OpenTelemetry (HTTP/gRPC) |
All data is routed to the Telemetry Node Sensor (nodeId + sensorId).
REST Endpoints
- Local REST:
https://<nc-server>/api/rest/1/sensors/<sensorId>@<nodeId>/update - Cloud REST:
https://gw.netcrunch.io/tm/v1/<serverId>@<sensorId>@<nodeId>/update
Example Payload
{
  "counters": { "system/cpu.load": 0.75 },
  "statuses": {
    "uptime": {
      "value": "ok",
      "data": { "statusCode": 1 },
      "message": "System running for 3 days"
    }
  }
}
OTLP Gateway (OpenTelemetry)
- Metrics:
https://otlp.netcrunch.io/v1/<serverId>@<sensorId>@<nodeId>/metrics - Logs:
https://otlp.netcrunch.io/v1/<serverId>@<sensorId>@<nodeId>/logs
| Aspect | REST Endpoint | OTLP Gateway |
|---|---|---|
| Format | NetCrunch JSON | OTLP Metrics/Logs |
| Protocol | HTTPS (JSON) | HTTP/HTTPS (OTLP JSON/Binary) |
| URL | gw.netcrunch.io |
otlp.netcrunch.io |
| Processing | Direct ingestion | Translated to internal format |
Notes:
- Traces not supported.
- Logs = non-active alerts. Metrics = counters.
- Histogram support planned.
Event Ingestion Endpoints: Telemetry Node vs Web Message Sensor
Important: The endpoint for sending events is different for Telemetry Nodes compared to classic Web Message Sensors. Using the wrong endpoint means events will not be processed.
Telemetry Node Event Endpoint
For Telemetry Nodes, events must be sent to the sensor endpoint:
https://<nc-server>/api/rest/1/sensors/<sensorId>@<nodeId>/event
- The event is linked to the specific sensor (
sensorId) created for the Telemetry Node. - This is required for all Telemetry Node event alerts to work.
Web Message Sensor (Legacy) Event Endpoint
For legacy Web Message Sensors (non-telemetry), events must be sent to the node endpoint:
https://<nc-server>/api/rest/1/node/<nodeId>/event
- The event is linked directly to the node (
nodeId).
Why This Matters
- Telemetry Node: expects events by
sensorId. - Web Message Sensor: expects events by
nodeId.
If you send events for a Telemetry Node to the node/<nodeId>/event endpoint, they will not be processed.
Quick Reference
| Node Type | Correct Endpoint |
|---|---|
| Telemetry Node | https://<nc-server>/api/rest/1/sensors/<sensorId>/event |
| Web Message Sensor | https://<nc-server>/api/rest/1/node/<nodeId>/event |
Always use the
sensorIdendpoint for Telemetry Nodes; usenodeIdonly for classic Web Message Sensors.
Sending Data – Examples
Cloud REST Update
curl -X POST https://gw.netcrunch.io/tm/v1/SRV-1@sensor42@node91/update \
  -H "Content-Type: application/json" \
  -d '{"counters":{"system/disk.freeMB":12800},"statuses":{"system/fan":{"value":"ok","message":"normal"}}}'
Local REST Event
curl -X POST https://<nc-server>/api/rest/1/sensors/sensor42/event \
  -H "Content-Type: application/json" \
  -d '{"message": "failed login"}'
- Event fields:
message,description,attributes(additional params like user, time, etc.)
Alerting on Events
- Event alerts support filtering on event fields.
- Empty filter = match all.
Empty filters match all events. Applies to both Telemetry Node and Web Message sensors.
Node Behavior & Monitoring
- Telemetry Node anchors all incoming metrics, statuses, and events
- Supports dashboards, alerting, and historical data
- Can receive Monitoring Packs and policies
- Appears in topology views (unless hidden)
Summary
Telemetry Nodes deliver a push-based model for observability—ideal for remote/cloud/IoT data, with robust REST and OTLP support and direct event ingestion. They simplify integrating external or serverless systems with NetCrunch monitoring.
- What Is a Node in NetCrunch?
This topic explains the definition of a Node in NetCrunch. It clarifies why a Node is treated as a service endpoint rather than a physical device, and how this distinction improves monitoring accuracy for modern infrastructure.
- - deleted - Understanding NetCrunch Data Formats
- Monitoring External Sources
How NetCrunch monitors data originating outside built-in collectors using telemetry, scripts, files, and external APIs.
- NetCrunch Native Data Formats
Native payload formats used by NetCrunch to ingest external monitoring data as counters, statuses, and contextual data objects using JSON, XML, and CSV.
- Telemetry in NetCrunch
Telemetry enables systems to push metrics and logs into NetCrunch without polling. This topic explains when to use telemetry and how NetCrunch supports it via Telemetry Nodes and the OTLP cloud gateway.
Hardware Health Sensor (SNMP)
Monitors physical hardware sensors via SNMP, including temperature, fan speeds, power supply status, and voltage levels. Enables proactive detection of hardware issues and supports long-term tracking of system health trends.
Overview
The Hardware Health Sensor (SNMP) reads data from physical monitoring components exposed through the ENTITY-SENSOR-MIB. It provides real-time visibility into hardware performance and reliability, allowing administrators to identify issues such as overheating, fan failure, or unstable power conditions before they lead to system downtime.
This sensor is particularly useful for monitoring servers, switches, and other network appliances equipped with onboard environmental sensors.
Requirements
- The monitored device must implement the ENTITY-SENSOR-MIB.
- SNMP must be enabled on the device.
- Valid SNMP credentials (community string or SNMPv3 credentials) are required.
Options
- SNMP Credentials — specify the correct SNMP profile (v1, v2c, or v3) for the device.
- Polling Interval — defines how often sensor data is collected (defaults to the device profile).
Metrics Collected
The sensor automatically retrieves all available hardware readings exposed through SNMP, including:
- Temperature sensors (e.g., CPU, chassis, power supply)
- Fan speeds (RPM)
- Voltage levels
- Power supply status and health
- Other environmental readings defined by the ENTITY-SENSOR-MIB
Collected values are automatically classified and displayed in the hardware health summary, enabling quick identification of abnormal conditions.
Alerts
By default, the sensor raises alerts when:
- Any monitored hardware component reports a failure or critical status.
- Measured values exceed thresholds defined in the device’s MIB or in custom alerting rules.
Administrators can customize alert conditions, severity, and response actions based on operational needs.
Reports and Trend Data
All collected values are stored in the trend database, allowing long-term visualization and reporting through the Trend Viewer.
Reports include:
- Temperature trends per component
- Fan speed variations
- Power and voltage stability reports
- Sensor availability and failure statistics
These insights help detect gradual degradation and predict potential hardware failures.
Use Cases
- Monitoring server room hardware for early signs of overheating.
- Tracking fan degradation across blade chassis or network switches.
- Ensuring consistent power delivery and voltage stability in routers and UPS devices.
- Establishing environmental baselines for predictive maintenance.
Related
- Cisco Hardware Health (SNMP) — monitoring pack for Cisco devices
- Generic UPS (SNMP) — monitoring pack for uninterruptible power supply units
Monitoring SNI SSL Certificates
This topic explains how to monitor multiple SSL certificates on a single IP address (SNI) by treating each domain as a separate Node in NetCrunch, and how to accurately aggregate their status using a Composite Status Node.
The Core Problem: One IP, Many Certificates
Modern web servers (like IIS, NGINX, or Apache) often host dozens of websites on a single IP address using Server Name Indication (SNI).
If you add the web server to NetCrunch as a single "Device Node" (e.g., by its IP 192.168.1.50), you generally can only monitor the default SSL certificate. You cannot easily monitor the specific certificates for example.com, shop.example.com, and blog.example.com if they are all hosted on the same IP.
The NetCrunch Solution: Domain-Based Nodes
To monitor SNI certificates correctly, you must follow the Node = Service Endpoint principle.
Instead of adding the server once, you add a separate Node for each domain you want to monitor.
How it works
- Node A:
www.example.com(Resolves to1.2.3.4) - Node B:
shop.example.com(Resolves to1.2.3.4) - Node C:
blog.example.com(Resolves to1.2.3.4)
Even though all three resolve to the same IP address, NetCrunch treats them as distinct entities. When the SSL Sensor on "Node A" connects, it specifically requests the certificate for www.example.com during the TLS handshake (SNI), ensuring the correct certificate is validated.
Configuration Guidelines
1. One Domain = One Node
Create a separate node for every domain name you wish to verify.
- Do not try to stack multiple SNI checks for different domains onto a single node.
- Naming: Name the node exactly as the domain (e.g.,
client-portal.com). This makes it easy to identify which certificate is expiring in alerts.
2. The SSL Certificate Sensor
The sensor automatically uses the Node's name as the SNI parameter.
- Connection: It connects to the resolved IP but sends the Node Name in the Client Hello.
- Validation: It checks the specific certificate returned for that hostname (Issuer, Expiry, Revocation).
- Ports: You can add multiple sensors to one node if the same domain uses multiple ports (e.g.,
443and8443).
3. Ignoring the "Device"
Since these nodes represent virtual services, you usually do not need to monitor the underlying hardware on these specific nodes.
- Tip: You can disable "Infrastructure Services" (like Ping or SNMP) on these SNI nodes to avoid redundant alerts if the underlying server goes down. Keep the hardware monitoring on the main "Device Node."
Summary of Architecture
| Monitoring Goal | Node Strategy |
|---|---|
| Physical Server Health | Create one Node by IP or Hostname. Monitor CPU, RAM, and Disk. |
| SNI / Virtual Hosts | Create multiple Nodes (one per URL). Monitor SSL, HTTP, & Application health. |
Aggregating Health: The Composite Status Node
Because standard folder status may not accurately reflect specific sensor errors (depending on your version configuration), the reliable method to group these checks is using a Composite Status Node.
How to Configure
- Create Node: Add a new node of type Composite Status. Name it "Global SSL Status".
- Monitoring: In the node settings, go to the Monitoring tab.
- Add to "Critical" Group: Click +Add next to the Critical section. Select the SSL Certificate sensors from your individual SNI nodes (Node A, Node B, Node C).
Choosing the Right Logic Group
For SSL monitoring, you should use the Critical group.
-
Critical: If any added object is Down/Warning, the Composite Node becomes Down/Warning.
- Use Case: Essential for certificates. If one expires, you need an immediate alert.
-
Redundant: The Composite Node only goes Down if all added objects are Down.
- Use Case: Clustered services where one failure is acceptable. (Not recommended for unique certificates.)
-
Influential: If an object is Down, the Composite Node only shows a Warning.
- Use Case: Low-priority items where a failure shouldn't trigger a full outage alert.
Benefits of this Model
- Precise Status: The status is derived strictly from the SSL sensors you added to the Critical list.
- Single Alert: You can configure alerts on the Composite Node to notify you if the node status changes, covering all contained certificates at once.

Server and Application Monitoring
Agentless monitoring of operating systems, virtualization, logs, applications, and services.
Application Monitoring
NetCrunch supports monitoring many applications by Monitoring Packs. It's also easy to create agents for sending data to NetCrunch.
Monitoring Windows Applications
NetCrunch contains predefined monitoring packs for common Windows applications.
- Exchange 2007-2010 Mailbox Access Server
- Monitor key Windows services and performance counters of the Mailbox Access Server.
- Exchange 2007 - 2010 Transport Access Server
- Monitor key Windows services and performance counters of the Transport Access Server, it contains SMTP availability report.
- Exchange 2013 Client Access Role
- Monitor key Windows services and performance counters of the Client Access Server. It contains reports about IMAP4, SMTP, UMCallRouter, and POP3.
- Exchange 2013 Mailbox Role
- Monitor key Windows services and performance counters of the Mailbox Access Server.
- Exchange 2016-2019
- Monitor key Windows services and performance counters of Exchange servers and related services
- IIS
- Monitor key IIS performance metrics such as ASP requests, IIS Private Bytes, and monitor the Windows event log for ASP, SMTP, and WWW errors.
- MS Dynamics NAV Server
- Monitor key Windows Services of the MS Dynamics NAV Server.
- MS Project Server 2013
- Monitor key Windows Services of the MS Project Server 2013.
- MS Project Server 2016
- Monitor key Windows Services of the MS Project Server 2016.
- MS SQL Server 2012-2019
- Monitor key performance metrics, Windows and Network Services, MS SQL event log warnings, and errors. It contains several reports such as:
Processor Bottleneck Analysis, Disk Usage and Performance, Memory Usage Analysis, MS SQL Server 2012-2017 CPU Performance, MS SQL Server 2012-2017 Memory, MS SQL Server 2012-2017 I/O Report - SharePoint 2010
- Watch the status of SharePoint Windows Services, the number of rejected requests, cache size, and the number of queued requests.
- SharePoint 2013
- Watch the status of SharePoint Windows Services, the number of rejected requests, cache size, and the number of queued requests.
- SharePoint 2016
- Watch the status of SharePoint Windows Services, the number of rejected requests, cache size, and the number of queued requests.
Invalid Reference @monitoring-packs:Symantec
Custom Monitoring
Using Windows Services and Counters
You can look at various Monitoring Packs defined in NetCrunch. Any other application can be monitored in a very similar way - if it supports perfmon counters; otherwise, you can rely on monitoring Windows services and processor and memory parameters for specific processes.
Using Scripts and Agents
This is another option for monitoring Windows applications and any other application, including the hosted remote application or even websites.
You can create a script, which will poll necessary information for NetCrunch, or modify the existing application to send REST requests to NetCrunch.
It doesn't involve much programming as you can use cUrl, an open-source project available for almost any platform.
You can find it at http://curl.haxx.se.
Read more about Sending Data to NetCrunch.
Managing Monitoring Credentials
To access monitored systems, NetCrunch needs valid credentials for each system. You can manage these credentials using profiles or set custom credentials for each node and system separately.
To maintain compatibility with previous versions, one default profile for each operating system is defined. You can create more profiles by pressing the plus button at the window's top right corner.
You can manage credentials used for connecting to monitored systems in Settings Monitoring Monitoring Credentials Manager
All credentials are stored securely on the NetCrunch Server, and the console can never retrieve passwords.
Operating System Monitoring
Read about monitoring Windows, macOS, Linux, BSD, Solaris, and ESXi systems.
NetCrunch monitors all operating systems without installing any agents. It's convenient but sometimes requires extra settings to be set on monitored systems.
Windows
Monitoring Windows computers without agents depends on two factors:
- Correct Windows setup – allowing remote access to the system and retrieving performance information.
- Setting
OS Monitoringin node properties – it must be enabled and set to Windows.
Secure and Credential-Aware Monitoring
NetCrunch is designed to monitor Windows systems securely. It:
- Uses Kerberos authentication when operating in Active Directory environments.
- Falls back to NTLM or local credentials if needed.
- Uses a combination of native Windows protocols (RPC, SMB) and WMI depending on the task and available access.
- Applies least-privilege credential use by supporting multiple credential profiles per node.
This ensures compatibility across Windows versions and deployments, even with strict domain policies.
Windows Setup for Monitoring
Windows is the most common desktop OS, but its security configuration can complicate monitoring. Many challenges are automatically resolved when systems operate in an AD domain.
Before enabling monitoring, review the detailed setup steps in the Windows Monitoring Setup topic. We also provide a shell script for configuring standalone systems.
What can be monitored
Windows monitoring includes Windows services, Event Logs, and performance counters. Additional insights are possible with WMI sensors for software, hotfixes, and hardware. You can explore example configurations in the available Monitoring Packs for Windows.
Enable Windows-specific monitoring via:
Node Settings Monitoring Windows
Windows Services
Windows Services monitoring tracks both service states and installation lifecycle.
NetCrunch observes and alerts on the following service states:
- Service is Running
- Service is Paused
- Service is Stopped
- Service is not Running
It also detects service installation or removal events, which are distinct from state changes:
- Service Installed – the service appeared in the system
- Service Uninstalled – the service disappeared from the system
These are treated as event-based alerts, not state-based ones. This distinction is important for software that installs new versions by uninstalling and reinstalling the service — where NetCrunch captures that transitional moment.
Alerts can be defined for:
- A specific service name
- Services matching a regular expression
- All services
Manual service inspection is available at:
Node Status Windows Windows Services
Config Sensors (Device Inventory)
NetCrunch provides a set of configuration sensors (formerly inventory monitor) for monitoring hardware and software configuration changes. Although Windows machines can be monitored with RPC, these sensors require access to WMI, so make sure WMI is enabled and not blocked on the destination machine.
Hardware (WMI)
Using this sensor, you can download and monitor for changes in the hardware configuration of Windows-based hosts. The hardware configuration includes information about the processor, memory, installed disks (storage), video (graphic card), and monitor.
Software (WMI)
The sensor collects information about installed software, including installation date, version, and vendor. It can notify you when new software is installed, uninstalled, or updated.
Hotfixes (WMI)
The sensor collects information about installed hotfixes. It can notify you when a hotfix is installed or uninstalled.
Windows Event Log
NetCrunch can monitor Event Log entries on a given computer. It does it with a WQL query that NetCrunch automatically builds upon your parameters. You can set up this monitoring by adding an alert to the Windows Event Log sensor in Node SettingsMonitoring. Many of the predefined Monitoring Packs also enable Event Log monitoring.
Specify the narrowest query possible. Windows Event Log entries are large, and monitoring all Windows Event Log entries, even on a relatively small number of computers, might overload the NetCruch Event Log database.
Hyper-V Monitoring
NetCrunch allows monitoring Hyper-V services, but you must configure the node to monitor Windows first as it runs on Windows. Then, NetCrunch automatically detects the system is running Hyper-V services and ads.
WMI Sensors
NetCrunch provides several WMI sensors that include executing custom query and monitoring processes, performance counters, or file shares.
Performance Counters
Windows offers many built-in performance counters, which the installed applications extend. NetCrunch allows the defining several types of Event Triggers for Counters on Windows counters. You can set up triggers by adding a new alert to a node or the Monitoring Pack. Settings Alerting & Notifications Monitoring Packs and Policies
Windows OS Monitoring Packs
There are several Monitoring Packs that you can use for monitoring different aspects of your Windows environment.
- Active Directory (automatic)
- Observe Replication and Service errors. Watch Active Directory services status. The operating System must be Windows Server. Monitored network services list contains LDAP, LDAPS
- Active Directory Signs of Compromise
- Monitors for security events signaling potential security breach related to security event pattern, replay attack or audit policy change that need to be investigated
- Basic Windows Monitoring (automatic)
- Provides basic workstation monitoring. Observe processor utilization, memory usage, and free disk space.
Operating System must be Windows Workstation.
Simplified Monitoring must be Disabled. - CPU (automatic)
- Observe CPU utilization.
- DHCP Server
- Observe the DHCP Server service, its errors, and warnings.
- Disk (automatic)
- Observe Windows Disk performance.
- Distributed File System (DFS)
- Observe Windows Event Log for specific DFSR warnings and errors.
- Distributed File System Replication (DFSR)
- Monitor the Windows event log for specific DFSR warnings and errors, and collect performance and capacity data of namespaces and replicated folders.
- DNS Server (automatic)
- Observe DNS errors. Watch DNS network service and Windows service status.
The operating System must be Windows Server.
The monitored network services list contains DNS. - End of Life (automatic)
- Observe Windows system End of Life status.
- Hyper-V Hypervisor
- Observe the overall processor utilization of the Hyper-V environment, and watch its Windows services' status and the Hypervisor state.
- Hyper-V/VM
- Track operational status, guest processor usage, guest memory, virtual processor usage, as well as any failure events.
- Memory (automatic)
- Observe system memory utilization.
- Network (automatic)
- Provides network utilization reports. Observes outbound traffic
- Network Services Health (automatic)
- Watch for DHCP, DNS, WINS, Remote Access, or other TCP/IP errors.
- Processes (Windows)
- It allows for collecting information for processes.
- Security Audit
- Watch for Account events, login, and password problems.
- Terminal Services
- Watch the number of Active and Inactive sessions.
- Windows Print Queue
- Monitor any print queue errors reported by the device.
- MSMQ - Window Message Queuing
- Monitors Windows message queue
- NVIDIA Quadro GPU Dedicated to NVIDIA Quadro graphic cards.
- Alerts about high GPU, Memory, and Bus usage. Shows metrics also from the Core Clock, Fan Speed, Temperature, and Power Consumption.
- RDP Services
- Monitors status of Windows Services related to RDP, additionally shows the number of sessions on a given machine.
- Basic Windows Authorization Monitoring
- Generating an alert in case of multiple failed login events happening over a short time, when a login attempt was made with explicit credentials or with special privileges assigned.
In specific cases, you may need to modify Windows security monitoring packs to prevent alert floods in environments with high numbers of privileged users' logons. - Basic Windows GPO Monitoring
- Tracking changes in Group/Domain/Authorization Policies, generating an alert when such an event occurs.
In specific cases, you may need to modify Windows security monitoring packs to prevent alert floods in environments with high numbers of privileged users' logons.
Windows Applications
- Exchange 2007-2010 Mailbox Access Server
- Monitor key Windows services and performance counters of the Mailbox Access Server.
- Exchange 2007 - 2010 Transport Access Server
- Monitor key Windows services and performance counters of the Transport Access Server, it contains SMTP availability report.
- Exchange 2013 Client Access Role
- Monitor key Windows services and performance counters of the Client Access Server. It contains reports about IMAP4, SMTP, UMCallRouter, and POP3.
- Exchange 2013 Mailbox Role
- Monitor key Windows services and performance counters of the Mailbox Access Server.
- Exchange 2016-2019
- Monitor key Windows services and performance counters of Exchange servers and related services
- IIS
- Monitor key IIS performance metrics such as ASP requests, IIS Private Bytes, and monitor the Windows event log for ASP, SMTP, and WWW errors.
- MS Dynamics NAV Server
- Monitor key Windows Services of the MS Dynamics NAV Server.
- MS Project Server 2013
- Monitor key Windows Services of the MS Project Server 2013.
- MS Project Server 2016
- Monitor key Windows Services of the MS Project Server 2016.
- MS SQL Server 2012-2019
- Monitor key performance metrics, Windows and Network Services, MS SQL event log warnings, and errors. It contains several reports such as:
Processor Bottleneck Analysis, Disk Usage and Performance, Memory Usage Analysis, MS SQL Server 2012-2017 CPU Performance, MS SQL Server 2012-2017 Memory, MS SQL Server 2012-2017 I/O Report - SharePoint 2010
- Watch the status of SharePoint Windows Services, the number of rejected requests, cache size, and the number of queued requests.
- SharePoint 2013
- Watch the status of SharePoint Windows Services, the number of rejected requests, cache size, and the number of queued requests.
- SharePoint 2016
- Watch the status of SharePoint Windows Services, the number of rejected requests, cache size, and the number of queued requests.
Actions
- Run Windows Program
- The program can be copied to and executed on the desired machine.
- Run Windows Script
- Run the script that can be copied to and executed on the desired machine by a given scripting host.
- Terminate Windows Process
- Terminates the process by its name.
- Start, Stop, Pause Windows Service
- Perform control action on a given service. (Specify service by its name or select from the list of running services).
Linux
list supported Linux systems and requirements
NetCrunch monitors Linux without agents using an SSH script, which is automatically copied to a remote machine.
Preparing Node for Linux Monitoring

-
Open Node Settings > Monitoring and enable OS monitoring by selecting Linux from the drop-down menu.
-
Now, you can see the parameters to monitor Linux. Enter SSH credentials unless you use default settings for Linux or add a new credentials profile.
Linux Monitoring Packs
Monitor the most important Linux performance indicators such as processor and memory utilization, free disk space, and available swap, and create a Linux Server Report.
- Linux Status (automatic)
- Observes connection and authentication errors of Linux monitor.
- CPU (automatic)
- Observe CPU utilization.
- Disk (automatic)
- Observe disk utilization, swap available, and the volumes' free space.
- Memory (automatic)
- Observe Available Memory.
- CPU (SNMP)
- It requires SNMP to be enabled. Observe CPU Load and % CPU Time.
- Disk (SNMP)
- It requires SNMP to be enabled. Observe disk utilization, swap available, volumes' free space, and physical disk I/O operations.
- Memory (SNMP)
- It requires SNMP to be enabled. Observe system memory utilization.
- Network Traffic (Linux)
- It allows for collecting network traffic data.
- Processes (Linux)
- It allows for collecting information for processes.
Actions
- Run SSH Script
- Run script using SSH connection can be copied to and executed on the desired machine by a given scripting host.
Scripts
- Shutdown Linux Machine
- Reboot Linux Machine
- Restart Linux SNMP Daemon
- Mount CD-ROM
- Dismount CD-ROM
BSD
NetCrunch monitors BSD without agents using an SSH script, which is automatically copied to a remote machine.
After review copy Linux section and change on Linux to BSD, everything applies.
Monitoring Packs
Monitor the most important BSD performance indicators, such as processor and memory utilization, and free disk space, and create a BSD Report.
- BSD Status (automatic)
- Observes connection and authentication errors of BSD monitor.
- CPU (automatic)
- Observe CPU utilization.
- Disk (automatic)
- Observe disk utilization, and volume free space.
- Memory (automatic)
- Observe Available Memory.
- Network Traffic (BSD)
- It allows for collecting network traffic data.
- Processes (BSD)
- It allows for collecting information for processes.
Actions
- Run SSH Script
- Run script using SSH connection can be copied to and executed on the desired machine by a given scripting host.
Solaris
NetCrunch monitors Solaris without agents using only an SSH script, automatically uploaded to the remote machine.
Monitoring Packs
Monitor most important Solaris performance indicators such as processor and memory utilization, and free disk space, and create Solaris Report.
- Solaris Status (automatic)
- Tracks connection and authentication errors of Solaris monitor.
- CPU (automatic)
- Observe CPU utilization.
- Disk (automatic)
- Observe disk utilization, volumes' free space, and swap available
- Memory (automatic)
- Observe Available Memory
- Network Traffic (Solaris)
- It allows for collecting network traffic data.
- Processes (Solaris)
- It allows for collecting information for processes.
- Solaris (SNMP)
- It requires SNMP to be enabled. It monitors CPU Load, Load Check, Minimum Swap Space, and Swap Space.
Actions
- Run SSH Script
- Run script using SSH connection can be copied to and executed on the desired machine by a given scripting host.
macOS
NetCrunch monitors macOS without agents using only an SSH script, automatically uploaded to the remote machine.
Monitoring Packs
Monitor the most important macOS performance indicators. Such as processor and memory utilization, and free disk space, and then create a macOS Report.
- macOS Status (automatic)
- Observes connection and authentication errors of macOS monitor.
- CPU (automatic)
- Observe CPU utilization.
- Disk (automatic)
- Observe disk utilization and volume of free space.
- Memory (automatic)
- Observe Available Memory.
- Processes (macOS)
- It allows for collecting information for processes.
Actions
- Run SSH Script
- Run script using SSH connection can be copied to and executed on the desired machine by a given scripting host.
Other Operating Systems
VMware ESXi
NetCrunch supports direct monitoring of ESXi or using vCenter. Read more in VMware Monitoring.
Legacy Systems
IBM AIX and AS/400
IBM AIX and AS/400 systems can be monitored via SNMP.
IBM Monitoring Packs
- IBM IMM (SNMP)
- Monitors hardware parameters and health condition information related to the components of the system.
- IBM System x Disk (SNMP)
- Shows the status of the physical drive and volume.
- IBM System x System Health (SNMP)
- Monitors the health status of the memory and system. It also shows information about temperature, voltage, and fan speed.
Novell NetWare
As each NetWare system has a pre-installed SNMP agent, monitoring is possible using SNMP.
NetWare Monitoring Pack
Invalid Reference @monitoring-packs:NetWare
Monitoring Disk Parameters on Unix family systems
Read what disk performance metrics can be monitored on Linux, macOS, BSD, and Solaris.
Linux
Counters
-
Reads completed - The total number of reads completed successfully.
-
Reads merged - Reads adjacent to each other may be merged for efficiency. Thus two 4K reads may become one 8K read before it is ultimately handed to the disk, and so it will be counted (and queued) as only one I/O. This field lets you know how often this was done.
-
Sectors read - The total number of sectors read successfully.
-
Read Bytes - The total number of bytes read successfully.
-
Milliseconds spent reading - The total number of milliseconds spent by all reads (as measured from __make_request() to end_that_request_last()).
-
Writes completed - The total number of writes completed successfully.
-
Writes merged - Writes which are adjacent to each other may be merged for efficiency. Thus two 4K writes may become one 8K write before it is ultimately handed to the disk, and so it will be counted (and queued) as only one I/O. This field lets you know how often this was done.
- Sectors written - The total number of sectors written successfully.
- Write Bytes - The total number of bytes written successfully.
- Milliseconds spent writing - The total number of milliseconds spent by all writes (as measured from __make_request() to end_that_request_last()).
- I/Os currently in progress - The counter that should go to zero. Incremented as requests are given to appropriate struct request_queue and decremented as they finish.
- Milliseconds spent on I/Os - This counter increases so long as I/Os currently in progress is nonzero.
- Weighted milliseconds spent on I/Os - This counter is incremented at each I/O start, I/O completion, I/O merge, or read of these stats by the number of I/Os in progress I/Os currently in progress times the number of milliseconds spent doing I/O since the last update of this field. This can provide an easy measure of both I/O completion time and the backlog that may be accumulating.
- Transferred Bytes - The sum of Read Bytes and Write Bytes.
- Transferred sectors - The sum of Sectors read and Sectors written.
- Average requests size (Bytes) - The average size (in bytes) of the requests issued to the device.
Average queue length - The average queue length of the issued requests to the device. - Average time for I/O requests (ms) - The average time (in milliseconds) for I/O requests issued to the device to be served. This includes the time spent by requests in the queue and the time spent servicing them. - Average read requests time (ms) - The average time (in milliseconds) for reading requests issued to the device to be served. This includes the time spent by requests in the queue and the time spent servicing them. - Average write requests time (ms) - The average time (in milliseconds) for write requests issued to the device to be served. This includes the time spent by requests in the queue and the time spent servicing them.
Calculated counters
- Reads completed/sec - The total number of completed reads (requests).
- Writes completed/sec - The total number of writes completed (requests).
- Reads merged/sec - The total number of reads merged.
- Writes merged/sec - The total number of writes merged.
- Sectors read/sec - The total number of sectors read.
- Sectors written/sec - The total number of sectors written.
- Read Bytes/sec - The total number of bytes read successfully.
- Write Bytes/sec - The total number of bytes written successfully.
- Transferred Bytes/sec - The total number of bytes read and written.
- Transferred sectors/sec - The total number of sectors read and written.
macOS
Counters
- Completed I/Os - The sum of completed reads and writes.
- Transferred Bytes - The sum of bytes read and written.
Calculated counters
- The total number of completed I/Os/sec
- The total number of bytes read and wrote/sec
BSD, Free BSD, Net BSD, Open BSD
Supported BSD distributions
- FreeBSD: Reads completed, Read Bytes, Writes completed, Write Bytes, Completed I/Os, Transferred Bytes, Seconds spent on I/Os, Transactions queue length, Reads completed/sec, Writes completed/sec, Read Bytes/sec, Write Bytes/sec, Transferred Bytes/sec, Completed I/Os/sec
- NetBSD: Reads completed, Read Bytes, Writes completed, Write Bytes, Completed I/Os, Transferred Bytes, Seconds spent on I/Os, Reads completed/sec, Writes completed/sec, Read Bytes/sec, Write Bytes/sec, Transferred Bytes/sec, Completed I/Os/sec
- OpenBSD: Completed I/Os, Transferred Bytes, Seconds spent on I/Os, Transferred Bytes/sec, Completed I/Os/sec
Counters
- Reads completed - The total number of reads completed successfully.
- Read Bytes - The total number of bytes read successfully.
- Writes completed - The total number of writes completed successfully.
- Write Bytes - The total number of bytes written successfully.
- Completed I/Os - The sum of Reads completed and Writes completed.
- Transferred Bytes - The sum of Read Bytes and Write Bytes.
- Seconds spent on I/Os - The total number of seconds spent by all reads and writes.
- Transactions queue length.
Calculated counters
- Reads completed/sec - The total number of completed reads (requests).
- Writes completed/sec - The total number of writes completed (requests).
- Read Bytes/sec - The total number of bytes read successfully.
- Write Bytes/sec - The total number of bytes written successfully.
- Transferred Bytes/sec - The total number of bytes read and written.
- Completed I/Os/sec - The sum of Reads completed and Writes completed
Solaris
Solaris 10 and Solaris 11 are supported.
Counters
- Reads completed - The total number of reads completed successfully.
- Read Bytes - The total number of bytes read successfully.
- Writes completed - The total number of writes completed successfully.
- Write Bytes - The total number of bytes written successfully.
- Completed I/Os - The sum of Reads completed and Writes completed.
- Transferred Bytes - The sum of Read Bytes and Write Bytes.
- Elements in wait state.
- Elements in run state.
- I/Os currently in progress - The sum of Elements in wait state and Elements in run state.
- Milliseconds spent waiting - Cumulative wait (pre-service) time.
- Weighted milliseconds spent waiting - Cumulative wait length*time product.
- Milliseconds spent running - Cumulative run (service) time.
- Weighted milliseconds spent running - Cumulative run length*time product.
- Milliseconds spent on I/Os - The sum of Milliseconds spent waiting and Milliseconds spent running.
- Weighted milliseconds spent on I/Os - The sum of Weighted milliseconds spent waiting and Weighted milliseconds spent running.
- Soft errors - A disk sector fails the CRC check and needs to be re-read.
- Hard errors - Re-read fails several times for CRC check.
- Transport errors - Errors reported by I/O bus.
- Total errors - The sum of Soft errors, Hard errors and Transport errors.
- Average wait queue length.
- Average run queue length.
- Average transactions queue length - The average queue length of the requests issued to the device.
- Average wait time for I/O requests (ms).
- Average run time for I/O requests (ms).
- Average time for I/O requests (ms) - The average time (in milliseconds) for I/O requests issued to the device to be served.
- Average requests size (Bytes) - The average size (in bytes) of the requests issued to the device.
Calculated counters
- Reads completed/sec - The total number of completed reads (requests).
- Writes completed/sec - The total number of writes completed (requests).
- Completed I/Os/sec - The total number of completed IO requests.
- Read Bytes/sec - The total number of bytes read successfully.
- Write Bytes/sec - The total number of bytes written successfully.
- Transferred Bytes/sec - The total number of bytes read and written.
Windows Monitoring Setup
Reading this topic will make your Windows monitoring experience much better.
NetCrunch can monitor Microsoft Windows systems without installing additional agents. However, tightened security rules make remote monitoring possible only after the initial configuration, depending on your Windows environment.
MONITORING SERVER
NetCrunch Server can be installed on Windows Server 2016 or later. If you manage most of the servers by Active Directory, installing NetCrunch on a machine within an Active Directory domain is the better option. This method makes configuration much easier.
MONITORED SYSTEMS
SERVERS
Most server systems come with an enabled firewall, which blocks remote administration. It is the first step you need to take. It could be done either from Active Directory Group Policies or manually one by one. We suggest using a simple script.
Download it here: www.adremsoft.com/download/SetWinForNC.zip.
WORKSTATIONS
If you manage your workstations by Active Directory, preparing them for monitoring will be the same as for the servers (by Active Directory Group Policies or using the script).
Monitoring of workstations in Workgroups requires manual configuration. You can choose to use the built-in local Administrator account or create a new account and manually assign necessary rights directly to this monitoring account.
CONFIGURATION STEPS OVERVIEW
-
Setting Access Rights
NetCrunch needs a user account for monitoring that has proper access rights to DCOM, WMI (root\cimV2), and (Read Access) to the registry key (HKLM\SOFTWARE\Microsoft\Windows NT\CurrentVersion\Perflib. The easiest way (not the only one) you can do it is by adding this user to the local Administrators group. -
Setting Firewall Rules
Firewall rules must allow traffic of RPC, Performance Monitoring, Named Pipes, and WMI. - Enabling PerfMon monitoring
The Remote Registry service must be running, and its startup type should be Automatic.
CONFIGURING ACTIVE DIRECTORY DOMAIN
The procedure below requires a working knowledge of Active Directory Users and Computers and of the Group Policy Management Administrative Tools.
If you manage most of the servers by Active Directory, the best solution is installing NetCrunch on a server in the Active Directory domain and creating a dedicated user for monitoring. If you have not yet created such a user in your Active Directory, you should abort your NetCrunch installation now and configure your Active Directory first, allowing time for the user to propagate across your machines. You can start the NetCrunch installation again after your configuration has been propagated to all servers – it takes approximately 2 hours.
This is done for NetCrunch to discover all servers in the AD and automatically set up monitoring for them. Other servers in untrusted domains or workgroups can be configured separately (see Configuration of Separate Windows Server section below).
SETTING ACCESS RIGHTS
STEP 1 - CREATE USER FOR MONITORING
Create an Active Directory user account (for example, nc-mon-user) used by NetCrunch Server for monitoring. You will be asked later for this user's credentials during the NetCrunch installation.
STEP 2 - SET UP THE RIGHTS FOR THE USER
The user account needs administrative rights to all monitored Windows computers (including the server where NetCrunch Server is installed). There are two different ways to accomplish this, depending on your Active Directory architecture and your needs:
IF IN A SINGLE DOMAIN WHERE YOU WANT TO MONITOR ALL MACHINES
Create an Active Directory group (e.g., Monitoring Users) and add the previously created nc-mon-user account. Then use Group Policy to add that group to the local Administrators group on each monitored computer, using Restricted Groups.
IF MULTIPLE TRUSTED DOMAINS OR ONLY A SUBSET OF COMPUTERS NEEDS MONITORING
It would be best to use Group Policy to modify local Administrators' groups (on each monitored Windows machine).
a) Create an Active Directory group named Monitoring Users and add a previously created user account (nc-mon-user) to it.
In the multi-domain forest, the default Active Directory group scope (which is Global) should be sufficient for this group because global groups can assign permissions to resources in any domain in a forest.
b) Create a new Group Policy Object (GPO) and name it, for example, Local Administrators group membership for NetCrunch.
c) Create the rule for Monitoring Users' group membership.
Go to: Computer Configuration Policies Windows Settings Security Settings Restricted Groups
and add Monitoring Users to the local Administrators group using the section 'This group is a member of.'
d) Link the Local Administrators group membership for NetCrunch GPO to the appropriate Organization Unit(s) (OU) in your Active Directory domain(s).
SETTING FIREWALL RULES
-
Create a new Group Policy Object and name it, for example, "Windows Firewall rules for monitoring by NetCrunch."
For Windows Server 2016 or later, go to: Computer Configuration Policies Windows Settings Security Settings Windows Defender Firewall with Advanced Security and add these rules to Inbound Rules, choosing them from a predefined list: File and Printer Sharing, Windows Management Instrumentation (WMI-In), Remote Event Log Management, Performance Logs and Alerts. -
Link Windows Firewall rules for monitoring by NetCrunch GPO to the appropriate Organization Unit(s) (OU) in your Active Directory domain(s). For security reasons, it is recommended to customize remote administration rules to narrow the list of allowed IP addresses to the address of your NetCrunch Server only.
ENABLING PERFMON MONITORING
- Create a new Group Policy Object and name it, for example, Windows services for monitoring by NetCrunch.
- Setup Remote Registry service.
Go to: Computer Configuration Policies Windows Settings Security Settings System Services and set Remote Registry Windows service startup mode to Automatic. - Link Windows services for monitoring by NetCrunch GPO to appropriate Organization Unit(s)
(OU) in your Active Directory domain(s).
After the policy refresh, the service should start immediately on every computer.
By default, Windows built-in firewall doesn’t block outgoing traffic – if you have changed this behavior, add rules with the same names from the predefined list above to the Outbound Rules.
CONFIGURING OF SEPARATE WINDOWS SERVERS
SETTING ACCESS RIGHTS
Create nc-mon-user account using shell commands and add it to the local Administrators group.
net user /add nc-mon-user <Password>
net localgroup Administrators /add nc-mon-user
SETTING FIREWALL RULES
For Windows Server 2016 or later
you can create a rule for the IP address of the NetCrunch server only.
New-NetFirewallRule -DisplayName "NC-Mon-In" -Direction Inbound -RemoteAddress %IP% -Action Allow -Protocol TCP
New-NetFirewallRule -DisplayName "NC-Mon-Out" -Direction Outbound -RemoteAddress %IP% -Action Allow -Protocol TCP
ENABLING PERFMON MONITORING
Set up Remote Registry service startup and start the service.
Set-Service -Name RemoteRegistry -StartupType Automatic
Start-Service RemoteRegistry
DISABLING UAC REMOTE RESTRICTIONS
This step is no longer required for modern systems and has been removed in accordance with current best practices.
COMPLETE SCRIPT CAN BE DOWNLOADED FROM: this link
Summary of Technologies Used by NetCrunch
Windows technologies have been built layer by layer, one on top of another. For example, RPC is working on top of the Named Pipes, Remote Registry needs RPC, and WMI uses DCOM, which is also using RPC for communication. Everything needs proper settings of firewall and security settings. Here is the shortlist of technologies used by NetCrunch that need adequate configuration:
- RPC & Named Pipes – Needs enabling File Sharing, firewall settings
- Remote Registry – Needs firewall settings and Remote Registry service running
- WMI & DCOM – Needs Firewall settings, DCOM & WMI security settings
It is straightforward and fastest way to do when the user designated for monitoring is a member of the local Administrators group – as described in this document.
It is the simplest way to configure servers for monitoring, but not the most secure. When you need to tighten your security settings even more, setting up specific rights for the monitoring account is possible but may vary depending on your configuration. Please contact Microsoft support for help.
You may also contact AdRem support for an example of how other users NetCrunch users have modified their Windows Monitoring Setup.
Hyper-V Monitoring
Monitor summary of hypervisor services and state of virtual machines run by Hyper-V
Hyper-V Server
Hyper-V services run on Windows, so you must configure the node to monitor Windows first. Then, NetCrunch automatically detects the system is running Hyper-V services and ads Hyper-V Server Monitoring Packs, which tracks the state of Hyper-V services.
You can automatically add all Hyper-V guests to NetCrunch Atlas and alerts or collectors on Hyper-V metrics in the' Hyper-V' settings.
You can also go to Custom settings and add standard metrics visible through the perfmon Windows monitor.
In the Node Status window, you can see the state of all virtual machines located on a given server.
Virtual Machines
If you monitor Hyper-V servers, NetCrunch recognizes the machine running on the Hyper-V server and shows the additional information in the Node Status window.
You can also add various alerts regarding the state of the virtual machine and its guest performance metrics.
You can do this by clicking on Hyper-V/VM in the Node setting section.
Available State Alerts:
- Enabled state
- Health State
- Operational state
Available Counters:
- % Guest CPU Usages
- % Guest Memory Free
- % Guest Memory Usage
- % Host CPU Usage
- % Host Memory Usage
- Guest Assigned Bytes
- Guest Available Bytes
- Host Memory Bytes
- Uptime
Hyper-V Server View
The view gives you a quick overview of monitored Hyper-V hosts. When NetCrunch discovers any Hyper-V Server, it creates them automatically.
Hyper-V VM View
You can see all the information about all monitored Virtual Machines per map and on the Atlas level.
Guest Status is taken directly from Hyper-V; therefore, the machine that won't respond to any service check may be marked as 'down' while the guest status shows 'running.'
WMI Sensors
NetCrunch offers a collection of WMI sensors. Basic sensors are designated to serve specific purposes such as monitoring perfmon, process, shares, or time difference. The advanced sensor is more general and allows us to explore WMI classes or create custom WQL queries.
WMI sensors do not require a Windows OS monitor to be enabled on the node. In such a case, you must select an appropriate credential profile for each sensor.
Basic Sensors
These sensors don't require any knowledge about WMI or CIM. In particular, WMI Perform resembles the object names and counter names of the Perfmon.
wmi-perfmon
WMI Perfmon
WMI performance data comes from the perfmon provider, so we decided to use the same UI for WMI performance monitoring as perfmon. You don't need to use cryptic class names to get to the data. The sensor does this job. If you feel using class names is necessary, use the WMI Data sensor.
file-shares
File Shares
This sensor monitors the status of Windows Share. You can enter the share name manually or from the list.
process-group-summary
Process Group Summary Sensor
The sensor extends the Process sensor functionality by tracking multiple processes and using the wildcard (*) in the process name. It also supports monitoring child processes of a specified process when the Include child processes option is enabled, allowing you to view combined metrics for an entire process tree.
Selecting Processes by Name
You can specify multiple processes and separate them by commas. You can also use partial names using *. For example, 'nc*' will select all processes starting with 'nc'.
Include Child Processes
In addition to tracking top-level processes, the Include child processes option lets the sensor monitor all child processes spawned by a given parent process. This is particularly useful for monitoring services or applications that create multiple subprocesses or worker threads under distinct process identifiers.
Key Points:
- Automatic Child Detection: When Include child processes is enabled, the sensor recursively identifies child processes based on parent process ID relationships.
- Aggregated Metrics: Child processes are monitored alongside their parent, and performance data is aggregated, providing a single set of metrics for the entire process group hierarchy.
- Flexible Configuration: You can enable or disable Include child processes for any specified process name or pattern, allowing you to focus on what is most relevant to your environment.
Counters Tracked
When monitoring either individual or grouped processes (including child processes), the following counters are available:
- % Processor Utilization: The combined CPU usage for all selected processes.
- Handles: The total number of open handles, including those from child processes.
- Instances: The count of currently running process instances matched by the selection criteria.
- Memory Working Set (bytes): The sum of working set memory used by the parent, including child processes.
- Threads: The total number of threads across the process group.
- Virtual Bytes: The total virtual memory size utilized by the selected processes.
- Private Bytes: The total amount of memory allocated exclusively to the selected processes.
Note: Process names are case-insensitive in WMI.
By leveraging the ability to group processes and include their children, you gain a comprehensive view of resource usage and performance, simplifying monitoring complex applications and services that rely on multiple subprocesses.
process
Process Sensor
The Process Sensor allows you to monitor the health and performance of a specific process running on a target machine. By tracking various system resource counters, you can ensure that critical processes remain stable, efficient, and responsive over time.
Key Performance Counters
The sensor provides detailed insights into several performance metrics, including:
- % Processor Utilization: Shows the percentage of CPU time the process is consuming.
- Handles: Reflects the number of open handles (to system resources such as files, registry keys, etc.) that the process holds.
- Instances: Indicates how many instances of the monitored process are running.
- Memory Working Set (bytes): Represents the amount of memory currently used by the process.
- Threads: Displays the number of active threads within the process.
- Virtual Bytes: Identifies the process's total virtual memory.
- Private Bytes: Reports the process's total memory allocated.
These counters help you proactively detect unusual resource consumption, such as memory leaks, CPU spikes, or excessive handle usage, enabling timely troubleshooting and corrective action.
Process Identification Methods
When multiple processes share the same executable name or run with similar parameters, uniquely identifying the correct process instance is essential. The Process Sensor supports multiple identification methods to ensure accurate and reliable selection:
-
By Name:
Specify the process name (e.g.,chrome.exe) to monitor. The sensor will generate a monitoring issue by default if multiple instances are found unless further criteria are provided. -
By Name and Parameters (Regular Expression):
Combine the process name with command-line parameters to distinguish between different instances. A regular expression can be applied to the full process name (including extension) and its command-line arguments, helping you isolate a specific instance when multiple identical processes are running. -
By Command Line Regular Expression:
Instead of relying on the process name, use a regular expression directly on the command-line arguments. For instance, you might match a particular Java application instance by its unique JAR file name or a specific parameter that differentiates it from other JVM instances.
Ensuring Unique Identification
The sensor will report a monitoring issue if more than one process instance matches the specified criteria. This safeguard prevents ambiguous situations where the sensor cannot determine which process instance to track.
To avoid conflicts:
- Refine your regular expression to match a unique parameter.
- Use a more specific process name if possible.
- Assign a unique Sensor ID when relying on name-based matches. This step is beneficial if you need to monitor multiple similar processes and want to track each one as a distinct entity in your monitoring environment.
By leveraging these identification methods and tracking critical performance counters, the Process Sensor helps maintain stable and predictable operations, offering a clear path to identifying and resolving performance-related issues with key processes in your infrastructure.
ad-replication
AD Replication Sensor
This sensor checks a Windows Domain Controller for replication errors.
To use this sensor, add it to the machine, which is Domain Controller, and provide the credentials necessary to access the root\MicrosoftActiveDirectory namespace. The sensor shows one status per each one discovered AD partition.
Microsoft documentation about AD partitions
Statuses:
The total number of statuses depends on the Domain Controller configuration. Three statuses always occur:
- Domain Partition Replication Status
- Configuration Partition Replication Status
- Schema Partition Replication Status
Each status contains below data (properties):
- NumConsecutiveSyncFailures - number of consecutive sync failures
- IsDeletedSourceDsa - If the source is deleted
- TimeOfLastSyncAttempt - time of the last sync attempt
- LastSyncResult - result of the last sync
- TimeOfLastSyncSuccess - time of the last sync success
- ModifiedNumConsecutiveSyncFailures - number of modified consecutive sync failures
- ReplPendingOp:PositionInQ - number of pending replication operations
- DisableScheduledSync - If the scheduled sync is disabled
Default Alerts:
- "Alert on any partition replication error" - This alert will be generated if any status value changes to "Error," - which means replication has failed.
Credentials
You can use any credential that allows access to the root\MicrosoftActiveDirectory namespace. Administrative rights might be required.
pending-reboot
Pending Reboot Sensors
Check if the machine is waiting for a reboot because of the updates.
windows-updates
Windows Updates
The sensor monitors the status of Windows updates on a computer. Allows triggering an alert on a failed update.
registry
Registry Sensor
This sensor uses WMI to monitor Windows Registry objects specified by path.
The registry sensor alerts you when a subkey or value list is changed.
Possible alerts:
- Registry key does not exist
- The list of subkeys has changed
- The list of values has changed
- Specified subkey exists or does not exist
- Specified value exists or does not exist
- Alert on selected value content
registry-counters
Registry Counters Sensor
This sensor uses WMI to get and monitor numeric values from the Windows Registry.
- to the numeric value - the sensor returns one counter with this value
- to the key - each numeric value is an instance of the counter
This sensor can utilize thresholds in NetCrunch to monitor different scenarios:
- The port of the application saved in the registry should match exactly a given value by using a "Flat Value" event condition that is different from what is set in the alert
- Value of key that should be '0' and is set to '1' - this can be monitored by 'State trigger' as an event condition
remote-ping
Remote Ping
The sensor checks connectivity from a remote system by running Ping remotely.
It allows setting a threshold on the following counters:
- % Availability
- Response Time
time-difference
Time Difference
The sensor checks the time difference between a remote machine and the reference machine (NetCrunch Server or NTP server).
The sensor provides one counter, which is Difference sec.
wmi-hdd-health
WMI HDD Health
This sensor can monitor the HDD disk health state if the disk implements SMART technology, predicting disk failure.
It allows many counters, which depend on specific vendor implementation.
battery
WMI Battery
The sensor monitors the battery connected to the computer system. It can be a battery or any external battery (like UPS) connected to a computer.
Sensor alerts:
- When AC power is lost, the battery is discharged
- On battery hardware error
- When the battery level is low
windows-task-scheduler
Windows Task Scheduler Sensor
The sensor monitors the status of Windows Task Scheduler tasks. It allows triggering an alert if task configuration has changed or if a task was not run on time.
You can use various alerts to monitor tasks.
- task enable/disabled
- task configuration has changed
- The last task run has failed
- the task has not been run since the specified amount of time
Additional Info:
One sensor can monitor several tasks specified by name or regular expression.
iis-application-pool
IIS Application Pool
The sensor monitors the state and performance of the selected IIS Application Pool, providing insight into its operational status, resource utilization, and error conditions. This enables administrators to address issues proactively before they impact end-users.
Possible alerts:
- Application Pool is not running: Triggered if the monitored Application Pool becomes unavailable.
- The application pool has been restarted: Indicates that the pool was recently restarted, which may occur due to resource constraints, deployment changes, or configuration updates.
- Worker process failures: Alerts if worker processes (w3wp.exe) encounter errors or terminate unexpectedly.
- Alert on connection error: Notifies administrators if the Application Pool cannot accept or establish connections.
- Alert on authentication error: Indicates that client requests fail due to authentication issues.
Data Collector
IIS Application Pool Data Collector – This collector provides key performance counters and operational health metrics for the selected Application Pool. It includes:
- Worker Process Counts: Monitors the number of active worker processes, helping you understand resource allocation and concurrency.
- Worker Process Failures: Tracks the frequency of worker process crashes or failures, allowing early detection of problematic deployments or configuration settings.
- Basic Health Indicators: Gathers status information, including whether the Application Pool is currently started or stopped, enabling timely intervention when problems arise.
By leveraging these metrics, you can ensure your IIS Application Pool remains stable, responsive, and securely accessible to users.
Advanced Sensors
These sensors require a bit of knowledge about querying WMI objects.
wmi-data
WMI Data
The sensor allows the selection of the WMI class and instance key to retrieve object properties. The sensor enables processing multiple objects (and that's why it needs an instance key property).
The sensor allows setting alerts only on performance counters. Each numeric property of the selected class becomes a counter.
Beware that some classes may return large datasets as the sensor does not filter any instance.
Example
another way to monitor processes
- Namespace
- root\CIMV2
- WMI Class
- Win32_Process
- Instance Key
- Name
wmi-object
WMI Object
The sensor monitors a specific WMI object without writing a WQL query. So, in addition to the WMI Data sensor, an instance value must be set. It is compared for equality, so you can't filter objects by several properties.
The sensor also allows setting alerts on performance counters and treats each object's numeric property as a counter. Additionally, it allows for tracking status properties.
Status alert tracks change from one value to the other. You have continuously tracked
Finally, you can store the last object data in the program database. Widgets or UI can later access these data.
wql-query$object
WQL Query:Object
The WMI Object sensor has some limitations. For example, you can filter instances by a single field only. Unfortunately, simple things tend to be limited, while flexible ones quickly become complicated.
Example
another way to monitor the process
- Namespace
- root\CIMV2
- wql-query
- WQL Query
SELECT * FROM win32_Process WHERE name = 'NCServer.exe'
Now, you can access counters of the given process or set the status alert for property changes.
You can use State Trigger to track value changes if the property is numeric and has discrete values.
WBEM Sensors
WBEM stands for Web-Based Enterprise Management. It's a set of technologies that describe and share management information about various devices across different platforms. NetCrunch includes three WBEM sensors - Data, Object, and WQL Query: Object that allows access to all available WBEM classes.
WBEM Sensors are similar to their WMI Data, Query, and WQL Object counterparts.
General WBEM requirements
CIM Server (CIMOM) should be launched on a monitored machine along with CIM Providers to use these sensors.
Sensors support HTTP or HTTPS connections.
Credentials may be required, but it depends on the implementation of WBEM installed on a given machine.
wbem-data
WBEM Data
The sensor allows selecting WBEM class and instance key to retrieve object properties. The sensor enables the processing of multiple objects (and it's why it needs an instance key property).
The sensor allows setting alerts on performance counters only. Each numeric property of the selected class becomes a counter.
Some classes can return large datasets because the sensor does not filter any instance.
Requirements (standard for all WBEM sensors) To use this sensor, add it to the machine which has launched CIM Server (CIMOM) and some CIM Providers.
Example:
Processes monitoring:
- Namespace
- root/cimv2
- WBEM Class
- CIM_Process
- Instance Key
- Name
wbem-object
WBEM Object
The sensor monitors a specific WBEM object without writing a WQL query. So, in addition to the WBEM Data sensor, it requires an instance value to be set. The sensor checks it for equality, so you can't filter objects by several properties.
The sensor also allows setting alerts on performance counters and treats each object's numeric property as a counter. Additionally, it allows for tracking status properties.
Status alert tracks change from one value to the other. In such cases, you can always track status values and set them to appropriate values.
Finally, you can store the last object data in the program database. Widgets or UI can later access these data.
It is allowed to monitor only instances with unique instance property values.
wbem-wql-query$object
WBEM WQL Query: Object
WBEM WQL Query: Object Sensor The WBEM Object sensor has some limitations. For example, you can filter instances by a single field only. Unfortunately, simple things are limited, while flexible ones quickly become complicated.
It allows retrieving data of specific CIM Class instances by writing a WQL query. The query must point to only one instance.
Example
Monitoring of specific process
Namespace
root\cimv2
WQL Query
SELECTt * FROM CIM_Process WHERE name = '-bash'
Now you can access counters of the given process or set the status alert on property change.
TACACS+ Sensor
TACACS+ provides access control for routers, network access servers, and networked computing devices via one or more centralized servers. TACACS+ provides separate authentication, authorization, and accounting services.
The TACACS+ sensor checks the server connectivity and tries to authenticate a specified user. Sensor requires - TACACS server shared secret - used for data encryption - user (with password) to authenticate
The sensor should be added to the TACACS+ server machine.
Alerts:
- alert on connection error
- alert when user authentication failed
Counters
- Response time - total execution time of all queries in the TACACS session
Cisco CBQOS
NetCrunch's Cisco CBQoS (Class-Based Quality of Service) Sensors offer a sophisticated solution for monitoring Quality of Service statistics through SNMP. This tool is instrumental in analyzing key QoS metrics, providing network administrators with detailed insights to refine QoS policies effectively.
Detailed QoS Insights
The Cisco CBQoS Sensors in NetCrunch enable comprehensive monitoring of QoS statistics, crucial for optimizing network performance and traffic management. The main areas of monitoring include:
-
ClassMap Statistics: Gain in-depth statistical information related to ClassMaps, which helps in understanding how different classes of network traffic are being managed and prioritized.
-
Match Statement Statistics: Access detailed statistics associated with Match Statements to analyze how specific traffic is identified and categorized within the network.
-
Queueing Action Statistics: Examine statistics related to Queueing Actions, offering insights into how various traffic classes are being queued and handled, essential for effective bandwidth management and traffic shaping.
Default Alerts and Reports
Alerts
NetCrunch automatically generates alerts to keep administrators informed about critical issues, including:
- Authentication Error: Notifies when there are issues with SNMP authentication, ensuring secure and reliable data collection.
- Request Timeout: Alerts when SNMP requests to devices time out, indicating potential communication issues or device malfunctions.
Reports
NetCrunch provides default reports for comprehensive analysis, such as:
- Class Map Statistics Report: This report presents a detailed overview of the traffic in each class map, providing valuable data for evaluating the effectiveness of QoS policies.
Enhanced Decision-Making
With these tools, network administrators can make more informed decisions regarding QoS policies, leading to improved network performance and efficiency.
LDAP Monitoring
LDAP Authentication Sensor checks the user authentication process via LDAP that is used by directory services such as MS Active Directory.
LDAP Authentication Sensor
The sensor connects to LDAP (Lightweight Directory Access Protocol) server and tries to bind using a specified Distinguished Name and password.
LDAP Bind operation is used to authenticate clients (and the users or applications behind them) to the directory server.
Sensor alerts when bind operation cannot be completed (e.g., because specified credentials are invalid).
The sensor supports both plaintext and SSL/TLS connections and LDAP v2 and v3 protocols. Bind operation can be performed with a simple (plain text) authentication mechanism or using SASL (Simple Authentication and Security Layer) - Digest (MD5), NTLM/Negotiate, and Kerberos can be used.
Notice
Distinguished Name is commonly the string that uniquely identifies an entry in the Directory Information Tree, like:
cn=John Doe,ou=people,dc=example,dc=com
For Windows Active Directory, use either :
Domain\user
or
user@domain
Alerts:
- Connection error
- Authentication error
Counters
- Response time
Monitoring Files and Folders
NetCrunch allows monitoring files, folders, and text logs.
Node SettingsMonitoringAdd Monitoring Sensor
file
File Sensor
FTP/S, HTTP/S, SSH/Bash, SFTP, Windows/SMB, TFTP
NetCrunch contains a single sensor that allows monitoring files using one of the five common protocols. You can monitor file size, file changes, accessibility, or when it has been updated (file age).
Critical File Events
- Authentication Error
- Connection Error
- File does not exists
- File read error
Warning File Events
- Alert on Monitoring Sensor counter
- File exists
- File is empty
- File is not empty
- File modified
- File access error
- File has not been updated within the given time range (file age)
- File updated too often (file age)
text-file
Text File Sensor
FTP/S, HTTP/S, SSH/Bash, SFTP, Windows/SMB
The sensor allows the monitoring of file properties and file content. The content can be searched globally or per line.
File content event monitor can search for some text using plain text patterns or regular expression. The incremental search will monitor only new occurrences in a file.
Text File Line event monitor tries to match lines, and if a new line is found, an alert is triggered. A search pattern can be plain text or a regular expression. If multiple text lines match the search pattern, the program can group them into a single alert.
Critical File Events
- Authentication Error
- Connection Error
- File does not exist
Warning File Events
- Alert on Monitoring Sensor counter
- File exists
- File is empty
- File is not empty
- File modified
- File access error
- File has not been updated within a given time (file age)
- File read error
- File updated too often (file age)
- File Content event
- Text File Line event
Example: Alerting on cron log
For example, we want to know when there is at least 1 job ran on exit. So let's see a sample cron log:
Nov  5 01:01:01 localhost CROND[22826]: (root) CMD (run-parts /etc/cron.hourly)
Nov  5 01:01:01 localhost run-parts(/etc/cron.hourly)[22826]: starting 0anacron
Nov  5 01:01:01 localhost anacron[22836]: Anacron started on 2015-11-05
Nov  5 01:01:01 localhost anacron[22836]: Normal exit (1 job run)
Nov  5 01:01:01 localhost run-parts(/etc/cron.hourly)[22838]: finished 0anacron
We can define the following expression to a more specific line:
anacron.*Normal exit \([1-9]*
Performance Metrics
- Text.File.Sensor/Check Time
- Text File.Properties/Size
data-file
Data File
FTP/S, HTTP/S, SSH/Bash, SFTP, Windows/SMB
The sensor loads data from a file using one of the predefined file formats. It supports native NetCrunch XML, JSON, and CSV and allows processing data through Data Parsers, allowing for any data.
- Data File Sensor
The sensor allows getting data from various sources and processes them to get metrics and status values.
- Custom Data Parsers
Data Parsers transform and analyze external data, returning NetCrunch counter metrics and status objects.
- Sending Data to NetCrunch
Read how to send data to NetCrunch and create a custom monitor. You can easily turn any application or script into a NetCrunch agent.
folder
Folder Sensors
FTP/S, SSH/Bash, Windows/SMB
The folder sensor allows observing folder content. The sensor can trigger alert when the file is deleted and on various other conditions.
Critical Folder Events
- Authentication Error
- Connection Error
- Folder access error
- Folder does not exist
Warning Folder Events
- Folder empty
- Folder exists
- Folder not empty
Monitoring Folder Content
You can check the list of files matching the given file mask.
- Files exist
- Files not exist
- New file added
- File removed
- Last modified file in the folder is older than...
- Oldest file in the folder is older than...
- Last modified file in the folder
- Oldest file in the folder
Performance Metrics
- Folder.Sensor/Check Time
- Folder. Properties/File Count
- Folder.Properties/Size (bytes)
Monitoring Text Logs
NetCrunch allows monitoring text file content and has a special sensor for text logs.
Node SettingsMonitoringAdd Monitoring Sensor
NetCrunch allows two levels of monitoring of log files. Simple monitoring can be configured with file sensors (using remote windows, FTP or HTTP), which look for a specific text pattern in log files.
More advanced log monitoring is possible with Text Log sensor, which can parse the file, and then the program can collect and alert on parsed entries.
Text Log Sensor
FTP/S, HTTP/S, SSH/Bash, SFTP, Windows/SMB, TFTP
This sensor parses a file and converts each entry into a list of properties, which later can be filtered like any other type of log (Windows Event Log, syslog). This gives you more control over how alerts are triggered and allows better analysis of collected log entries in the event log.
Text Log sensor can remotely monitor large log files on Windows (tested on gigabyte files) and using SSH/Bash connection. Unfortunately, FTP or HTTP requires whole files to be downloaded.
NetCrunch contains sample text log formats and allows defining custom formats using text parsing expressions.
Text Log Parsing Expressions
Settings Resources Text Parsing Expressions Text Log Expressions
Separated Values (CSV)
Best suited for simple log formats where each line contains fields separated by a single character.
For example, such a line can look like this:
11/19/15 7:20:38 am,Information,Monitor started
And we can define that the program should convert this to fields:
- Time
- Severity
- Message
Regular Expressions
In the case of logs where there is no separator between fields, we can use regular expressions. The expression must contain search groups to identify each field.
Simple example.
In this example, our log can contain a number at the beginning and then a message until the line's end.
10345 : Error during loading module.
Expression:
([0-9]*) : (.*)
We can define two fields to manage such log:
- ProcessId
- Message
Parsing expression editor allows immediate testing of your expressions:

Log4J Log Format
This is a widely used log format by Java programs. It's a good example of using regular expressions to monitor the log entries.
Apache Log Format Expression
Apache logs can be formatted using special formatting strings. NetCrunch can reverse-engineer these formats to parse a given log. To parse the log, you need only copy the log format string from the configuration and put it into NetCrunch expressions.

Javascript Expression
You can write a simple code to parse input text.
Prerequisites
- input text is in text variable
- The output object is the result variable, and its properties should match the defined variables
- you have to add each variable name to the list of variables

Alerts
- Authentication error
- Connection error
- File read error
- File access error
- File does not exist
- File exists
- File has been updated within a given time range (file age)
- File is empty
- File is not empty
- File modified
- File updated too often (file age)
- Alert on the text log entry
For example, for our simple log, we can define an alert:

Counters
The program can also trigger an alert on the following performance counters:
- Text Log.Sensor.Check Time
- Text Log.Properties/Log Entries Processed
- Text Log.Properties/Size
Monitoring Web Pages & Data
NetCrunch can monitor requests, pages, and data on the web.
Node SettingsMonitoringAdd Monitoring Sensor
NetCrunch includes two web-monitoring sensors.
web-page
Web Page Sensor
The sensor renders the page as a web browser would. It loads all resources and runs scripts. It's intended for monitoring modern pages or applications. It supports standard login and custom login forms.
Options
- Connection Profile
- Authentication Profile
- Load images
- Run JavaScript
- Follow redirects
Alerts:
- Alert on Monitoring Sensor counter
- Web page does not exist
- Web page loading error
- Page resource load error
- Page content changed
- Alert on HTML element check
- Connection Error
- Authentication Error
Checking Page Content
You can test page content in two ways. First, you can search for text patterns using regular expressions within the HTML or text content. Second, you can define a DOM selector to locate an element on the page and then check the text or attributes of that element (or list of elements).

Performance Metrics:
- Web Page.Sensor.Check Time
- Web Page.Page/% Availability - Availability is 100% if HTTP responds with status 200 (OK), otherwise it is 0%
- Web Page.Page/HTTP Status Code - Status code returned by the server
- Web Page.Page/JS Errors - JavaScript execution error (exception) count
- Web Page.Page/Load Time - Total page loading time (ms)
- Web Page.Page/Main Frame Body Size - Length of the page's mainframe content (bytes)
- Web Page.Page/Resource Count - Page resource count
- Web Page.Page/Resources Error Count - Page resource loading error (timeout) count
- Web Page.Page/Total Size - Total length of all page resources (bytes)
Report
Default report added collects: % Availability, Load Time , Total Size, Resource Count, Resource Error Count. These parameters are also available in the Performance Trend Viewer.
basic-http
Basic HTTP Sensor
This sensor sends a single request and can alert based on the response code or specific response data. It supports GET, HEAD, and POST requests. The sensor allows you to set custom request headers and cookies. Additionally, it can follow redirects (disabled by default) and alert if there are issues with the SSL certificate.
Alerts:
- Alert on Monitoring Sensor counter
- HTTP response code is not OK
- Server responded with error code
- Certificate expired
- Certificate is about to expire
- Certificate changed
- Certificate revoked
- Alert on SSL Certificate field conformance
- Connection Error
- Authentication Error
Performance Metrics:
- Basic HTTP.Sensor.Check Time
- Basic HTTP.Response/% Availability - Availability is 100% if HTTP responds, otherwise it is 0%
- Basic HTTP.Response/Content Length - Response content length (bytes)
- Basic HTTP.Response/Length - Full HTTP response length in bytes (includes header size)
- Basic HTTP.Response/Time - HTTP response time (ms)
Report
By default, the sensor adds a report containing: % Availability, Response Time, and Content Length charts. These metrics will be collected and available as a report or through Performance Trend Viewer
rest-http
REST HTTP
Similar to the Basic HTTP sensor, this sensor can send a single request and alert based on the response code or specific response data. Additionally, it can send any type of HTTP request, including custom requests, and easily add URL query parameters. It also allows setting custom request headers and cookies. Additionally, it can follow a redirect (the option is off by default) or alert if there is a problem with the SSL certificate.
Alerts:
- Alert on Monitoring Sensor counter
- HTTP response code is not OK
- Server responded with error code
- Certificate expired
- Certificate is about to expire
- Certificate changed
- Alert on SSL Certificate field check
- Connection Error
- Authentication Error
Performance Metrics:
- REST HTTP.Sensor.Check Time
- REST HTTP.Response/Content Length - Response content length (bytes)
- REST HTTP.Response/Length - Full HTTP response length in bytes (includes header size).
- REST HTTP.Response/Time - HTTP response time (ms)
The sensor processes any received data and converts it into counters and status objects using Data Parses.
HTTP/s File Sensor
Check remote file content and authentication parameters, monitor remote text logs, file size, or change time, presence, and more. See Monitoring Files and Folders.
VMware Monitoring
See how to monitor virtual machines, datastores, hardware status, and the performance counters of host and guest VMs.
NetCrunch supports ESXi version 4 or newer. It can connect directly to the ESXi servers or through vSphere vCenter. In the case of vCenter failure or maintenance, it can switch to direct mode automatically.
NetCrunch comes with pre-configured Automatic Monitoring Packs to monitor ESX as soon as OS monitoring is set to ESX.
Monitoring Modes
vCenter
It requires adding a vCenter Sensor to a machine hosting a vCenter server. The sensor will automatically switch detected ESXi machines to vCenter mode. Features such as active alarms and configuration issues are available in vCenter mode only.
Direct
You should use this mode only if you do not run vCenter to manage your ESXi host or fall back when vCenter is not available. It requires specifying credentials per each ESXi server, which can be different than vCenter credentials.
ESXi View
The view gives you a comprehensive at the state of monitored ESX hosts.

ESXi/VM View
You can see all information about all monitored Virtual Machines per map and on the Atlas level.

ESXi System Views

Virtual Machines
StatusSystem ViewsVirtual Machines
For each ESXi machine, NetCrunch lists all virtual machines running on the given ESXi. You can add the virtual machine to the Atlas to be monitored. It's possible only if the machine is running, and it has an IP address assigned.
Datastores
StatusSystem ViewsDatastores
NetCrunch allows the monitoring of VMware data stores. You also see their properties in the node status window.
Hardware Status
StatusSystem ViewsHardware Status
NetCrunch tracks all hardware statuses provided by the ESX server.
Counters can be monitored by ESX or using the VM machine instance Counters.
Performance Counters
NetCrunch provides counters for both the host ESX system and guest VM.
You can set triggers on those values using Event Triggers for Counters.
Datastore - Counter Object
- % Free Space
- Capacity Bytes
- Free Space Bytes
- Host Count
- Uncommitted Space Bytes
- Virtual Machine Count
Summary - Counter Object
The object provides performance counters for a given ESX server.
- % CPU Usage
- % Memory Usage
- Disk IO rate Bytes per sec.
- Network Utilization Bytes per sec.
- Running VM Count
- Total VM Count
- Up Time
- Used CPU Hz
- Used Memory Bytes
Virtual Machine -Counter Object
The object provides performance counters for a given guest system (VM).
- % CPU Usage
- % Guest Memory Usage
- % Host Memory Usage
- Disk IO Rate Bytes per sec.
- Guest Used Memory Bytes
- Host Used Memory Bytes
- Network Utilization Bytes per sec.
- Used CPU Hz
Alerts
If you want to add alerts to the single ESX server, go to Settings Alerting & Notifications Monitoring Packs and Policies. You can add new or overwrite alert rules defined by ESX Monitoring Pack.
ESXI Alert Types
- Alert on ESXi Hardware Status change
- Alert on ESXi Alarm state
- Alert on Performance Counter Threshold
The other option is to modify ESX Monitoring Pack and then go to Monitoring > Monitoring Packs & Policies and edit the selected monitoring pack located in the VMware section.
Adding ESXi guests
Node SettingsMonitoringESXi
You may decide to add each guest system to NetCrunch automatically. Each guest will be automatically monitored according to the defined Automatic Monitoring Packs.
The option is disabled by default.
When the option is enabled, and you want to remove a VM guest from Atlas, you need to set a specific exclusion in the Network View. Otherwise, the machine will be added over and over again.
Guest Status is taken directly from VMware (ESX) - therefore, the Machine which won't respond to any service check may be marked as 'down' while guest status is marked as 'running.'
Proxmox VE Monitoring
Monitor Proxmox VE clusters, nodes, virtual machines, containers, storage, and Ceph health through the Proxmox REST API.
NetCrunch provides integrated monitoring for Proxmox Virtual Environment infrastructure. It collects health, status, and performance data from Proxmox clusters, physical Proxmox nodes, QEMU virtual machines, and LXC containers using the Proxmox REST API.
Proxmox monitoring gives you a centralized and hierarchical view of the infrastructure:
- Cluster status and quorum
- Proxmox node availability and resource usage
- Datastore and storage usage
- Ceph cluster state
- Virtual machine and container performance
- CPU, memory, disk, network, swap, and pressure stall metrics
NetCrunch can connect directly to a single Proxmox node or retrieve information from the whole Proxmox cluster.
Requirements
Proxmox monitoring requires credentials that allow read-only access to the Proxmox VE API.
Supported authentication methods:
- API Token, recommended
- Username and password
The monitoring user requires the PVEAuditor role assigned at the root level /.
This grants read-only access to all cluster resources and is required for complete cluster, node, storage, VM, and container visibility.
This requirement applies to all supported Proxmox user types:
- Local Proxmox users, for example
user@pve - Linux PAM users, for example
user@pam - LDAP or Active Directory users
Use an API token whenever possible. It is safer than storing an interactive user password and is easier to rotate without changing the user's login credentials.
Configuration
NetCrunch includes preconfigured automatic monitoring packages for Proxmox VE. When the node operating system monitor is set to Proxmox VE, NetCrunch can automatically apply the required monitoring settings.
For new nodes, Proxmox VE can be detected automatically. You can also enable Proxmox VE monitoring manually in the node monitoring settings.
After valid Proxmox credentials are provided, NetCrunch detects the Proxmox cluster and prompts you to add it for monitoring.
Cluster monitoring options
- Create atlas nodes for Proxmox nodes
- Automatically adds Proxmox cluster nodes to the Network Atlas for monitoring.
Node monitoring options
- Create nodes for guests
- Automatically adds Proxmox guest systems to the Network Atlas. This applies only to guests with a known IP address.
For QEMU virtual machines, the Proxmox Guest Agent must be running for the guest IP address to be available to NetCrunch.
Cluster Monitoring
Cluster monitoring tracks the health and availability of the Proxmox cluster as a whole.
NetCrunch automatically collects storage usage metrics for the Proxmox cluster and monitors key cluster-level conditions.
Cluster alerts
NetCrunch can alert on the following Proxmox cluster conditions:
- Ceph Cluster Warning
- Ceph Cluster Critical
- Cluster has no Quorum
- Low free space on Datastore
- Any Proxmox node goes offline
Cluster monitoring scope
Cluster monitoring is focused on shared infrastructure state, including:
- Cluster quorum
- Node membership
- Datastore usage
- Cluster-level storage health
- Ceph health, if Ceph is used by the Proxmox environment
Proxmox Node Monitoring
A Proxmox node is monitored by enabling the Proxmox VE OS monitor on the node.
Node monitoring tracks the physical or virtual host running Proxmox VE. It collects system-level metrics and monitors host resource pressure.
Node alerts
NetCrunch can alert on the following Proxmox node conditions:
- High CPU Usage
- High memory usage
- Low free disk space
- High swap usage
- Possible storage bottleneck, based on IO Wait
- Node CPU Pressure Warning, when
cpu > 70%orloadavg / maxcpu > 0.7 - Node CPU Saturation Critical, when
cpu > 90%andloadavg / maxcpu > 1.0
Performance Metrics - Proxmox Node
The Proxmox node sensor collects comprehensive metrics about node resource usage and performance.
Processor metrics
- Processor/% CPU Usage
- Processor/CPU Count
Memory metrics
- Memory/% Used
- Memory/% Free
- Memory/Total Bytes
- Memory/Used Bytes
- Memory/Free Bytes
Disk metrics
- Disk/% Used
- Disk/% Free
- Disk/Total Bytes
- Disk/Used Bytes
- Disk/Free Bytes
System metrics
- System/Uptime
- System/% IO Wait
CPU Load metrics
- CPU Load/1 Minute Average
- CPU Load/5 Minutes Average
- CPU Load/15 Minutes Average
Swap metrics
- Swap/% Used
- Swap/% Free
- Swap/Total Bytes
- Swap/Used Bytes
- Swap/Free Bytes
Virtual Machine and Container Monitoring
The Proxmox/VM Sensor is added automatically when NetCrunch discovers that a node is a Proxmox virtual machine or container.
No additional sensor configuration is required.
Supported guest types:
- QEMU virtual machines
- LXC containers
For QEMU virtual machines, the Proxmox Guest Agent must be installed and running if you want NetCrunch to receive the guest IP address from Proxmox.
Guest alerts
NetCrunch can alert on the following guest conditions:
- High guest processor utilization
- High guest memory usage
- Low free disk space on guest
- CPU fully saturated, all tasks waiting
- Applications waiting for CPU
- Processes waiting for memory
- System stalled due to memory pressure
- Applications waiting for disk
- All operations blocked by disk I/O
Performance Metrics - Virtual Machines and Containers
The Proxmox/VM Sensor collects detailed metrics about guest system resource usage.
Guest Processor metrics
- Guest Processor/% CPU Usage
- Guest Processor/CPU Count
Guest Memory metrics
- Guest Memory/% Used
- Guest Memory/% Free
- Guest Memory/Total Bytes
- Guest Memory/Used Bytes
- Guest Memory/Free Bytes
Guest Swap metrics
Guest swap metrics are available for LXC containers only.
- Guest Swap/% Used
- Guest Swap/% Free
- Guest Swap/Total Bytes
- Guest Swap/Used Bytes
- Guest Swap/Free Bytes
Guest Disk metrics
- Guest Proxmox.Guest.Disk/Read Bytes
- Guest Proxmox.Guest.Disk/Write Bytes
- Guest Proxmox.Guest.Disk/Read Bytes/sec
- Guest Proxmox.Guest.Disk/Write Bytes/sec
Guest Network metrics
- Guest Network/In Bytes
- Guest Network/Out Bytes
- Guest Network/In Bytes/sec
- Guest Network/Out Bytes/sec
Guest CPU Pressure Stall metrics
- Guest CPU Pressure Stall/% Some
- Guest CPU Pressure Stall/% Full
Guest Memory Pressure Stall metrics
- Guest Memory Pressure Stall/% Some
- Guest Memory Pressure Stall/% Full
Guest IO Pressure Stall metrics
- Guest IO Pressure Stall/% Some
- Guest IO Pressure Stall/% Full
Guest System metrics
- Guest System/Process ID
Pressure Stall Metrics
Proxmox guest monitoring includes pressure stall metrics where available.
Pressure stall metrics help identify resource contention that may not be obvious from simple utilization values alone.
- CPU pressure
- Shows how much time tasks are delayed because CPU resources are unavailable.
- Memory pressure
- Shows how much time processes are delayed because memory is unavailable or reclaim activity is blocking execution.
- IO pressure
- Shows how much time tasks are blocked by disk or storage I/O.
The % Some metric indicates that at least some tasks were waiting for the resource.
The % Full metric indicates that all non-idle tasks were waiting, which is usually a more severe condition.
Recommended Monitoring Workflow
Use this sequence when adding Proxmox VE monitoring:
Add or discover Proxmox node
Add the Proxmox node to the Network Atlas or let NetCrunch discover it automatically.
Enable Proxmox VE OS monitoring
Set the OS monitoring type to Proxmox VE if it was not detected automatically.
Provide Proxmox credentials
Use an API token or username and password with the PVEAuditor role assigned at /.
Add the detected cluster
After credentials are verified, NetCrunch detects the Proxmox cluster and prompts you to add it for monitoring.
Enable automatic node creation
Use Create atlas nodes for Proxmox nodes to add Proxmox cluster nodes automatically.
Enable guest discovery
Use Create nodes for guests to add virtual machines and containers to the Atlas automatically when their IP addresses are known.
Review alerts and monitoring packs
Check the automatically assigned monitoring packages and adjust thresholds if your Proxmox environment has unusual resource usage patterns.
Best Practices
- Use API tokens
- Prefer API tokens instead of username and password authentication.
- Assign minimum required permissions
- Use the PVEAuditor role at
/for read-only monitoring access. - Monitor both cluster and nodes
- Cluster monitoring detects shared infrastructure problems, while node monitoring detects host-level resource issues.
- Enable Guest Agent for QEMU VMs
- Without the Proxmox Guest Agent, the IP address of a QEMU virtual machine may not be available to NetCrunch.
- Review datastore thresholds
- Storage alerts should reflect your operational policy. Small Proxmox environments may require different free-space thresholds than large clusters.
- Watch IO Wait and pressure stall metrics
- High CPU usage alone does not explain every performance problem. IO Wait and pressure stall metrics help identify storage and scheduling bottlenecks.
- Add guests to the Atlas when useful
- Guest nodes provide better visibility, but only add them automatically when IP addressing and naming are reliable.
Troubleshooting
Cluster is not detected
Check the following:
- The Proxmox API is reachable from the NetCrunch Server or Probe
- The credentials are valid
- The user or token has the PVEAuditor role assigned at
/ - The selected Proxmox node is a member of the expected cluster
Proxmox nodes are not added automatically
Check whether Create atlas nodes for Proxmox nodes is enabled.
Also verify that NetCrunch can resolve and reach the Proxmox node addresses returned by the Proxmox API.
Guest systems are not added automatically
Check whether Create nodes for guests is enabled.
For QEMU virtual machines, verify that:
- Proxmox Guest Agent is installed
- Proxmox Guest Agent is running
- Proxmox reports the guest IP address through the API
For LXC containers, verify that Proxmox can report the container network address.
Guest metrics are incomplete
Some metrics depend on guest type and Proxmox data availability.
For example:
- Guest swap metrics are available only for LXC containers
- Guest IP detection for QEMU VMs requires the Guest Agent
- Pressure stall metrics depend on guest and host support
Summary
NetCrunch Proxmox monitoring provides hierarchical visibility across the full Proxmox VE stack.
It monitors:
- Proxmox clusters
- Proxmox nodes
- Datastores and storage usage
- Ceph health
- QEMU virtual machines
- LXC containers
- Guest resource usage and pressure stall conditions
By combining cluster-level monitoring, node-level monitoring, and automatic guest discovery, NetCrunch gives administrators a complete operational view of Proxmox infrastructure from one place.
Apache Web Server Monitoring
Monitor most popular Apache web servers.
Node SettingsAdd Monitoring SensorApache Web Server
NetCrunch allows the monitoring performance of Apache web servers. The Apache sensor allows you to monitor various performance metrics grouped in objects like Country, Summary, and Virtual Host.
Summary Counters
- Bytes Per Second
- Client Count
- Process Count
- Requests Per Second
- Total Requests
- Total Transfer
- Up Time
Country and Virtual Host Counters
- Avg CPU Time
- Avg Request Elapsed Time
- Avg Request Processing Time
- Client Count
- Max CPU Time
- Max Request Elapsed Time
- Max Request Processing Time
- Transfer
Monitoring Mail Services
NetCrunch allows monitoring mail content, mailboxes, and checking basic mail server functionalities using a round trip email sensor.
Node SettingsAdd Monitoring Sensor
NetCrunch allows various aspects of email monitoring.
Supported Protocols
All email sensors support IMAP4/S and POP3/S.
mailbox
Monitoring Mailbox - Mailbox Sensor
This sensor allows for monitoring of mailbox authentication, activity, performance, and size. You can check if the mailbox is properly processed by checking the oldest email in the mailbox or receiving the last message. The sensor is operating on the mailbox owned by another user, so the sensor is not changing the mailbox's content.
Available alerts:
- Authentication Error
- Connection Error
- Protocol Error
- Mailbox Activity Events: (if the oldest message is older than..., no new messages received in last...)
- Alert on Monitoring Sensor Counter
Performance Counters:
- Mailbox.Sensor.Check Time
- Mailbox.Properties/Number of Messages
- Mailbox.Properties/Size of Largest Message
- Mailbox.Properties/Size of Messages
data-email
Monitoring Emails - Data Email Sensor
The sensor allows triggering alerts based on email sender, subject, or body. It can match emails using simple text patterns or using parsing expressions (i.e., regular expressions, scripts). The sensor can extract data from email content and turn them into performance metrics.
Available alerts:
- Authentication Error
- Connection Error
- Protocol Error
- Alert on Email Message
- Alert on Status Object Change
- Alert on Monitoring Sensor Counter
Performance Counters:
- Data Email.Sensor/Check Time
- Data Email.Sensor/Received Messages
- Data Email.Object
In this case, the sensor must own the mailbox. It will automatically delete all processed emails.
email-round-trip
Monitoring Mail Server - Email Round Trip Sensor
This sensor is intended to check the mail server functionality by sending and receiving test emails. It must use a dedicated mailbox, and it removes test emails from the mailbox automatically.
Because the SMTP server might be configured to use a different IP address than POP3, you should add the sensor to the POP3 server, and then you can set the SMTP connection IP address separately.
Available alerts:
- Email has not been received
- Email has not been sent
- Authentication Error
- Connection Error
- Protocol Error
- Alert on Monitoring Sensor Counter
Performance Counters:
- Email Round-Trip.Sensor/Check Time
- Email.Round-Trip.Email/Receiving Duration
- Email.Round-Trip.Email/Sending Duration
- Email.Round-Trip.Email/Total Duration
Sending Data to NetCrunch
Read how to send data to NetCrunch and create a custom monitor. You can easily turn any application or script into a NetCrunch agent.
Data Receiver Sensor
You can add the Data Receiver Sensor from the sensor list on any node. The configuration here is very minimal. It needs a name, and it automatically creates an API key for an external agent expected to send data to NetCrunch. The API key consists of the sensor name (without spaces) and node id number. For example, an API key can be JMX@1034, if we name our agent "JMX."
You can add multiple sensors on a single node for each application you need to monitor.
Data Format
The sensor can process data in various formats using specific data parsers. By default, it uses native NetCrunch JSON format, but you can easily create a custom parser.
Retention Time
Because NetCrunch does not know how often you will send data to it, you need to specify a "retention time" for data, after which it will expire and be cleared out of memory.
REST API
We wanted to keep the API for the sensor straightforward. The simplest tool you can use to send requests to NetCrunch is cUrl open source project, available for almost any platform. You can find it at curl.haxx.se
The API consists of only 5 requests:
Update
POST /api/rest/1/sensors/<api-key>/update
By default, sensor expects <NetCrunch JSON> data format. So, the request payload should be application/json content type
Example
 {
    "retain": 1,
    "counters": {
        "PBX/line status.0" : 1,
        "PBX/line status.1" : 0
     },
     "statuses":  {
       "AC"  : "On",
       "Power": "On"
     }
 }
As you can see, you can send multiple statuses and counters in a single request.
Status Objects
Beside simple status values (key, value pairs), NetCrunch allows tracking of status objects. The status object can be described by the JSON object and can contain additional user data.
For example:
 {
      "statuses" :  {
           "Disk C:" : {
                          "value" : "ok",
                          "message" : "Working fine",
                          "retain" : 5,
                          "critical": true,
                          "data" : {
                             "type" : "SDD",
                             "upTimeSec" : 123431
                          }
           }
       }
    }
The status object can contain fields such as:
-
value - a status value that can be any string, but if one of the standard values is used, NetCrunch will use the value for calculation alert conditions. The field is required to recognize the status object, otherwise, the whole object will be treated as a text string. Standard values are: ok, error, warning, disabled, unknown.
-
name - the name of the object, it does not have to be unique. (optional)
- message - this can be a message describing the state (for example, error message). (optional)
- received - a time when the status has been read. (optional)
- retain - how long status will be valid if no new status is received after this status becomes unknown. The time is in minutes.
- Class - status class. If specified status history will be saved to the database. The class helps UI understand data associated with the status and display it appropriately.
- data - custom data. It can be any JSON object, except if class points to one of the well-known classes, it must conform to the class data format.
- critical - when
truethe sensor status will reflect highest status of a given object
Add more about classes after we define some.
Sensor Status Calculation
When your object contains the "Critical" field, it will influence whole sensor status; otherwise, sensor status is based on active alerts state.
Any object set to "critical": true will set sensor status to the highest alert level (error or warning). If the object is non-critical ("critical": false), then the sensor is in error state only if all objects are in error state, and it is in warning state when any of its objects are in error or warning state.
Counter
GET /api/rest/1/sensors/<api-key>/counter?<parameter-list>
Example
<nc-server-address>/api/rest/1/sensors/<api-key>/counter?Temp=65&Wind=4&@retain=5
Counter/inc Counter/dec
As NetCrunch stores counter values in memory, the agent can increment it without storing its actual value. The request will increase or decrease the counter by the given value.
Example
<nc-server-addres>/api/rest/1/sensors/<api-key>/counter/inc?Door.Opened=1
Status
GET /api/rest/1/sensors/<api-key>/status?<parameter-list>
Example
<nc-server-address>/api/rest/1/sensors/<api-key>/status?Door=Opened&@retain=5
Sending data to multiple nodes - shared URLs
By default, the data URL is pointing to a single sensor on a single node, but if you want to supply data to multiple nodes, you can use a shared URL. To do this, check Use the shared URL option in the sensor configuration.

Now your data should be in the form of a JSON array, and each sensor object has to contain node identification, which is node DNS name or IP address depending on node Identification Type.
For example:
Example
[
 {
    "node": "192.168.10.1"
     "statuses":  {
       "AC"  : "On",
       "Power": "On"
     }
 } ,
 {
    "node": "test.lab"
     "statuses":  {
       "AC"  : "Off",
       "Power": "Off"
     }
 }
 ]
Web Messages
You can easily send event messages to NetCrunch using an HTTP request. The program accepts POST and GET requests.
Service URL
http://<nc-server>/api/rest/1/event/<node-identification>
Node identification is a node IP address or DNS name.
Find more information below.
NetCrunch Self Monitor
Read about how NetCrunch monitors itself.
NetCrunch Server is like any complex application with multiple processes, lots of data processing, and high demand for storage. In fact, NetCrunch has multiple logs and monitors thousands of parameters.
These parameters are essential when diagnosing potential performance problems. Be aware: the program is always limited to the hardware capabilities it's running on.
So, NetCrunch Self Monitor is the monitor that watches the NetCrunch Server.
Some programs merely hide problems, which is troublesome, mainly because it creates the illusion that something is working when in actuality, it's not. It's hard to detect and impossible to solve when there is no visible problem. Most problems are caused by overloading - NetCrunch Server overloading or monitored device overloading. Many Cisco devices have protection against too many monitoring requests sent to the device. In many cases, the solution is simple: increasing monitoring time or timeouts.
The status of the NetCrunch server is available on the NetCrunch Server Status dashboard.
Alerts
Settings Alerting & Notifications Monitoring Packs and Policies Global NetCrunch Self Monitor
The global monitoring pack contains default alerting settings for this monitor, and they trigger Default action.
NetCrunch alerts on:
- (Critical) SNMP monitoring heavily overloaded
- (Warning) SNMP monitoring overloaded
- (Warning) Network Services monitoring overloaded
- (Critical) Database overloaded. Some events have been dropped
- (Warning) Writing to the database is slow
- (Critical) Low disk space (< 512MB). Please free up some space on the NetCrunch data disk.
- (Warning) Low disk space (< 1GB. Please free up some space on the NetCrunch data disk.
- (Critical) The system is low on memory (< 512MB)
- (Critical) Virtual memory for NetCrunch Server fragmented. Performance might be negatively affected. A machine restart is required.
- (Warning) Physical Segments not refreshed on time
- (Warning) Database size is close to maximum capacity
- (Warning) System is running for too long
- (Warning) Server handle usage too high
- (Warning) Atlas backup had been executed more than two days ago
- (Critical) the Last backup failed
- (Warning) Limit of licensed nodes nearly reached
- (Critical) NetCrunch license is about to expire
- (Warning) New NetCrunch version available
- (Warning) NetCrunch maintenance subscription is about to expire
- (Critical) NetCrunch trial period is about to expire
SQL Query Sensors
SQL sensors allow for measuring connectivity, query execution, and result data processing as metrics or statuses. Supported databases: Oracle, SQL Server, PostgreSQL, MySQL, MariaDB, ODBC.
Supported Databases
ODBC
NetCrunch supports ODBC sources and several native drivers. It requires x64 ODBC drivers to be installed. Please remember that you must use System DSN because NetCrunch runs as a service process and can't access your User DSNs.
SQL Server
To use the SQL Query Sensor in NetCrunch, install ODBC Driver 18 for SQL Server on the NetCrunch server. This ensures compatibility with SQL Server 2008 and later, including SQL Azure.
The sensor does not support the Numeric(18,0) data format and treats it as a string value. Use float, real, or int for numeric data.
Oracle
The program supports Oracle 11 up to 23, depending on the drivers you install. OCI v19 is the latest driver supported, but it will work with newer databases.
Installing Oracle Instant Client drivers
- Go to Oracle.com and search for Instant client windows x64.
- Download basic client x64.
- Extract the contents to
\external\Requesters or other folders, but you must add the path to the system Path variable. - Restart the NetCrunch Server service.
PostgreSQL
The latest driver is installed with NetCrunch. No further installation is needed.
MySQL, MariaDB
The latest driver is installed with NetCrunch. No further installation is needed.
Managing Database Connections
Each sensor allows the creation of connection profiles. If you do not save the profile, it's named ** Custom** and saved only for a given node.

If you saved the connection profile, you could reuse it for multiple SQL sensors, even on another node, if they use the same settings. You can edit the profile from the sensor setting, but to save changes, you have to save it and override the previous profile settings. Otherwise, the profile will automatically become Custom.
You can also manage database profiles in the Credential Manager. Settings Monitoring Main Monitoring Credentials Manager Database connection
Checking if the sensor can connect to a database
OK. You set the credentials, and now it is time to connect. Select the database selection button, and you should see the list of databases or get an error message.
sql-query$object
SQL Query:Object
It allows executing a query returning a single row. It can also be used with an empty query to check database authentication and connectivity. The row can represent an object, and the columns can represent object properties. The sensor allows setting an alert on the status of object properties.
- Select a connection or create a new one with proper database credentials.
- Select the database from the list.
You can keep your query empty. Then, the sensor will only connect to the given database, and its status will reflect database connectivity.
When you write your SQL query query, ensure it will return a single data row. This row of data can now be used to monitor status change values.
You can test your sensor query by clicking the test icon at the window's top right corner.
Predefined alerts:
- Authentication error
- Connection error
- Empty result set
- Query execution error

sql-query$data
SQL Query:Data
Allows executing a query returning multiple rows. Columns can be used as a source for metrics. The metrics enable threshold alerts to be triggered and used for reporting.
- Select a connection or create a new one with proper database credentials.
- Select the database from the list.
- Enter the SQL query query.
- Select the Instance Column to identify rows in the table.
Now, you can add counters and set thresholds.
Example
Let's try grouping table elements by name and counting them. This way, we can create a single counter; the instance is the name.
SELECT COUNT(*) AS Count, Name FROM MyTable GROUP BY Name
In this case, we have a single metric, Count, and the Name column will be the instance column.
No Database option
Some queries aren't directly related to any database. The 'No Database' option allows for selecting multiple databases and data related to them in queries.
Example
   SELECT      sys.databases.name,
       CONVERT(int,SUM(size)*8/1024) AS [Total disk space]
   FROM        sys.databases
   JOIN        sys.master_files
   ON          sys.databases.database_id=sys.master_files.database_id
   where sys.databases.database_id > 4
   GROUP BY    sys.databases.name
   ORDER BY    sys.databases.name
Remarks
SQL sensors require being configured with the actual database connection. The query needs to be executed to select counters and status objects properly. - Only columns of numerical types can be used for counters. Use the CAST expression (or CONVERT in T-SQL) and alias name to cast the text column into numerical type. - Maximum number of returned values is 1000 - Default Request timeout is 15000 (15 seconds)
Beware when editing the query. Your counters may no longer match the query results.
IP Camera Sensor
HTTP/S, ONVIF
NetCrunch's IP Camera Sensor efficiently monitors your camera systems, capturing snapshot images to verify connectivity. These images are displayed in the node status window and can also be integrated into network maps using the Snapshot Image widget for enhanced visual monitoring.
Predefined Alerts
The sensor is equipped with essential alerts to maintain the security and functionality of your camera system:
- Connection Error
Triggered when the sensor fails to connect to the camera. - Authentication Error
Notifies you in case of issues with camera authentication.
Image-Related Alerts
These alerts are specifically designed to monitor changes or anomalies in camera images:
-
Alert if Camera Image Differs from Reference
This alert is raised when the current image differs from a predefined reference image. The sensitivity can be adjusted:- Low: Suitable for areas with varying lighting, such as rooms with windows.
- Medium
- High: Best for areas where lighting remains constant.
- Alert if Camera Image May Be Tampered
Triggered when the image appears obscured or covered, indicating potential tampering. - Alert if Camera Image Has Changed
Raised when any change is detected in the image, depending on the sensor’s monitoring interval. - Alert on Motion Detection
Activated when differences between the current and previous images suggest motion, deactivating when the image stabilizes.
All image-related events from the IP Camera Sensor offer enhanced event detailing: - They display the involved image in event details. - They can include the image in email notifications (HTML format) for immediate reference.
Adding Snapshot Image Widget to a Graphical Data View
Integrate real-time camera snapshots into your network maps by following these steps:
- Edit View.
- Add Camera Snapshot Widget.
- Select your preferred Image Source from the dropdown menu in the Data tab.

iNodes Sensor
The sensor monitors usage of iNodes on Linux machines
The inode is a data structure in a Unix-style file system that describes a filesystem object such as a file or a directory. Each iNode stores the attributes and disk block location(s) of the object's data.
On many types of file system implementations, the maximum number of inodes is fixed at file system creation, limiting the maximum number of files the file system can hold.
Performance Counters:
- Inodes % Free
- Inodes Available
- Inodes Free
- Inodes Used
Default Alerts:
- % Free iNodes is less than 10%
Monitoring
This sensor requires standard access. (used by Linux monitor)
Docker Container Sensor
The sensor monitors basic statistics of the Docker container
The sensor uses Docker Engine REST API to communicate with the container.
Performance Counters:
- % CPU Usage
- % Memory Usage
- Interface bytes IN
- Interface bytes OUT
Statuses:
- State
- Uptime
Default Alerts:
- The container is not running - Alert generated when NetCrunch detects the container is not in the 'running' state.
Monitoring
To monitor the Docker container, you have to enable remote API.
To enable remote API:
-
Open /lib/system/system/docker.service file with any text editor
vi /lib/systemd/system/docker.service -
Find the line which starts with ExecStart and add -H=tcp://0.0.0.0:2375
ExecStart=/usr/bin/dockerd -H tcp://0.0.0.0:2375 -H unix:///var/run/docker.sock -
Save the Modified File
-
Reload the docker daemon
systemctl daemon-reload -
Restart the container
sudo service docker restart -
Open a port on the firewall if necessary.
-
To test that API is accessible, try to run test on the docker sensor, make sure you added that sensor to the proper node (just configured one)
Please note that enabling remote API on a different version of the docker and system where installed may look slightly different.
Monitoring VoIP/SIP Services
The sensor checks connectivity and validates the response of SIP service
Basic SIP Sensor
This Basic SIP sensor is configured to monitor connectivity or session initiation with SIP Server (SIP Phone System).
Monitored are an error code and response time for "OPTIONS" or "INVITE" request only.
In addition to the error code, the sensor returns a description of each error.
The sensor supports SIP platform services such as FreeSWITCH, Asterisk, OnSIP, FreeSWITCH Legacy, Asterisk Legacy.
Counters
- Response time
Alerts
- Invalid response
- Connection error
DICOM C-Echo Sensor
The Sensor checks connectivity and validates response from DICOM capable system
The C-ECHO DICOM sensor monitors the availability of DICOM capable by sending a C-ECHO request. In fact, this very similar to what does regular Ping, so it's also called often DICOM Ping. The sensor verifies the DICOM handshake protocol and checks if the target system is properly answering DICOM messages.
Parameters
- Calling EA Title
- Calling AE Title- The Application Entity (AE) that initiates the DICOM messaging service request. It is based on the Source DICOM Application Name. This parameter identifies the Application Entity (AE) that shall contain the requestor of the A-ASSOCIATE service. It is based on the Source DICOM Application Name.
- Called EA Title
- Called AE Title- The Application Entity (AE) that is the intended acceptor of the service request. It is based on the Destination DICOM Application Name. This parameter identifies the Application Entity that shall contain the intended acceptor of the A-ASSOCIATE service. It is based on the Destination DICOM Application Name.
Counters:
- Response time
Alerts:
- Alert on association rejected
- Invalid response
- Connection error
DICOM Query Sensor
The DICOM Query Sensor is designed to monitor the health and performance of a DICOM service. It performs a C-FIND query using configurable search filters (e.g., by patient, study, or other criteria) and verifies that the service responds correctly.
The sensor collects key metrics such as response time and total number of results, allowing operators to ensure the DICOM system is functioning and responsive.
The sensor is intended for monitoring and alerting, not for detailed query data analysis.
Parameters
- Connection
- Connections may be configured to use either regular DICOM or encrypted DICOM over TLS.
- Calling EA Title
- The Application Entity (AE) that initiates the DICOM messaging service request. It is based on the Source DICOM Application Name and identifies the requestor of the A-ASSOCIATE service.
- Called EA Title
- The Application Entity (AE) that is the intended acceptor of the service request. It is based on the Destination DICOM Application Name and identifies the acceptor of the A-ASSOCIATE service.
Query Description
You can build queries at the Patient, Study, or Series level: - Patient – filter by patient name or patient ID. - Study / Series – filter by ID or accession number, or build more flexible queries using patient, description, modality, or date.
Additionally, you can limit study results by date: - Today – return only records from the current day. - This month – return records from the current month.
Wildcards are supported for text fields such as patient name, study description, and similar string fields, allowing partial matches.
All search filters are optional. Leaving fields empty will return all results for that query level.
For example, you can query all studies for a selected patient with CT modality where the description contains the word “Contrast”.
Best Practices
- Choose filters to match realistic test cases.
- Avoid excessively broad filters that may return very large result sets and affect performance.
- Use a combination of filters to narrow results while still validating system functionality.
Counters:
- Response time - Response time in milliseconds
- Total Results - The number of records returned by the C-FIND query
Alerts:
- Alert on association rejected - the DICOM association request was rejected.
- No data returned by query - the query returned an empty result set.
- Slow Response - response time exceeds 50% above the latest average.
- Connection error - the DICOM service could not be reached.
Scripting Sensors
Netcrunch delivers hundreds of monitoring facilities such as monitoring packs and sensors, but we want you to be not limited to them. Script sensors are essentials in filling any gaps in delivering monitoring data to NetCrunch.
Unlike other systems, we do not force you to deliver data in one native data format, because there are thousands of scripts written for open source systems already. We want these scripts to be adaptable to NetCrunch, and this is the role of Data Parsers that are responsible for translating data returned by an external script to NetCrunch native format.
remote-ssh-script
Remote SSH Script Sensor
The Remote SSH Script Sensor in NetCrunch allows for the execution of scripts on remote machines via SSH, providing a powerful tool for remote system management and data collection.
Overview
This sensor is designed to remotely execute a script that is located on a target system. It utilizes an SSH connection to securely run the script, making it an ideal choice for managing and monitoring servers, network devices, and other systems in a secure and efficient manner.
Sensor Settings
Configuring the Remote SSH Script Sensor involves several key settings:
- SSH Connection and Credentials
Specify the details of the SSH connection, including the server address, port, and the necessary credentials (username and password or SSH key) for authentication. - Script Path
Define the exact path to the script on the remote system. Ensure the script is accessible and executable by the user provided in the SSH credentials. - Execution Timeout
Set a timeout period for the script execution. This prevents the script from running indefinitely and helps in managing resources effectively. - Optional Script Parameters
Enhance the flexibility of the script execution by adding parameters. These can be static values or dynamically mapped from node properties. To configure these parameters, refer to the script configuration window under 'Script Sensor' for comprehensive guidance.
Default Alerts
NetCrunch provides several pre-configured alerts for common issues that might arise during the sensor's operation:
- Connection Error
Triggered when the SSH connection to the remote machine fails. - Authentication Error
Occurs if there are issues with SSH credentials or permissions. - Script Execution Error
Alerts when the script fails to execute within the specified timeout or due to other errors during execution.
Available Alerts
Beyond the default alerts, NetCrunch offers additional alerting options to provide more granular monitoring:
- Monitoring Sensor Counter Alert
Get notified when specific sensor counters exceed predefined thresholds. - Status Change Event Alert
Trigger an alert when there's a change in object status, as determined by the Data Parser's output.
Counters
The Remote SSH Script Sensor provides valuable data points, including:
- Sensor/Script Execution Time
Measures the time taken for the script execution, aiding in performance analysis. - Data Parser Counters
Counters returned by the Data Parser, which can include a wide range of data points depending on the script's output and the parser's configuration. This feature transforms the raw output of the script into actionable metrics within NetCrunch.
By integrating the Remote SSH Script Sensor into your NetCrunch monitoring setup, you gain a versatile tool that extends the capabilities of your network monitoring, ensuring a more comprehensive and proactive management approach.
script
Script Sensor
The Script Sensor in NetCrunch is a dynamic tool designed to execute scripts or programs on the local NetCrunch Server machine and accurately process their results.
This sensor is adaptable and can be configured on any node within your network. However, it's important to understand that the script will always execute on the NetCrunch Server machine. This feature allows it to effectively poll data from remote machines, with the option to include various parameters like address and credentials in the script.
Supported Script Types
NetCrunch supports a wide range of script types, enhancing its versatility:
- JavaScript (NodeJS)
- Windows batch files (cmd, bat)
- VBScript
- PowerShell
- Python
- Commandline Applications (exe)
NetCrunch can automatically detect script type by file extension, or you can specify the type in sensor configuration. If the program can't detect script type, it will execute it using Windows shell.
Script Output Processing
The output from the script (stdout stream) is fed into a data parser. This can be a custom parser designed to adapt to your script's output, subsequently returning counters and statuses to NetCrunch. The script must be accessible to NetCrunch and located on the NetCrunch Server's local disk. Remember, the NetCrunch Server operates under the Local System Account, which requires the correct disk access permissions.
Additional Features
-
Output File Saving
The script's output can be saved to a file for NetCrunch to read and parse. This is enabled by checking the 'Read result from file' option and specifying the output file path. -
Script Parameters
Parameters can be included in the configuration window to map NetCrunch node properties to script parameters. This includes dynamically mapped parameters like node IP address ($address), node name ($name), and credentials ($credentials/...). For PowerShell, you have the option to pass credentials through a PSCredential object.
Counters:
NetCrunch provides counters for: - Sensor/Script Execution Time - Counters returned by selected Data Parser
Default alerts:
- Script Execution Error
Available Alerts:
Default and Available Alerts
NetCrunch automatically sets up default alerts for script execution errors. Additionally, you can set up alerts for:
- Monitoring Sensor Counter: Triggered when specific sensor counters exceed predefined thresholds.
- Object Status Change: Occurs when there's a change in object status, as determined by the Data Parser.
Passing Arguments to the Script
Arguments to the script can be passed using parameters in the configuration window. These parameters allow you to map NetCrunch node properties to script parameters, facilitating dynamic data collection and interaction with various network components.
- $address
- node IP address
- $name
- node name
- $credentials/...
-
profile path (you can use only one profile per sensor):
$credentials/windows/<name>/<property>,
where profileName is optional, for example- $credentials/windows/default/user - user from Windows Default credentials profile
- $credentials/windows/user - user name from Windows credentials profile used by Windows monitor
You can pass credentials to Windows PowerShell via PSCredential object by checking the option 'Pass credential through PSCredential object' and providing parameter.
Prerequisites and Limitations
-
Prerequisites
Depending on the script type, specific prerequisites need to be fulfilled (e.g., installing NodeJS for JavaScript, Python for Python scripts, and setting PowerShell execution policies for PowerShell scripts). -
Limitations
Due to the resource-intensive nature of external scripting sensors, the number of concurrent scripting processes running on the NetCrunch Server is limited to 5. This is to ensure optimal performance and stability of the system.
Monitoring Windows Updates and Pending Reboots
windows-updates
Windows Updates Sensor
The sensor monitors the status of Windows updates on a computer. Counts installed updates, updates available to install, and not installed updates. Allows triggering an alert if the installation of the update fails or when no update has been installed for a given time.
The minimum monitoring time for the sensor is 1 hour. Because the state of the Windows updates is rare, the recommended monitoring time is one day. You can check the current status of updates on System Views.
Querying for a list of updates may take a significant amount of time.
Settings
- Windows credentials
- Remote PowerShell port
Alerts
- Alert if the installation of the updates failed
- Alert when the updates were not installed for a long time
- Alert on authentication error
- Alert on connection error
Counters
- Updates\Installed
- Updates\Not Installed
- Updates\Reboot Required
Each object has instances
- Critical,
- Important,
- Moderate,
- Low,
- Unspecified,
- _Total
Categories of updates presented in NetCrunch may differ from their Windows Update counterparts. For example, Windows lists all Security and Critical as 'Important' while NetCrunch shows the severity of each update individually (Important, Critical, Low, etc.) Read more here Windows Update
pending-reboot
Pending Reboot Sensors
This sensor checks a Windows machine for pending reboots using WMI. To use it, you need valid credentials for the monitored Windows machine.
Statuses
-
Pending Reboot (Contains information about reboot reasons)
- Windows Update Pending
- CBS Update Pending (read more about Servicing Stack Updates]
- Domain Join Pending
- File Rename Pending
Default Alerts
- Alert on pending reboot
- This alert is generated if any of updates mentioned above occur. You can edit it with the expression editor to choose reboot reasons that will cause the alert.
Credentials
Any valid credentials to the monitored Windows machine, allowing for access to the registry.
Scheduled Tasks on Windows
This view is available for all Windows machines. It contains extensive information about tasks on a given machine.
Tasks can be divided by multiple filtering options - state, when they are scheduled or in which folder they are located.
Accessing this view requires no additional configuration on a NetCrunch or server-side.
Each task contains information such as:
- Path
- Name
- Created by (if applicable)
- State (success, disabled, etc.)
- Next Run (if applicable)
- Triggers (At logon, Daily, etc.)
Additionally - Failed tasks will be marked by a red color.
It's effortless to search for a particular task using the search box in the top right corner.
Palo Alto Firewall Sensor
Palo Alto Firewall sensor monitors IPSec site-to-site VPN tunnels configured on the Palo Alto device. By default, the sensor alarms when the state of any tunnel becomes non-active. It also allows for the monitoring of specific tunnels.
The sensor gathers traffic metrics for each tunnel. Depending on the system configuration, system-provided metrics are also available for monitoring.
Options
The sensor uses Palo Alto PAN-OS API and needs the correct credentials.
If the sensor is properly configured, you can see detailed information about configured IPSec Site-to-site tunnels on Node Status in node System Views.

Alerts
- Site-to-Site VPN tunnel is not active
- Alert on authentication error
- Alert on connection error
Reports
- Site-to-Site VPN Report
NetApp SANtricity Sensor
This sensor allows monitoring of the overall health status and performance of NetApp storage using SANtricity REST API.
SANtricity is a data management software that powers and administers the NetApp E-Series ad and EF-Series storage arrays. The sensor collects various performance metrics and checks the current status of Storage Polls, Volumes, Controllers, Drives, and Workloads. The sensor also checks the overall system health status.
Options
SANtricity REST API is using HTTP basic authentication. You need to pass the username and password.
Alerts
- Storage array is not optimal
- Health check failed
- Interface link status is other than Up
- Host initiator is not active
- Drive status is not optimal
- Storage Pool status is not optimal
- Controller status is not optimal
- CPU Utilization is high
- Drive endurance used > 70%
- There are no hot spare drives, or some spare drive is used
Default alerts are defined for each instance of a given subassembly. You may configure your own alerts depending on your storage system specifications.
Reports (Data Collectors)
The sensor provides a large number of metrics, observing which allows for an accurate diagnosis of the storage system. By default, the sensor adds reports containing the most important metrics about Volumes (IOPS, transfer speed statistics, cache utilization), Drives (temperature, endurance used), Hot spare drives usage, and more.
HPE 3PAR StoreServ Sensor
The sensor allows monitoring of the performance of HPE 3PAR StoreServ storage using Web Services API.
Using this sensor you can monitor the state and utilization statistics of the storage objects:
- Common Provisioning Groups (CPGs)
- Disk Cages
- Virtual Volumes
- Physical Disks
- Ports
Requirements
HPE 3PAR Web Services API (WSAPI) must be configured and enabled on the monitored device.
Options
You need to pass your username and password. Use the same username and password that you use to access the 3PAR storage server through the 3PAR CLI or SSMC.
Alerts
- State of any Volume, CPG, Disk, or Port indicates a problem
- Free space is low
- Disk temperature is high
- Remote Copy is in an invalid state
By default, alerts are defined for each Volume, CPG, etc. You may configure your own alerts depending on your storage system specifications.
Reports (Data Collectors)
By default, the sensor adds reports containing metrics for used space of monitored Volumes, CPGs, and storage capacity.
Veeam Backup and Replication Sensor
This sensor allows monitoring of the state of all Veeam jobs and the capacity of backup repositories.
This sensor will notify you when any backup or replication task fails or completes with warnings. The sensor monitors the capacity of your backup repositories and notifies you when the amount of available space in any repository is low.
Requirements
The Veeam Backup Enterprise Manager with Enterprise Plus license must be installed on the monitored system.
Options
By default, Veeam Backup Enterprise Manager REST API uses HTTPS on the 9398 port. You need to pass the username and password to Veeam Backup Enterprise Manager REST API.
Alerts
- Job finished with error
- Job finished with warning
- Low free space in the backup repository
Reports (Data Collectors)
- Jobs Report - containing Job runs statistics metrics
- Repositories Report - containing repositories capacity utilization metrics
NetApp ONTAP Sensor
This sensor allows monitoring of the health and performance of NetApp storage components using ONTAP REST API.
ONTAP data management software offers unified storage for applications that read and write data over file-access protocols. ONTAP implementations run on NetApp-engineered FAS or AFF appliances, on commodity hardware (ONTAP Select). The sensor checks the current status of Storage components, Volumes, LUNs, Disks, Interfaces, Nodes, and Ports. The sensor alarms in case of degradation of any of the components. The sensor also collects metrics for IOPS, Throughput, Latency, and storage capacity.
Requirements
The monitored device must be NetApp storage with ONTAP version 9.6 or later.
Options
ONTAP REST API is using HTTP basic authentication. You need to pass your username and password.
Alerts
By default, the sensor alerts when any of:
- Disk is broken
- LUN status is other than Online
- LUN free space is low
- Volume has a problem - the volume has any inconsistencies or bad blocks, or its status is other than online
- Volume free space is low
- Interface is Down
- Controller node is in error state
Depending on your needs, you may also define alerts on Ethernet ports, Fibre Channel ports, storage ports, and storage shelves.
Reports (Data Collectors)
By default, the sensor adds reports containing metrics for Cluster (IOPS, Throughput, Latency), Bytes transmitted over storage interfaces, LUNs and Volumes used space, and more.
Windows Configuration - Hardware, Software, Hotfixes
NetCrunch can collect information about Windows machines' hardware, installed software, and hotfixes.
hardware
Hardware
The sensor allows monitoring of the hardware configuration of Windows machines using WMI.
Using this sensor, you can download and monitor for changes in the hardware configuration of Windows-based hosts. The hardware configuration includes the following:
- Processor
- Memory
- Storage
- Video
- Monitors
Requirements
The Windows monitor automatically adds the sensor. It requires access to WMI regardless of Windows monitoring type. It uses a Windows credential profile. No additional configuration is required.
Options
You may change scheduling options.
Alerts
- Hardware config changed
Alert is added to the Basic Windows Monitoring pack by default.
Views
After choosing the Hardware in the Nodes tab, the sensor presents the data for multiple nodes in the Nodes tab.

The last changes and the list of installed hardware can be found in Node StatusSystem ViewsHardware
software
Software
The sensor collects information about installed software and can alert you when installed, uninstalled, or updated applications are installed. Also, thanks to the sensor, you can easily see the summary of installed software (per node group) on versions and find where it is installed. The last changes and the list of installed software can be found in Node StatusSystem ViewsSoftware
The sensor requires access to WMI on the destination computer.
Software Summary

hotfix
Hotfixes
The sensor collects information about installed hotfixes and can alert you when hotfixes are installed or uninstalled. You can find the latest changes and the list of installed software in Node Status System Views Hotfixes. This sensor requires access to WMI on the destination computer.
Software View for Nodes
It shows you a summary of recent changes for software and hotfixes.

NAKIVO Backup and Replication Sensor
The sensor integrates with NAKIVO Backup & Replication by polling its REST API. It collects repository state, backup storage usage, and job/task statistics to monitor system health and performance.
What It Does
The NAKIVO Backup and Replication Sensor enables NetCrunch to monitor the operational state of a NAKIVO Backup & Replication system. It provides:
- Real-time visibility into backup job execution (running, failed, stopped)
- Status and capacity of backup repositories
- Backup storage usage trends
- Current task queue status
This sensor is critical for ensuring that backup operations remain healthy, reliable, and within capacity.
Why It Matters
Backups are the last line of defense against data loss. Issues like failed jobs, corrupted repositories, or full storage can silently compromise recovery capabilities. This sensor helps to:
- Detect critical issues before backups fail
- Monitor resource usage trends (repository and storage)
- Alert on operational degradation (e.g., repository in invalid state)
- Maintain readiness for disaster recovery
By actively polling the NAKIVO system, NetCrunch ensures consistent visibility without relying on external triggers or agents.
How It Works
Integration Model
NetCrunch acts as a polling client, regularly sending REST API requests to the NAKIVO server. The sensor does not require any agents or NAKIVO-side configuration beyond API access.
- Protocol: HTTPS
- Port: 4443 (default)
- Authentication: Username and password required
- Data Source: NAKIVO’s REST API
Collected Metrics
-
Repository
- Health status (e.g., valid, invalid)
- Capacity (total and free)
- Free space percentage
-
Job Statistics
- Number of jobs currently running
- Number of failed jobs
- Number of stopped jobs
-
Backup Storage
- Used vs. free space
- Trend tracking (via data collectors)
-
Task Queue
- Count of pending tasks
- Execution load indicators
Default Alerts
The sensor includes key predefined alert triggers:
- Repository free space < 10%
- Some jobs failed
- Repository is in invalid state
All alert thresholds are customizable and can be extended via standard performance/event conditions in NetCrunch.
Data Collectors
To support historical reporting and analysis, the sensor enables:
- Backup Storage Report
- Task
Monitoring of Device Configuration
Powerful module that enables comprehensive monitoring and storage of configuration changes across a diverse range of network devices, including switches, routers, firewalls, and other equipment
Device Config Sensor
The sensor enables tracking changes to device configurations and stores multiple backups of device configurations using the telnet or ssh protocol.
The sensor allows monitoring and backup device configurations using the telnet or ssh protocol. It can detect configuration changes and allows storing multiple configuration versions. The sensor provides over 140 predefined device profiles. It supports a wide range of devices, including switches, routers, firewalls, and security devices.
It compares each version and stores the whole configuration in an encrypted database. When the sensor runs as part of the monitoring probe, it stores the latest configuration on the probe's hard drive, and history is kept in the central NetCrunch database.
Options
You should provide proper credentials besides typical connection settings such as connection parameters (port and timeout). A credential profile for SSH allows establishing a connection using a private key or with a username and password.
- Protocol
- Supported protocol is
ssh2ortelnet.Some device models might support only one of them. - Config versions to retain
- NetCrunch can keep up to 999 versions per device. The default is 10.
- Enable mode
- Many devices require switching into
enablemode to perform specific commands. Additionally, a password might be needed after issuing theenablecommand. Please refer to your device documentation. - Enable password
- Enter the password that will be supplied to the device after the
enablecommand. Keep empty if not required., - Hide secrets
- Most device profile provides the ability to hide secrets by replacing passwords and keys with
<secret hidden>text
Alerts
- Alert if device config changed - Triggered if any configuration change is detected
- Alert on authentication error- alert triggered when the connection was successful, but the login process failed
- Alert on connection error- alert triggered when the device was not responding
- Alert on Performance Threshold - set threshold on available counter values
Performance Metrics
- Device Config.Sensor/Check Time - Sensor execution time in milliseconds
- Device Config.Config/Size in bytes - Size of configuration obtained
- Device Config.Config/Changes - Number of changes since the last configuration saved
Predefined Device Profiles
Browse 180+ ready-to-use config profiles for the most popular vendors and device types
A10 Networks
- ACOS (ssh, telnet)
Accedian Performance Elements (NIDs)
- AEN (ssh)
Adtran
- Total Access (AOS) (ssh)
Alcatel-Lucent
- AOS (ssh, telnet)
- AOS7 (ssh, telnet)
- ISAM (ssh, telnet)
- SR OS (Formerly TiMOS) (ssh, telnet)
Allied Telesis
- Alliedware Plus (ssh, telnet)
- AT-8000S, AT-8000GS series (ssh, telnet)
Arbor Networks
- OS (ssh)
Arista
- EOS (ssh, telnet)
Aruba
- AOS-CX (ssh, telnet)
- AOSW (ssh, telnet)
AudioCodes
- AudioCodes (ssh, telnet)
- MediaPack MP-1xx, Mediant1000 (ssh, telnet)
Avaya
- VOSS (VSP Operating System Software) (ssh, telnet)
- BOSS (Baystack Operating System Software) (ssh, telnet)
Brocade
- FabricOS (ssh, telnet)
- FastIron (ssh, telnet)
- IronWare (ssh, telnet)
- NOS (Network Operating System) (ssh, telnet)
- Vyatta (ssh, telnet)
- 6910 (ssh, telnet)
- SLX-OS (ssh, telnet)
Calix
- AXOS (ssh)
Casa
- Casa (ssh, telnet)
Centec Networks
- CNOS (ssh, telnet)
Check Point
- GaiaOS (ssh)
Ciena
- SAOS (ssh, telnet)
Cisco
- ACSW (ssh, telnet)
- AireOS (ssh, telnet)
- ASA (ssh)
- AsyncOS (ssh)
- CatOS (ssh, telnet)
- FireLinuxOS (ssh)
- IOS (ssh, telnet)
- IOSXR (ssh, telnet)
- NGA (ssh)
- NXOS (ssh, telnet)
- SMA (ssh)
- SMB (Nikola series) (ssh, telnet)
- UCS (ssh, telnet)
Citrix
- NetScaler (Virtual Applicance) (ssh)
Coriant (former Tellabs)
- TMOS (8800) (ssh, telnet)
- 8600 (ssh, telnet)
- Groove (ssh)
ComNet
- ComNet Microsemi Switch (ssh, telnet)
Comtrol
- RocketLinx (ssh, telnet)
Cumulus
- Linux (ssh, telnet)
DataCom
- DmSwitch 3000 (ssh, telnet)
DCN
- DCN (ssh, telnet)
DELL
- PowerConnect (ssh, telnet)
- AOSW (ssh, telnet)
- DellX (ssh, telnet)
- Dell EMC Networking OS10 (ssh, telnet)
D-Link
- D-Link (ssh, telnet)
ECI Telecom
- ECIapollo (ssh, telnet)
EdgeCore
- ECS3510, ES3528M (ssh, telnet)
- ECS3510, ES3526XA-V2, ES3528M (ssh, telnet)
Eltex
- Eltex (ssh, telnet)
Ericsson/Redback
- IPOS (former SEOS) (ssh, telnet)
Extreme Networks
- Enterasys B/C-Series (ssh)
- Enterasys 800-Series (telnet)
- WM (ssh, telnet)
- XOS (ssh, telnet)
- ExtremeWare (ssh, telnet)
F5
- TMOS (ssh)
Fiberstore
- S3800 (ssh, telnet)
- S3900 (ssh, telnet)
- S5800 (ssh, telnet)
- S5850 (ssh, telnet)
Firebrick
- FBxxxx (ssh, telnet)
Force10
- DNOS (ssh, telnet)
- FTOS (ssh, telnet)
FortiGate
- FortiOS (ssh, telnet)
Fujitsu
- PRIMERGY Blade switch 1/10Gbe (ssh, telnet)
GCOM Technologies
- Broadband Network Platform Software (ssh, telnet)
Hatteras
- Hatteras (ssh, telnet)
Hillstone Networks
- StoneOS (ssh, telnet)
Hirschmann
- HiOS (ssh, telnet)
HP
- Comware (HP A-series, H3C, 3Com) (ssh, telnet)
- Procurve (ssh, telnet)
- BladeSystem (Onboard Administrator) (ssh, telnet)
- MSA (ssh)
- MSM (Wireless Controller) (ssh)
Huawei
- VRP (ssh, telnet)
- SmartAX series (ssh, telnet)
Icotera
- 6400 series (ssh)
Juniper
- JunOS (ssh, telnet)
- ScreenOS (Netscreen) (ssh, telnet)
LANCOM Systems GmbH
- LCOS (ssh, telnet)
Linuxgeneric
- CentOS (ssh, telnet)
Mellanox
- MLNX-OS (ssh)
- Voltaire (ssh)
Mikrotik
- RouterOS (ssh, telnet)
Motorola
- RFS (ssh, telnet)
MRV
- MasterOS (ssh, telnet)
- FiberDriver (ssh)
Netgear
- Netgear switches (ssh, telnet)
Netonix
- WISP Switch (As Netonix) (ssh)
Nokia (formerly TiMetra, Alcatel, Alcatel-Lucent)
- SR OS (TiMOS) (ssh, telnet)
OneAccess
- OneOS (ssh, telnet)
- TDRE (ssh, telnet)
OpenBSD
- OpenBSD (ssh, telnet)
Opengear
- Opengear (ssh)
OpenWRT
- default (ssh)
OPNsense
- default (ssh)
Palo Alto
- PANOS (ssh)
PLANET SG/SGS Switches
- default (ssh, telnet)
pfSense
- default (ssh)
Pure Storage
- PurityOS (ssh)
Radware
- AlteonOS (ssh)
Raisecom
- Raisecom (ssh)
QTECH
- QSW-2800, QSW-3400, QSW-3450, QSW-3500 (ssh, telnet)
Quanta
- Quanta / VxWorks 6.6 (1.1.0.8) (ssh, telnet)
Siklu
- EtherHaul (ssh)
SonicWALL
- SonicOS (ssh)
SNR
- SNR-S300G, S2xxx, S3xxx, S4xxx (ssh, telnet)
Speedtouch
- Thomson Speedtouch (telnet)
Supermicro
- SSE-G2252, G2252P (ssh, telnet)
Symantec
- Blue Coat ProxySG/Security Gateway OS (SGOS) (ssh, telnet)
Telco Systems
- Telco Systems T-Marc 3306 (ssh, telnet)
Trango Systems
- Trango (telnet)
TPLink
- TPLink (ssh, telnet)
- TL-SL5428 (ssh, telnet)
- TL-SL3428 (ssh, telnet)
Ubiquiti
- AirOS (ssh)
- Edgeos (ssh, telnet)
- EdgeSwitch (ssh, telnet)
- AirFiber (ssh, telnet)
Watchguard
- Fireware OS (ssh)
Westell
- Westell 8178G, Westell 8266G (telnet)
Zhone
- Zhone (OLT and MX) (ssh, telnet)
ZTE
- C300&C320 OLT (ssh, telnet)
Zyxel
- ZyNOS GS-series variant (ssh, telnet)
- NDMS (telnet)
Custom Device Config Profiles
NetCrunch allows creating custom profiles using simple YAML definitions, allowing executing commands using ssh or telnet, and processing output
NetCrunch config management engine has been inspired by the Oxidized open source project and uses similar concepts to describe session parameters and processing of command output.
Although there are important differences.
- We decided to describe device profiles in a declarative way, so no programming is needed
- Regular expressions are processed in JavaScript
The only knowledge needed to describe the device configuration profile is a strong understanding of regular expressions.
Setting prompt
The prompt format is needed to recognize when the terminal is ready to read the next command and when the previous command's output ends. You can set one or multiple prompt expressions.
Single prompt
prompt: "/^(\r*[\w\s.@()/:-]+[#>]\s?)$/m"
Multiple prompts
   prompt:
      - /^(?:\x1b[..h)?[\w.-]+# $/m
      - /^\w+@\w+([-.]\w+)*>((?.+)?\s)?/m
Setting comment
This is a comment prefix that will be added to some command output, such as show version
comment: "# "
In the above case, we have defined a two-character prompt prefix # and a single space.
Output processing block
After each command, we can describe how to process the output.
     lines:
        range: 1..-1
        reject:
          - /^\r$/
          - /time/
        comment:
In the above example, the engine will:
- remove the first and last line (range: 1..-1)
- skip empty lines (reject) and the ones containing the time phrase
- comment out all output
Processing for all commands
It starts with all: and then you can describe the processing block for every command. It's common to remove the first and the last line.
all:
  lines:
    # always cut off first and last line
    range: 1..-1
Processing secrets
We can download the config as is or remove secrets such as passwords, security key, and others, by replacing them with some text.
The processing depends on the option state when configuring the Device Config sensor for a particular node.
  secret:
     /^(create snmp community) \S+/gm: "$1 <removed>"
     /^(create snmp group) \S+/gm: "$1 <removed>"
Defining commands to be executed
It's simple. In commands: block add each command, and after it, describe processing if needed.
Command output commented
commands:
   show inventory:
     comment:
Command with processing block
 commands:
     show version:
         lines:
            reject:
                - /([Ss]ystem [Uu]p\s?[Tt]ime|[Uu]p\s?[Tt]ime is \d)/
            comment:
Regular command with full output
 commands:
     "show running-config | nomore":
Session and protocol configuration
The configuration block begins with config:. Then the block is described by the protocol list it references.
Telnet
Telnet is sometimes the only way to reach the device. It requires setting regular expressions to detect prompts for username and password.
    telnet:
       #set prompts for interactive telnet login
       login:
          username: /Username:/
          password: /Password:/
SSH
SSH specific
  ssh:
    #terminal options
    pty:
        charsWide: 1000
Exec mode
Commands can be executed in an interactive session or in exec mode. To enable exec mode, add
ssh:
   exec: true
Command to be executed at the beginning and the end of the session
ssh, telnet:
   # commands to be executed after login
    afterLogin:
       - "no page"
   # Commands to execute before logout
   beforeLogout:
       - logout
         y
         n
Handling interactive prompts
Many devices allow disabling paging by issuing a command after login or by adding a pipe to the command, but some lack this feature. For such an occasion, you can define regular expressions for watching the terminal output and the reaction that is usually sent for one character.
For example
expect:
   /Press any key to continue(\x1b[\??\d+(;\d+)[A-Za-z])$/m:
       send: " "
       replace: ""
If the message appears, the program will send a single space and then remove the prompt from the output.
Cloud Monitoring
Azure API Management Sensor
Azure API Management sensor allows you to monitor the performance and behavior of the Azure API Management service. Azure API Management is a reliable, secure, and scalable way to publish, consume and manage APIs running on the Microsoft Azure platform.
This sensor provides information on API Management metrics, such as Requests and Utilization which includes Backend on Getaway Requests Duration [ms], Percentage of Metric Capacity as well as EventHub metrics with visibility of Dropped, Rejected, Throttled, Timed Out Events or Events Size [bytes], among others. Thanks to this sensor you'll be able to have insight into the utilization of APIs and monitor API Management Service ensuring optimal performance.
Options
This sensor requires credentials for Azure subscription (Application (Client) ID, Tenant ID, and Client Secret Value).
Alerts
- Capacity Utilization > 70%
Performance Metrics
- Requests and Utilization\Backend Requests Duration [ms] - Average duration of backend requests [ms]
- Requests and Utilization\% Metric Capacity - Average percentage of metric utilization
- Requests and Utilization\Gateway Requests Duration [ms] - Getaway requests duration (Miliseconds average)
- Requests and Utilization\Gateway Requests - Gateway request metrics. Possible dimensions: Location, Hostname, LastErrorReason, BackendResponseCode, GatewayResponseCode, BackendResponseCodeCategory, GatewayResponseCodeCategory
- Event Hub\Dropped Events - Number of events skipped due to reached queue size limit
- Event Hub\Rejected Events - Number of rejected EventHub events (wrong configuration or unauthorized)
- Event Hub\Successful Events - Number of successful EventHub events
- Event Hub\Throttled Events - Number of throttled EventHub events
- Event Hub\Timed Out Events - Number of timed out EventHub events
- Event Hub\Events Size [bytes] - Total size of EventHub events [bytes]
- Event Hub\Events Sent - Number of events sent to EventHub
- Event Hub\Total Failed Events - Number of failed EventHub events
- Network\Network Connectivity - Average count of Network Connectivity statuses of dependent resource types from API Management service
Reports (Data Collectors)
By default, the sensor adds a report containing Requests and Utilization\% Metric Capacity, Requests and Utilization\Gateway Requests Duration [ms], and Requests and Utilization\Gateway Requests charts. These metrics will be collected and available as a report or through Performance Trend Viewer.
Azure Cosmos DB Sensor
This sensor monitors Azure Cosmos Database Service using Azure Monitor metrics.
Azure CosmosDB Sensor monitors service availability and alerts you when availability drops. The sensor collects service usage metrics such as the number of requests, RU consumed for requests, and more. You can set the RU consumption percentage alert based on your requirement.
Requirements
This sensor requires credentials for Azure subscription (Application (Client) ID, Tenant ID, and Client Secret Value).
Options
The sensor monitor only one, specified Cosmos DB Account.
Alerts
- Average Service Availability < 100%
Performance Metrics
The sensor collects metrics about service usage and performance, eg:
- Performance\% Avg. Service Availability
- Performance\Avg. Replication Latency [ms]
- Performance\Avg. Server Side Latency [ms]
- Requests\Request Count
- RU\% Normalized RU Consumption
You can also detect configuration changes by defining an alerts on a change of configuration metrics eg:
- Configuration\Provisioned Throughput
- Configuration\Autoscale Maximum Throughput
- Table\Throughput Updated
Depending on the account data model (Cassandra, Azure Table, etc.) list of available sensor metrics may differ.
Reports (Data Collectors)
By default, the sensor adds a report containing Average Server Side Latency [ms], % Service Availability, Request Count, % Normalized RU Consumption, and Request Charges charts. These metrics will be collected and available as a report or through Performance Trend Viewer
Azure Cost Sensor
The sensor monitors the estimated cost of resources in Azure subscription, and the progress of expenses within budgets defined in Azure subscription.
The sensor reads all budgets defined in the Azure subscription and, by default, alarms when some budget has been used up above 80%. You can also define your own alerting rules for any budget.
The sensor calculates the estimated subscription costs for the current billing period. You can define an alert when the current cost exceeds a certain value. Alerts can also be defined for costs generated by selected resources or resource groups.
Both current cost and budget status can be represented with Object Status Widgets.
Requirements
This sensor requires credentials for Azure subscription (Application (Client) ID, Tenant ID, and Client Secret Value) with a custom role with permissions:
- Microsoft.Consumption/*/read
- Microsoft.CostManagement/*/read
Options
You need to choose an Azure subscription and the starting day of the monthly billing period. By default, the sensor is run once a day as recommended in Microsoft's documentation.
Alerts
- Alert on budget spend progress
- Alert on the total cost
- Alert on resource group cost
Azure Insights Components
Azure Insights Components Sensor monitors Azure Insights Components resource, using Azure Monitor metrics. Application Insights is a feature of Azure Monitor and an extensible Application Performance Management (APM) service. You can use it to monitor your live applications. It will automatically detect performance anomalies and includes powerful analytics tools to help in diagnosing issues and understanding what users do with the app.
While the request is being sent to the monitored Azure resource, Insights Components helps track down a timeout which is caused by an unsuccessful network call attempt, a long time between receiving the last byte of the document, or long time between the network connection and receiving the first byte. Azure Insights Components Sensor allows us to maintain various statistics e.g. what exceptions and failures have occurred, what was the number of page views but also count of calls made by the application to external resources.
Options
This sensor requires credentials for Azure subscription (Application (Client) ID, Tenant ID, and Client Secret Value).
Alerts
- Availability Tests have not been successfully completed
- Browser Uncaught Exceptions > 5
- Total Uncaught Exceptions > 10
- Server Uncaught Exceptions > 5
- Process CPU > 90%
Performance Metrics
- Availability Tests\% Completed successfully - Average percentage of successfully completed availability tests
- Availability Tests\Tests Number - Number of availability tests
- Availability Tests\Test Duration - Availability test duration in milliseconds
- Browser Timings\Network Duration - Average time in milliseconds between user request and network connection.
- Browser Timings\Processing Duration - Average time in milliseconds between receiving the last byte of a document until the DOM is loaded.
- Browser Timings\Receive Duration - Average time in milliseconds between the first and last bytes, or until disconnection.
- Browser Timings\Send Duration - Average time in milliseconds between the network connection and receiving the first byte
- Browser Timings\Avg. DOM Duration - Average time in milliseconds from user request until DOM is fully loaded
- Dependencies\Number of Calls - Number of calls made by the application to external resources
- Dependencies\Duration of Calls - Average duration of calls made by the application to external resources in milliseconds
- Dependencies\Calls Failed - Number of failed dependency calls made by the application to external resources
- Exceptions\Browser Uncaught Exceptions - Count of uncaught exceptions thrown in the browser
- Exceptions\Total Uncaught Exceptions - Total number of uncaught exceptions
- Exceptions\Server Uncaught Exceptions - Number of uncaught server exceptions
- Page Views\Count - Number of page views
- Page Views\Load Time [ms] - Average page view load time in milliseconds
- Performance\Exception Count Per Second - Average count of handled and unhandled exceptions reported to windows
- Performance\Available Memory Bytes - Average Physical memory immediately available for allocation to a processor for system use in bytes
- Performance\% Process CPU - Average percentage of elapsed time that all process threads used the processor to execute instructions.
- Performance\Process IO rate bytes\sec - Total bytes per second read and written to files, network, and devices
- Performance\% Processor Time - Average percentage of time that the processor spends in non-idle threads
- Performance\Process Private Bytes - Average memory in bytes exclusively assigned to the monitored application's processes
- Performance\Request Execution Time - Most recent HTTP request execution average time in milliseconds
- Performance\Requests in Application Queue - Average count of HTTP requests in the application queue
- Performance\HTTP Request Rate\sec - Average rate of HTTP requests per second
- Requests\Server Completed Requests - Number of completed server requests
- Requests\Server Response Time - Average server response time in milliseconds
- Requests\Failed Requests - Count of failed requests
- Requests\Server Request Rate\sec - Average rate of server requests per second
- Requests\Traces Count - Trace document count
Reports (Data Collectors)
By default, the sensor adds a report containing Page Views\Count, Page Views\Load Time [ms], Performance\Available Memory Bytes, Requests\Server Completed Requests, and Requests\Failed Requests charts. These metrics will be collected and available as a report or through Performance Trend Viewer
Azure Load Balancer Sensor
The sensor monitors Azure Load Balancer resource, using Azure Monitor metrics.
Azure Load Balancer Sensor helps track health probe status per time duration, which is very important in case of scaling error. It also helps verify if a number of SNAT ports is set properly or whether the data path is available.
Options
This sensor requires credentials for Azure subscription (Application (Client) ID, Tenant ID, and Client Secret Value).
Alerts
- Bytes Transmitted < 1MB
- Packets Transmitted < 1000
Performance Metrics
- Diagnostic\Allocated SNAT Ports - Total number of SNAT ports allocated within the time period
- Diagnostic\SNAT Connections Created - Total number of new SNAT connections created within the time period
- Diagnostic\SYN Packets Transmitted - Total number of SYN Packets transmitted within a time period
- Diagnostic\Used SNAT Ports - Total number of SNAT ports used within a time period. SNAT enables IP masquerading of the backend instance. This masquerading prevents outside sources from having a direct address to the backend instances.
- Diagnostic\Bytes Transmitted - Total number of Bytes transmitted within a time period
- Diagnostic\Packets Transmitted - Total number of Packets transmitted within a time period
- Health\Dynamic IP Addresses Available - Standard Load Balancer uses a distributed health-probing service that monitors your application endpoint's health according to your configuration settings. This metric provides an aggregate or per-endpoint filtered view of each instance endpoint in the load balancer pool. You can see how Load Balancer views the health of your application, as indicated by your health probe configuration.
- Health\Virtual IP Addresses Available - Average Load Balancer data path availability per time duration
Azure Logic Apps Sensor
Azure Logic Apps sensor allows you to monitor the performance and behavior of the Microsoft Cloud technology called Azure Logic Apps. Azure Logic Apps is a service in Microsoft Cloud that allows you to schedule, automate, and orchestrate tasks, business processes, and workflows when you need to integrate apps, data, systems, and services across enterprises or organizations.
The sensor allows monitoring of Azure Logic Apps usage in terms of performance and resources used. Thanks to this sensor, you'll be able to ensure the optimal performance of Logic Apps workflows and troubleshoot problems if they occur.
Requirements
This sensor requires credentials for Azure subscription (Application (Client) ID, Tenant ID, and Client Secret Value).
Alerts
- Alert on Any Action Failed - Alert on number of failed workflow actions > 0
- Alert on % Runs Failed - Percentage of failed workflow runs > 5%
- Alert on Any Run Failed - Number of failed runs > 0
- Alert on Any Trigger Failed - Number of failed triggers > 0
Performance Metrics
- Action\Avg. Action Latency [sec] - Average latency of completed workflow actions
- Action\Actions Completed - Number of completed workflow actions
- Action\Actions Failed - Number of failed workflow actions
- Action\Actions Skipped - Number of skipped workflow actions
- Action\Actions Started - Number of started workflow actions
- Action\Actions Succeeded - Number of succeeded workflow actions
- Action\Avg. Action Success Latency [sec] - Average latency of succeeded workflow actions in seconds
- Action\Throttled events - Number of workflow action throttled events
- Billing\Billable Action Executions - Number of workflow action executions getting billed
- Billing\Billable Trigger Executions - Number of workflow trigger executions getting billed
- Billing\Billable Native Operation Executions - Number of native operation executions getting billed
- Billing\Billable Standard Connector Usage - Number of standard connector executions getting billed
- Billing\Billable Storage Consumption Usage - Number of storage consumption executions getting billed.
- Billing\Billable Executions - Number of workflow executions getting billed
- Run\% Runs Failed - Percentage of failed workflow runs
- Run\Avg. Run Latency [sec] - Average time in seconds between when a run starts an when it ends
- Run\Runs Cancelled - Number of cancelled runs
- Run\Runs Completed [bytes] - Number of completed runs in bytes
- Run\Runs Failed - Number of failed runs
- Run\Runs Started [bytes] - Number of runs started in that minute in bytes
- Run\Runs Succeeded - Number of successfully completed runs
- Run\Run Start Throttled Events - Number of workflow run start throttled events
- Run\Avg. Run Success Latency [sec] - Average time in seconds between start and end for the successful runs
- Run\Run Throttled Events - Number of throttled events for workflow action or trigger
- Trigger\Avg. Trigger Fire Latency [sec] - Average latency in seconds of fired workflow triggers
- Trigger\Avg. Trigger Latency [sec] - Average latency in seconds of completed workflow triggers
- Trigger\Triggers Completed - Number of completed triggers
- Trigger\Triggers Failed - Number of failed triggers
- Trigger\Triggers Fired - Number of fired triggers
- Trigger\Triggers Skipped - Number of skipped triggers
- Trigger\Triggers Started - Number of started triggers
- Trigger\Triggers Succeeded - Number of successful triggers
- Trigger\Avg. Trigger Success Latency [sec] - Average latency in second of succeeded workflow triggers
- Trigger\Trigger Throttled Events - Number of throttled events for trigger
Reports (Data Collectors)
By default, the sensor adds a report containing Action\Actions Completed, Action\Actions Failed, Action\Actions Succeeded, Run\Runs Completed [bytes], Run\Runs Started [bytes], Trigger\Triggers Completed, Trigger\Triggers Failed, Trigger\Triggers Started and Run\% Runs Failed charts. These metrics will be collected and available as a report or through Performance Trend Viewer.
Azure Server Farm Sensor
Azure Server Farm Sensor monitors Azure Server Farm resources, using Azure Monitor metrics. The Microsoft Server Farm simplifies the provisioning, scaling, and management of multiple servers for administrators and hosting providers.
The resource is automatically created for multiple services that require cloud computing. Azure Server Farm Sensor monitors CPU and Memory usage along with HTTP and Disc queue length automatically, also it allows you to monitor multiple other metrics depending on your needs.
Options
This sensor requires credentials for Azure subscription (Application (Client) ID, Tenant ID, and Client Secret Value).
Alerts
- Disk Queue Length > 2000
- HTTP Queue Length > 200
- CPU Usage > 90%
- Memory Usage > 90%
Performance Metrics
- System\Bytes Received - Total number of bytes received
- System\Bytes Sent - Total number of bytes sent
- System\Bytes Received\sec - Bytes received per second
- System\Bytes Sent\sec - Bytes sent per second
- System\% CPU Usage - Average processor utilization
- System\% Memory Usage - Average memory utilization
- System\Disk Queue Length - Average number of waiting read and write requests
- System\HTTP Queue Length - Number of waiting pending HTTP requests
- TCP\Syn Sent Count - The first phase of establishing a connection by the client.
- TCP\Syn Received Count - SYN packet received, SYN + ACK sent. Waiting for ACK. The connection is half-open
- TCP\Established Count - The connection has been successfully established. Transmission is probably in progress.
- TCP\Fin Wait1 Count - FIN packet was sent. Data can still be received, but sending is no longer possible.
- TCP\Fin Wait2 Count - Own FIN package confirmation was received. It is waiting for a FIN from the server
- TCP\Closing Count - The connection is being closed
- TCP\Close Wait Count - FIN packet received, ACK sent. Waiting to submit your own FIN packet
- TCP\Last Ack Count - TCP Last Ack Server acknowledged the FIN datagram
- TCP\Time Wait Count - Waiting to make sure the other party has received a disconnect confirmation.
- Sockets\Inbound All Count - Total inbound socket connections
- Sockets\Outbound All Count - Total outbound socket connections
- Sockets\Outbound Established Count - Total outbound socket connections established
- Sockets\Outbound Time Wait Count - Outbound sockets in Time Wait state
- Sockets\Loopback Count - Total opened loopbacks
Reports (Data Collectors)
By default, the sensor adds a report containing System\Bytes Received, System\Bytes Sent, System\Bytes Received\sec, System\Bytes Sent\sec, Sockets\Inbound All Count, Sockets\Outbound All Count, Sockets\Outbound Established Count, Sockets\Outbound Time Wait Count and Sockets\Loopback Count charts. These metrics will be collected and available as a report or through Performance Trend Viewer
Azure Service Bus Sensor
Azure Service Bus sensor allows monitoring the metrics of the cloud apps connected to the Service Bus namespace. Azure Service Bus is a messaging service on the cloud used to connect any applications, devices, and services running in the cloud to any other applications or services. As a result, it acts as a messaging backbone for applications available in the cloud or across any device.
This sensor provides insight into the number of Active Connections, Requests, or Server Errors, as well as a count of Average Active Messages and Queue Size in Bytes. It also enables monitoring of Premium Tier metrics, such as % CPU Usage and % Memory Usage. Thanks to that you can control the data transferred between different applications and services on all tiers, as well as coordinate transactional work that requires a high degree of reliability.
Requirements
You can monitor all available Service Bus Tiers but certain metrics, such as % CPU Usage and % Memory Usage are available for Premium Tier only.
Options
This sensor requires credentials for Azure subscription (Application (Client) ID, Tenant ID, and Client Secret Value).
Alerts
- Avg. messages dead-lettered > 5 - Triggered when the average number of messages in a Queue or Topic that can't be delivered to any receiver, or messages that couldn't be processed, exceed the set threshold
- CPU Usage > 90% - Triggered when the maximum processor utilization exceeds the set threshold
- Memory Usage > 90% - Triggered when the maximum memory utilization exceeds the set threshold
Performance Metrics
- Connection\Active Connections - The number of active connections on a namespace as well as on an entity in the namespace. Value for this metric is a point-in-time value
- Connection\Avg. Closed - Average number of connections closed for Service Bus
- Connection\Avg. Opened - Average number of connections opened for Service Bus
- Messages\Avg. Active - Average number of messages available for receiving and processing in a Queue or Topic
- Messages\Avg. Dead-Lettered - Average number of messages in a Queue or Topic that can't be delivered to any receiver, or messages that couldn't be processed"
- Messages\Incoming - Total number of incoming messages for Service bus
- Messages\Avg. In Queue - Average number of messages in a Queue or Topic
- Messages\Outgoing - Total number of outgoing messages for Service Bus
- Messages\Avg. Scheduled - Average number of scheduled messages in a Queue or Topic
- Messages\Queue Size in bytes - Size of an entity (Queue or Topic) in bytes
- Requests\Incoming - Total number of Requests for Service Bus
- Requests\Successful - Number of successful requests made to the Service Bus
- Requests\Throttled - Number of throttled requests due to exceeded usage
- Requests\Server Errors - Number of requests not processed due to Service Bus' error
- Requests\Not Processed - Number of requests not processed due to user errors
- Resources\% CPU Usage - Maximum processor utilization (Premium Tier only)
- Resources\% Memory Usage - Maximum memory utilization (Premium Tier only)
Reports (Data Collectors)
By default, the sensor adds a report containing Connection\Active Connections, Messages\Avg. Active, Messages\Queue Size in bytes, Request\Successful, Request\Server Errors,Request\Not Processed, Resource\% Memory Usage and Resource\% CPU Usage charts. These metrics will be collected and available as a report or through Performance Trend Viewer.
Azure Storage Account Sensor
Azure Storage Account Sensor monitors Azure Storage Accounts service, using Azure Monitor metrics. Microsoft Azure Storage Accounts service allows to create a group of data management rules and apply them all at once to the data stored in the account: blobs, files, tables, and queues.
With this sensor, you can detect potential service problems (decrease in service Availability) or monitor cost-related service usage (increase in Capacity), you can also observe key parameters characterizing the operation of the service, including Success Server Latency, Egress Bytes, or Transactions. This sensor includes two default alerts one of which gives the opportunity to verify whether the service availability decreases below 99% and the other allows you to see a large change in capacity consumption.
Options
This sensor requires credentials for Azure subscription (Application (Client) ID, Tenant ID, and Client Secret Value).
Alerts
- Used Capacity changed by > 20%
- Service Availability < 100%
Performance Metrics
- Storage Account\% Availability - The percentage of availability for the storage service or the specified API operation.
- Storage Account\Egress Bytes - The amount of egress data.
- Storage Account\Ingress Bytes - The amount of ingress data, in bytes.
- Storage Account\Success E2E Latency - The average end-to-end latency of successful requests in milliseconds.
- Storage Account\Success Server Latency - The average time used to process a successful request by Azure Storage.
- Storage Account\Transactions - The number of requests made to a storage service or the specified API operation.
- Storage Account\Used Capacity - The amount of storage used by the storage account in Bytes.
Reports (Data Collectors)
By default, the sensor adds a report containing Storage Account\Egress Bytes, Storage Account\Ingress Bytes, Storage Account\Success E2E Latency, Storage Account\Success Server Latency and Storage Account\Transactions charts. These metrics will be collected and available as a report or through Performance Trend Viewer
Azure Web Site Sensor
With the Azure Web Site sensor, you can monitor the usage and performance of the web applications that are deployed to the cloud with Azure Web Apps. Azure Web Apps is a managed cloud service that allows the deployment of a web application and makes it available to customers on the Internet in a very short amount of time. of Azure Web Site sensor provides information on Application Domain metrics, such as CPU Time or Application Connections; Input/Output Bytes, and Operations Per Second; as well as HTTP Response time, Client or Server Errors, Redirects, and more. Thanks to this you'll be able to keep a close eye on the monitored resources and run diagnostics when necessary.
Options
This sensor requires credentials for Azure subscription (Application (Client) ID, Tenant ID, and Client Secret Value).
Alerts
- Alert on HTTP Error responses (401, 403, 404, 406, 4xx) above set threshold
Performance Metrics
The sensor collects metrics about Application Domain usage and performance, eg:
- Application Domain\Total Application Domains
- Application Domain\Application Connections
- Application Domain\Avg. Memory Working Set
- Application Domain\Bytes Received
- Application Domain\Bytes Sent
The sensor also collects metrics related to HTTP Response statistics, eg:
- HTTP\HTTP Response Time - Average HTTP response time in seconds
- HTTP\HTTP 401 Responses - Total HTTP 401 status code responses per instance. Specifically for use when authentication is required and has failed or has not yet been provided.
- HTTP\HTTP 403 Responses - Total HTTP 403 status code responses per instance. It may be due to the user not having the necessary permissions for a resource or needing an account of some sort, or attempting a prohibited action
- HTTP\HTTP 404 Responses - Total HTTP 404 status code responses per instance. The requested resource could not be found but may be available in the future. Subsequent requests by the client are permissible.
- HTTP\HTTP 406 Responses - Total HTTP 406 status code responses per instance. The requested resource is capable of generating only content not acceptable according to the Accept headers sent in the request.
- HTTP\HTTP 4xx Responses - Total HTTP 4xx status code responses per instance. This class of status code is intended for situations in which the error seems to have been caused by the client.
Reports (Data Collectors)
By default, the sensor adds a report containing HTTP\HTTP Response Time, Application Domain\Total Application Domains, HTTP\HTTP 401 Responses, HTTP\HTTP 403 Responses,HTTP\HTTP 404 Responses,HTTP\HTTP 406 Responses, and HTTP\HTTP 4xx Responses charts. These metrics will be collected and available as a report or through Performance Trend Viewer.
Azure Kubernetes Cluster Sensor
The sensor monitors Azure Kubernetes Services resource, using Azure Monitor metrics.
Azure Kubernetes Cluster Sensor allows collecting essential metrics for the managed Cluster. With this sensor you can for example be notified when the allocable memory on the Cluster is running out.
Options
To use this sensor you will need Client ID, Tenant ID, and Application Secret.
Alerts
- Used Memory Working Set > 70%
- Used Memory Working Set > 90%
- Disk Used > 70%
- Disk Used > 90%
- RSS Memory Used > 70%
- RSS Memory Used > 90%
Performance Metrics
- Container\Used Memory Working Set Bytes - Container working set memory used in bytes
- Container\% Used Memory Working Set - Container working set memory used in percent
- Container\RSS Memory Bytes - Container RSS memory used in bytes
- Container\% RSS Memory Used - Container working set memory used in percent
- Nodes\CPU Cores Allocatable - Total number of available CPU cores in a managed cluster
- Nodes\Memory Bytes Allocatable - Total amount of available memory in a managed cluster in bytes
- Nodes\Nodes Condition - Number of nodes in a known condition
- Nodes\CPU Milicores Utilization - Aggregated measurement of CPU utilization in millicores across the cluster
- Nodes\% CPU Cluster Utilization - Aggregated average CPU utilization measured in percentage across the cluster
- Nodes\Disk Used Bytes - Disk space used in bytes by device
- Nodes\% Disk Used - Disk space used in percent by device
- Nodes\Bytes Received - Network received bytes
- Nodes\Bytes Sent - Network transmitted bytes
- Cluster Autoscaler\Cluster Health - Determines whether or not cluster autoscaler will take action on the cluster.
- Cluster Autoscaler\Nodes Cooldown - Determines if the scale down is in cooldown - No nodes will be removed during this timeframe
- Cluster Autoscaler\Nodes Unneeded - Cluster autoscaler marks those nodes as candidates for deletion and are eventually deleted
- Cluster Autoscaler\Pods Unschedulable - Number of pods that are currently unschedulable in the cluster
- Pods\Phase - Number of pods in known phase
- Pods\Ready - Number of pods in Ready state
- API Server\Avg. Requests Inflight - Maximum number of currently active inflight requests on the API Server per request kind
- Sensor\Check Time - Time of the monitoring operation
Reports (Data Collectors)
By default, the sensor adds a report containing Container\Used Memory Working Set Bytes, Container\RSS Memory Bytes, Nodes\Nodes Condition, Nodes\CPU Cores Allocatable, Nodes\Memory Bytes Allocatable, Nodes\Bytes Received, Nodes\Bytes Sent, Nodes\Disk Used Bytes, Pods\Phase, and Pods\Ready charts. These metrics will be collected and available as a report or through Performance Trend Viewer
AWS Alarm Sensor
The Alarm Sensor monitors the status of Amazon alarms with CloudWatch API.
With this feature, you can keep track of your most important AWS Alarms, and extend monitoring to warn
about other AWS Alarm states like insufficient data.
The sensor also allows monitoring of all regions.
At least one configured CloudWatch Alarm is required.
Options
To use the Alarm Sensor you will need to provide Access Key ID and Secret Access Key. The user whose credentials are entered during sensor configuration needs access rights for CloudWatch queries.
Statuses
- This sensor provides the status for each alarm in the selected region (or all regions). If any AWS Alarm is in an "alarm" state, NC generates a Warning. The total number of statuses depends on the alarms' configuration. The status name is equal to AWS CloudWatch alarm name.
AWS Auto Scaling Sensor
AWS Auto Scaling Sensor monitors the parameters of AWS Auto Scaling Group. AWS Auto Scaling automatically adjusts capacity to maintain steady, predictable performance for your applications.
The sensor can track changes within the Auto Scaling group and observe multiple states of group instances. Thanks to it, you can find out about large variations in the number of instances that are running as part of the group, which can increase cost, and observe maximum group size which informs about maximal workload.
Requirements
To use AWS Auto Scaling you will need to provide Access Key ID and Secret Access Key. The user whose credentials are entered during sensor configuration needs access rights for CloudWatch queries.
Alerts
- Running instances changed by > 80% - there was a very big change in running instances, which is cost-related.
- More than 75% of the available instances are running
Performance Metrics
- Group\Desired Capacity - Number of instances that the group attempts to maintain
- Group\Maximum Size - Maximum size of the group
- Group\Minimum Size - Minimum size of the group
- Group\Pending Instances - Number of pending Instances. A pending instance is not yet in service.
- Group\Standby Instances - Number of instances in a standby state.
- Group\Terminating Instances - Number of instances that are in the process of terminating
- Group\Total Instances - Total count of instances (in service, pending, and terminating) in the group
- Group\Running Instances - Number of instances that are running as part of the group
- Group\%Running Instances - Percentage of instances running (in relation to all instances)
Reports (Data Collectors)
By default, the sensor adds a report containing Group\Pending Instances, Group\Standby Instances, Group\% Running Instances, and Group\Running Instances charts. These metrics will be collected and available as a report or through Performance Trend Viewer
Azure SQL DB Sensor
This sensor allows you to monitor the performance and behavior of the databases managed in Azure SQL DB. Azure SQL DB is Microsoft’s cloud database service, that enables organizations to store relational data in the cloud and quickly scale the size of their databases up or down as business needs change.
Azure SQL DB sensor allows you to monitor failed/successful connections or connections blocked by a firewall; to control data and CPU resources by monitoring their average values as well as the occupied memory space and usage percentage. It also makes it possible to verify the data space used, for example when the upper limit is reached. Thanks to this sensor you'll have insight into the utilization of the service and databases, ensuring optimal performance.
Options
This sensor requires credentials for Azure subscription (Application (Client) ID, Tenant ID, and Client Secret Value).
Alerts
- Data space used > 90%
- SQL DB process memory usage > 90%
- SQL DB process CPU usage > 90%
Performance Metrics
- Connections\Failed - Number of failed connections
- Connections\Successful - Number of successful connections
- DTU\% Avg. DTU - Average DTU (Database Transaction Unit) Percentage
- DTU\Avg. DTU Limit - Average DTU (Database Transaction Unit) Limit. Applies to DTU-based databases
- DTU\Avg. DTU used - Average DTU (Database Transaction Unit) used. Applies to DTU-based databases
- DWU\% DWU - Maximum DWU (Data Warehouse Units) percentage. Applies only to data warehouses
- DWU\DWU Limit - Maximum DWU (Data Warehouse Units) limit. Applies only to data warehouses
- DWU\DWU Used - DWU (Data Warehouse Units) used. Applies only to data warehouses
- Log\Log Backup Storage Size [bytes] - Maximum log backup storage size in bytes. Applies to vCore-based and Hyperscale databases
- Log\% Avg. Log IO - Average Log IO percentage. Not applicable to data warehouses
- Log\Tempdb Log File Size [KB] - Maximum tempdb log file size in KB. Not applicable to data warehouses
- Log\% Tempdb Log Used - Maximum tempdb Percent Log Used. Not applicable to data warehouses
- Process\% Cache Hit - Maximum percentage of a cache hit
- Process\% Cache Used - Maximum cache used percentage
- Process\% Avg. Data IO - Average data IO percentage
- Process\% Avg. Sessions - Average sessions percentage. Not applicable to data warehouses
- Process\% SQL Server Process Core - Maximum CPU usage as a percentage of the SQL DB process. Not applicable to data warehouses
- Process\% SQL Server Process Memory - Maximum memory usage as a percentage of the SQL DB process. Not applicable to data warehouses
- Process\Number of Deadlocks - Number of deadlocks. Not applicable to data warehouses. A deadlock is caused when two or more transactions hold locks that the other transactions require. Blue Matador detects deadlocks in Azure SQL by monitoring the deadlock metric on your SQL databases
- Resources\Avg. Data Space Allocated [bytes] - Average allocated data storage in bytes
- Resources\Application CPU Billed -Number of application CPU billed (vCore per second). Applies to serverless databases
- Resources\% Avg. Application CPU - Average application CPU percentage. Applies to serverless databases
- Resources\% Application Memory - Application memory percentage. Applies to serverless databases
- Resources\Base Blob Storage Size [bytes] - Maximum base blob storage size in bytes
- Resources\Avg. CPU Limit - Average CPU limit
- Resources\% CPU - CPU percentage
- Resources\% Avg. vCore Used - Average number of v-Core used
- Resources\Differential Backup Storage Size [bytes] - Cumulative differential backup storage size in bytes. Applies to vCore-based databases. Not applicable to Hyperscale databases
- Resources\Data Storage Size (GB) - Total data storage size (GB)
- Resources\Disaster Recovery Storage Size (GB) - Disaster recovery storage size (GB)
- Resources\Snapshot Storage Size (GB) - Snapshot storage size (GB)
- Resources\Full Backup Storage Size [bytes] - Maximum full backup storage size in bytes. Applies to vCore-based databases. Not applicable to Hyperscale databases
- Resources\% Avg. Local TempDB - Average local tempdb percentage. Applies only to data warehouses
- Resources\% Memory - Maximum memory percentage
- Resources\Snapshot Backup Storage Size [Bytes] - Maximum cumulative snapshot backup storage size in bytes
- Resources\Data Space Used [Bytes] - Maximum data space used in bytes. Not applicable to data warehouses
- Resources\% Data Space Used - Maximum data space used percent. Not applicable to data warehouses or hyperscale databases
- Resources\Tempdb Data File Size [KB] - Maximum tempdb Data File Size in KB. Not applicable to data warehouses
- Resources\% Resources Allocated Per Workload Group - Maximum percentage of resources allocated per workload group
- Resources\% Cap's Resources Allocated Per Workload Group - Maximum percentage of the specified cap's resources per workload group
- Resources\% Resources Allowed For Workload Group - A hard limit on the percentage of resources allowed for the workload group, taking into account the Effective Min Resource Percentage allocated for other workload groups
- Resources\% Effective Min Resource For Workload Group - Minimum percentage of resources reserved and isolated for the workload group, taking into account the service level minimum
- Resources\% Avg. Workers - Average workers percentage. Not applicable to data warehouses
- Resources\% Avg. In-Memory OLTP storage - Average in-memory OLTP storage percent. Not applicable to data warehouses
- Request\Workload Group Active Queries - Number of active queries within the workload group queries
- Request\Workload Group Query Timeouts - Queries that have timed out for the workload group
- Request\Queries Queued - Number of queued queries across all workload groups
- Request\Workload Group Queued Queries - Number of queries queued within the workload group
- Request\Queries Active - Number of active queries across all workload groups
- Request\Requests Blocked - Number of requests blocked by firewall
Reports (Data Collectors)
By default, the sensor adds a report containing Process\% SQL Server Process Core, Process\% SQL Server Process Memory, and Resources\Avg. Data Space Allocated [bytes] charts. These metrics will be collected and available as a report or through Performance Trend Viewer.
AWS Cost Sensor
The sensor monitors the estimated cost of services in the AWS cloud and the progress of expenses within AWS Budgets.
The sensor calculates the estimated costs for the current month's billing period. You can define an alert when the current cost exceeds a certain value. Alerts can also be defined for costs generated by selected AWS services. As an option, the sensor can read AWS Budgets associated with the selected account. You can define alerting rules for any budget spending progress. Current cost and budget status can be represented with Object Status Widgets.
Requirements
The sensor needs user Access Key ID and Secret Access Key to AWS Cloud authorization. This sensor requires sufficient rights to query data from the AWS Cost Explorer API and AWS Budgets API. In IAM (Identity and Access Management), you need to create a policy with the statement (JSON format):
{
    "Sid": "Stmt1613653218000",
    "Effect": "Allow",
    "Action": [
        "ce:GetCostAndUsage",
        "ce:GetCostForecast",
        "ce:getDimensionValues",
        "budgets:ViewBudget"
    ],
    "Resource": [
        "*"
    ]
}
Options
By default, the sensor is run once a day. Reading the AWS Budgets information is optional. You need to select the AWS account associated with a budget.
This sensor uses AWS Cost Explorer API and AWS Budgets API. According to the AWS Cost Management Pricing document, each request will incur a cost. This sensor performs two API queries plus one per each defined alert for AWS service cost. Additional one more request, if fetching information about budgets is enabled.
Alerts
- Alert on budget spend progress
- Alert on the total cost
- Alert on AWS service cost
AWS EBS Sensor
The sensor allows monitoring of key metrics of AWS Elastic Block Store.
AWS EBS Sensor monitors Elastic Block Store in terms of performance and resources used by a single EBS instance. Amazon Elastic Block Store (EBS) is a high-performance block storage service designed for use with Amazon Elastic Compute Cloud (EC2). It helps to keep the balance of the Burst Bucket on the save level and detect large changes in the number of write operations, which is cost-related and can be a sign of EC2 errors.
Options
To monitor AWS Elastic Block Store you will need to provide Access Key ID and Secret Access Key. The user whose credentials are entered during sensor configuration needs access rights for CloudWatch queries.
Alerts
- % Burst Bucket Balance < 10% - your Burst bucket balance is running low.
- Number of Write Operations deviated by > 20% from baseline - there was a significant change in write operations, which may be the symptom of EC2 error.
Performance Metrics
- Volume\Idle Time - Number of seconds when no read or write operations were submitted
- Volume\Queue Length - The read and write operation requests waiting to be completed
- Volume\Bytes Read - Total read bytes
- Volume\Read Operations - The total read operations
- Volume\Total Read Time - Seconds spent by all read operations that completed
- Volume\Write Bytes - Total write bytes
- Volume\Total Write Time - Seconds spent by all write operations that completed
- Volume\% Throughput - Percentage of I/O operations per second (IOPS) delivered of the total IOPS provisioned
- Volume\Consumed RW Operations - Amount of read and write operations (normalized to 256K capacity units) consumed
- Volume\Write Operations - Number of write operations
- Volume\% Burst Bucket Balance - Credits remaining in the burst bucket
Reports (Data Collectors)
By default, the sensor adds a report containing Volume\Queue Length, Volume\Bytes Read, and Volume\Write Bytes charts. These metrics will be collected and available as a report or through Performance Trend Viewer
AWS EC2 Sensor
AWS EC2 Sensor allows monitoring usage of Amazon Cloud service Elastic Compute Cloud (EC2) Instance resources.
The sensor monitors the Network load, Disk usage, and CPU utilization for each available EC2 Instance. CPU Credits usage metrics are also available. You can use these metrics to determine whether you should launch additional instances to handle the increased load or, conversely, the under-used instances should be stopped to save money.
Requirements
This sensor requires sufficient rights to query data from the AWS API. In IAM (Identity and Access Management), you need to create policy with statements (JSON format):
[
  {
    "Sid": "Stmt1338559359622",
    "Action": [
      "ec2:DescribeInstances",
      "ec2:DescribeVolumes"
    ],
    "Effect": "Allow",
    "Resource": ""
  },
  {
    "Sid": "Stmt1338559372809",
    "Action": [
      "cloudwatch:GetMetricStatistics",
      "cloudwatch:GetMetricData",
      "cloudwatch:ListMetrics",
      "cloudwatch:DescribeAlarms"
    ],
    "Effect": "Allow",
    "Resource": ""
  }]
Assign the above policy to the user account used for monitoring.
Options
This sensor requires credentials for AWS API. Select the region for which you want to monitor EC2 Instances. The sensor provides metrics for each EC2 Instance in the selected region.
Alerts
- CPU Utilization > 90% - alert is added by default for all monitored EC2 Instances
Performance Metrics
- Credit\CPU Credit Balance - The number of earned CPU credits that an instance has accrued since it was launched or started.
- Credit\CPU Credit Usage - The number of CPU credits spent by the instance for CPU utilization.
- Credit\CPU Surplus Credit Balance - The number of surplus credits that have been spent by a T2 Unlimited instance when its CPUCreditBalance is zero
- Credit\CPU Surplus Credits Charged - The number of spent surplus credits that are not paid down by earned CPU credits, and thus incur an additional charge.
- CPU\% Utilization - The percentage of allocated EC2 compute units that are currently in use on the instance.
- Disk\Read Bytes - Bytes read from all instance store volumes available to the instance.
- Disk\Read Operations - Completed read operations from all instance store volumes available to the instance in a specified period of time.
- Disk\Write Bytes - Bytes write from all instance store volumes available to the instance.
- Disk\Write Operations - Completed write operations to all instance store volumes available to the instance in a specified period of time.
- Network\In Bytes - The number of bytes received on all network interfaces by the instance.
- Network\Out Bytes - The number of bytes sent out on all network interfaces by the instance.
- Network\In Packets - The number of packets received on all network interfaces by the instance.
- Network\Out Packets - The number of packets sent out on all network interfaces by the instance.
- Status Check Failed\Any - Reports whether the instance has passed both the instance status check and the system status check in the last minute.
- Status Check Failed\Instance - Reports whether the instance has passed the instance status check in the last minute.
- Status Check Failed\System - Reports whether the instance has passed the system status check in the last minute.
Reports (Data Collectors)
By default, the sensor adds a report containing Credit\CPU Credit Usage, CPU\% Utilization, Disk\Read Bytes, Disk\Write Bytes, Disk\Read Operations, and Disk\Write Operations charts. These metrics will be collected and available as a report or through Performance Trend Viewer
AWS ElastiCache Sensor
AWS ELB Sensor allows monitoring of the performance of the AWS ElastiCache service.
This sensor offers good insight into ElastiCache performance using Amazon CloudWatch metrics. You set triggers for these metrics so that you can take corrective action before performance issues occur.
Requirements
This sensor requires sufficient rights to query data from the AWS API. In IAM (Identity and Access Management), you need to create policy with statements (JSON format):
[{
  "Sid": "Stmt1338559399560",
  "Action": [
      "elasticache:DescribeCacheClusters"
   ],
   "Effect": "Allow",
   "Resource": ""
},
{
   "Sid": "Stmt1338559372809",
   "Action": [
       "cloudwatch:GetMetricStatistics",
       "cloudwatch:GetMetricData",
       "cloudwatch:ListMetrics"
   ],
   "Effect": "Allow",
   "Resource": ""
}]
Options
This sensor requires credentials for AWS API. Select the region for which you want to monitor ElastiCache clusters.
Alerts
- % Engine CPU Utilization > 90%
- Database Memory Usage > 90%
- Swap Usage > 50MB
- More than 8000 new connections - We recommend that you determine your own alarm threshold for Current Connections and New Connections based on your application needs. An increasing number of CurrConnections might indicate a problem with your application; you will need to investigate the application behavior to address this issue.
Alerts are defined for all monitored ElastiCache clusters.
Performance Metrics
ElastiCache provides both host-level metrics and metrics that are specific to the cache engine software (Redis).
Selected host-level metrics:
- Host\% CPU Utilization - The percentage of CPU utilization for the entire host
- Host\Swap Usage [Bytes] - The amount of swap used on the host
- Host\CPU Credit Usage - The number of CPU credits spent by the instance for CPU utilization
- Network\Bytes In - The number of bytes the host has read from the network
- Network\Bytes Out - The number of bytes sent out on all network interfaces by the instance
Selected metrics for Redis:
- Redis\% Engine CPU Utilization - Provides access to the Redis process CPU utilization to gain better insights into your Redis workloads
- Redis\% Database Memory Usage - The percentage of the memory available for the cluster that is in use
- Redis\Current Connections - The number of client connections, excluding connections from read replicas
- Redis\New Connections - The number of connections that have been accepted by the server
- Redis\% Cache Hits - The number of successful read-only key lookups in the main dictionary
- Redis\Cache Misses - The number of unsuccessful read-only key lookups in the main dictionary
- Redis\Current Cache Items - The number of items in the cache
Reports (Data Collectors)
By default, the sensor collects data for two reports:
- ElastiCache Host Report - containing Host\% CPU Utilization, Host\Swap Usage, Network\Bytes In, and Network\Bytes Out charts
- ElastiCache Redis Report - containing Redis\% Engine CPU Utilization, Redis\% Database Memory Usage, Redis\Bytes Used For Cache, and Redis\Current Connections charts.
These metrics will be collected for all monitored ElastiCache clusters, and available as a report or through Performance Trend Viewer
AWS ELB Sensor
AWS ELB Sensor allows monitoring metrics of AWS Elastic Load Balancers.
Elastic Load Balancing allows you to monitor the health of your applications and their performance in real-time with Amazon CloudWatch metrics.
Requirements
This sensor requires sufficient rights to query data from the AWS API. In IAM (Identity and Access Management), you need to create policy with statements (JSON format):
[{
  "Sid": "Stmt1338559359622",
  "Action": [
     "elasticloadbalancing:DescribeLoadBalancers"
   ],
   "Effect": "Allow",
   "Resource": ""
},
{
   "Sid": "Stmt1338559372809",
   "Action": [
      "cloudwatch:GetMetricStatistics",
      "cloudwatch:GetMetricData",
      "cloudwatch:ListMetrics"
   ],
  "Effect": "Allow",
  "Resource": ""
}]
Options
This sensor requires credentials for AWS API. Select the region for which you want to monitor Load Balancers instances. Metrics can be collected for each Load Balancer instance or by Availability Zones.
Alerts
- Backend Connection Errors - when any backend connection error occurs
- Unhealthy Host Count > 0
- Surge Queue is full - when any request were rejected because the surge queue is full
Alerts are defined for all monitored load balancers.
Performance Metrics
- Load Balancer\Backend Connection Errors - The number of connections that were not successfully established between the load balancer and the registered instances
- Load Balancer\Healthy Host Count - The number of healthy instances registered with your load balancer
- Load Balancer\Unhealthy Host Count - The number of unhealthy instances registered with your load balancer
- HTTP\2XX Responses - The number of HTTP 2XX response codes generated by registered instances
- HTTP\3XX Responses - The number of HTTP 3XX response codes generated by registered instances
- HTTP\4XX Responses - The number of HTTP 4XX response codes generated by registered instances
- HTTP\5XX Responses - The number of HTTP 5XX response codes generated by registered instances
- HTTP\ELB 4XX Responses - The number of HTTP 4XX client error codes generated by the load balancer
- HTTP\ELB 5XX Responses - The number of HTTP 5XX client error codes generated by the load balancer
- Requests\Latency (ms) - The total time elapsed, in milliseconds, from the time the load balancer sent the request to a registered instance until the instance started to send the response headers
- Requests\Request Count - The number of requests completed or connections made during the specified interval
- Requests\Spillover Count - The total number of requests that were rejected because the surge queue is full
- Requests\Surge Queue Length - The total number of requests (HTTP listener) or connections (TCP listener) that are pending routing to a healthy instance
- ALB\Active Connection Count - The estimated number of concurrent TCP connections active from clients to the load balancer and from the load balancer to targets
- ALB\Consumed LCUs - The estimated number of load balancer capacity units (LCU) used by an Application Load Balancer
- ALB\New Connection Count - The estimated number of new TCP connections established from clients to the load balancer and from the load balancer to targets
- ALB\Processed Bytes - The estimated number of bytes processed by an Application Load Balancer
Data for some metrics are available depending on the Load Balancer type and selected dimension.
Reports (Data Collectors)
By default, the sensor collects data for two reports:
-
Load Balancer Report - containing base balancer metrics, such as Requests\Request Count, Load Balancer\Backend Connection Errors, Load Balancer\Healthy Host Count, and others.
-
Application Load Balancer Report - containing ALB metrics.
AWS SQS Sensor
AWS SQS Sensor allows monitoring of key metrics of AWS Simple Queue Service (SQS). SQS is a fully managed message queuing service that enables you to decouple and scale microservices, distributed systems, and serverless applications.
The sensor monitors AWS Simple Queue Service performance and workload parameters. With this sensor, you can avoid queue overload (indicated by a large number of delayed messages) and spot a large number of empty receives - which can inform about errors within pushing service(s).
Requirements
To use this sensor you will need a user Access Key ID and Secret Access Key (the second one is visible only shortly after key pair generation). The user whose credentials are entered during sensor configuration needs proper access rights for CloudWatch queries (example JSON with IAM rights below)
{
  "Version": "2012-10-17",
  "Statement": [
    {
      "Sid": "Stmt1338559372809",
      "Action": [
        "cloudwatch:GetMetricStatistics",
	    "cloudwatch:GetMetricData",
        "cloudwatch:ListMetrics",
        "cloudwatch:DescribeAlarms"
      ],
      "Effect": "Allow",
      "Resource": ""
    },
    {
      "Sid": "Stmt1338559548992",
      "Action": [
        "sqs:ListQueues"
      ],
      "Effect": "Allow",
      "Resource": ""
    }
  ]
}
Options
This sensor can only be used on the NetCrunch Cloud Service node. There is only one sensor allowed per node. During sensor configuration, you will have to choose one specific SQS instance that you want to monitor. You can also add your own ID to the sensor if you monitor multiple SQS instances.
Alerts
- Delayed Messages > 15 - a large number of messages delayed (queue overloaded)
- Number of Empty Receives > 10 - a large number of empty receives may indicate a pushing service error
Performance Metrics
- Queue\Oldest Non-deleted Message Age - Age of oldest non-deleted message in seconds
- Queue\Messages not Visible - The number of messages that are in flight.
- Queue\Messages Visible - The number of messages available for retrieval from the queue.
- Queue\Messages Added - The number of messages added to a queue.
- Queue\Messages Delayed - The number of messages in the queue that are delayed and not available for reading immediately.
- Queue\Number of Empty Receives - The number of ReceiveMessage API calls that did not return a message.
- Queue\Messages Deleted - The number of messages deleted from the queue.
- Queue\Messages Received - The number of messages returned by calls to the ReceiveMessage action.
- Queue\Sent Message Size Bytes - The size of messages added to a queue.
Reports (Data Collectors)
By default, the sensor adds a report containing Queue\Oldest Non-deleted Message Age, Queue\Messages not Visible, Queue\Messages Visible, and Queue\Messages Added charts. These metrics will be collected and available as a report or through Performance Trend Viewer
Cloud Drives
onedrive
OneDrive Sensor
This sensor allows monitoring of Microsoft OneDrive storage usage.
Options
This sensor uses OAuth 2.0 to get an access token to your OneDrive.
Alerts
- Available free space < 10%
Performance Metrics
- OneDrive.Storage\% Free Space - % of your total drive space that is free
- OneDrive.Storage\Allocated Bytes - Total size of storage available on your drive
- OneDrive.Storage\Used Bytes - Size of storage that is currently used
- OneDrive.Storage\Free Space Bytes - Free storage size
- OneDrive.Storage\Trash Space Bytes - Size of files that are in your recycle bin
Reports (Data Collectors)
By default, the sensor adds a report containing Storage\Allocated Bytes, Storage\Used Bytes, Storage\Trash Space Bytes, and Storage\% Free Space charts. These metrics will be collected and available as a report or through Performance Trend Viewer
google-drive
Google Drive Sensor
Options
Access Token
It is necessary to enter at least one authentication profile and pass OAuth 2 authentication by clicking on "Authenticate".
Alerts
- Drive free space < 10% - The alert will be triggered if there is less than 10% of free space on Google Drive.
Performance Metrics
- Storage\Allocated Bytes - Total size of storage available on your drive
- Storage\Used Bytes - Size of storage that is currently used
- Storage\Trash Space Bytes - Size of files that are in your recycle bin
- Storage\Free Space Bytes - Free storage size
- Storage\% Free Space - % of your total drive space that is free
- Storage\% Trash Space - % of your total drive space that is used by trash
Reports (Data Collectors)
By default, the sensor adds a report containing Storage\Allocated Bytes, Storage\Used Bytes, Storage\Trash Space Bytes, Storage\% Free Space, Storage\Free Space Bytes, and Storage\% Trash Space charts. These metrics will be collected and available as a report or through Performance Trend Viewer
Cloud Email Services (Gmail, Outlook, OAuth2)
NetCrunch includes dedicated sensors for monitoring cloud-hosted email services such as Gmail and Outlook. These sensors offer the same diagnostic functionality as traditional email sensors but use OAuth 2.0 authentication instead of basic credentials. They support Gmail, Microsoft 365/Outlook.com, and custom OAuth providers.
Overview
NetCrunch supports monitoring of modern cloud-based email platforms using a dedicated Cloud Email Service node. Once added, this node can host any of the three specialized cloud email sensors, which replicate the functionality of standard email monitors—while using OAuth 2.0 authentication to access protected accounts.
These sensors allow testing of mail delivery time, mailbox contents, and even scanning message bodies for alert conditions. This provides comprehensive, agentless visibility into cloud-hosted mail systems without the use of insecure credentials.
Supported Email Providers
The sensors support:
- Gmail / Google Workspace
- Microsoft Outlook.com / Microsoft 365
- Custom OAuth 2.0 providers (requires manual config of endpoints)
Authentication Setup
To use any of these sensors, you must create a Cloud Email Service Authentication Profile, which includes:
- Authentication Type: OAuth 2.0
-
Account Type:
- Gmail
- Outlook.com
- Custom OAuth settings
- Username (email address)
- Token authorization endpoint (for custom OAuth)
- Authorization code/token (generated via popup)
This ensures secure, standards-compliant access to mailbox data without storing passwords.
Available Cloud Email Sensors
All sensors are added from the Monitoring → Sensors section of a Cloud Email Service node.
Cloud Data Email
A powerful sensor that monitors inbound email content. It reads messages via IMAP and can:
- Filter by sender, subject, or content keywords
- Parse structured content for metrics
- Trigger alerts when specific phrases or values are found
- Monitor message arrival timing or missing messages
Typical use cases:
- Alert parsing from third-party systems
- Monitoring external job results or reports
- Verifying status emails from appliances or partners
Cloud Email Round-Trip
Tests the entire email pipeline by sending a message to a monitored mailbox and reading it back via IMAP.
- Sends test email via SMTP
- Tracks delivery delay
- Measures authentication success
- Detects send/receive failures or latency
Ideal for:
- SLA verification
- End-to-end delivery testing
- Alerting on silent mail failures or blocked delivery paths
Cloud Mailbox
A mailbox-level sensor that:
- Connects via IMAP using OAuth2
- Monitors mailbox health and authentication
-
Tracks counters like:
- Total message count
- Message age
- Folder-specific statistics
Useful for:
- Monitoring mailbox activity trends
- Alerting when usage exceeds thresholds
- Ensuring IMAP service is accessible and responsive
Key Differences from Traditional Sensors
| Feature | Traditional Email Sensor | Cloud Email Sensor |
|---|---|---|
| Authentication | Basic credentials | OAuth 2.0 |
| Mailbox type | Local/SMTP/IMAP/POP3 | Gmail, Outlook, custom OAuth IMAP |
| Security | Password stored (hashed) | Token-based (secure) |
| Compatibility | Any mail server | OAuth-supported cloud services |
| Integration | Node-based (Email Server) | Cloud Service Node |
Summary
Cloud Email sensors in NetCrunch allow secure, modern monitoring of cloud-hosted mail systems without compromising visibility or functionality. Whether you're tracking delivery time, scanning inboxes for alerts, or auditing mailbox usage, these sensors let you do so securely, efficiently, and without deploying agents.
Zoom Sensors
Zoom sensors allow monitoring various aspects of Zoom services.
Zoom Status Sensor
The sensor checks the status of the Zoom services requesting API available on https://status.zoom.us/ (like Zoom Meetings, Zoom Video Webinars, and others).
Alerts
By default, the sensor alerts you when any of the services are in a state other than Operational. You can also set an alarm for the selected service.
Zoom Plans Usage Sensor
This sensor reads information about the Zoom account's billing plans. Additionally, the sensor collects metrics of Cloud Recording Plan storage usage.
Requirements
This sensor requires credentials (Account ID, Client ID, and Client Secret) for Zoom API. To enable access to the API you must build Server-to-server OAuth application in the Zoom App Marketplace.
Required scopes:
- Account/View account info (account:read:admin)
- User/View all user information (user:read:admin)
Server-to-server OAuth app must be enabled in User Management->Roles->[Admin]->Advanced Features (View only).
Due to Zoom API restrictions, your Zoom account must be a paid account.
Alerts
- Free Storage Used > 90% - when Free Storage used space is high
- Plan Storage Exceeded
Counters
- Plan\Hosts - Number of hosts available in the plan (for each available plan).
- Plan\Usage - Number of used hosts in the plan (for each available plan).
- Plan\% Usage - Percent of used hosts in the plan (for each available plan).
- Recording\Free Storage Bytes - Total amount of free storage available for recording.
- Recording\Free Storage Used Bytes - Used amount of free storage.
- Recording\% Free Storage Used - Free storage usage in percent.
- Recording\Plan Storage Bytes - Total amount of plan storage available for recording.
- Recording\Plan Storage Used Bytes - Used amount of plan storage.
- Recording\% Plan Storage Used - Plan storage usage in percent.
Reports (Data Collectors)
By default, the sensor collects data for reports containing Recording\Free Storage Used Bytes, Recording\% Free Storage Used charts, and Plan\% Usage charts for each available plan. These metrics will be collected and available as a report or through Performance Trend Viewer
Zoom Operation Logs Sensor
This sensor allows you to audit administrator and user activity by reading new entries from the Zoom Operations Log.
The Zoom Operation Log contains entries that describe changes made by admins on the account, specifically changes in the sections under Account Management, User Management, and Advanced. This sensor checks Operation Log and can generate alerts for new log entries.
Requirements
This sensor requires credentials (Account ID, Client ID, and Client Secret) for Zoom API. To enable access to the API you must build Server-to-server OAuth application in the Zoom App Marketplace.
Required scope:
- Report/View report data (report:read:admin)
Server-to-server OAuth app must be enabled in User Management->Roles->[Admin]->Advanced Features (View only).
Due to Zoom API restrictions, your Zoom account must be a paid account.
Alerts
By default, an alert is generated for each new log operation.
You can create your own alerting rule for operations matching selected criteria, like: * Operation Action (eg: Update or Add) * Operation Category (eg: User, Account, and other) * Operation Operator * The text that appears in the operation description
Zoom Account Sensor
This sensor reads the actual configuration settings of the Zoom account.
Use this sensor if you want to monitor changes to the configuration of the Zoom account.
Requirements
This sensor requires credentials (Account ID, Client ID, and Client Secret) for Zoom API. To enable access to the API you must build Server-to-server OAuth application in the Zoom App Marketplace.
Required scopes:
- Account/View account info (account:read:admin)
- User/View all user information (user:read:admin)
Server-to-server OAuth app must be enabled in User Management->Roles->[Admin]->Advanced Features (View only).
Due to Zoom API restrictions, your Zoom account must be a paid account.
Alerts
- Maximum number of participants in a single meeting < 300
- Account is not active - when an account is not verified or is not active
You can set alerts on various configuration properties, according to your needs; For example: when End-to-end encryption for meetings is disabled/enabled or cloud recording is enabled/disabled, and others.
Microsoft 365 Service Status
This sensor allows you to monitor the health of Microsoft 365 services.
The sensor monitors the state of Microsoft 365 services and alerts you if any services are degraded or interrupted. You can also define an alert for a selected service. Then the sensor reads detailed information about service failure, e.g., which service feature is affected and how the problem affects users.
Requirements
The Office 365 Management APIs use Azure AD to provide authentication services that you can grant NetCrunch access to. To allow NetCrunch access to the Office 365 Management APIs, you need to register your application in Azure AD.
Specify the Microsoft Graph API permissions and select "ServiceHealth.Read.All".
Then you have to create a new application secret for authentication. Detailed instructions can be found in the Microsoft documentation at: https://docs.microsoft.com/en-us/office/office-365-management-api/get-started-with-office-365-management-apis
Options
The sensor needs an Application ID, a Tenant ID, and an Application Secret to authenticate with Azure.
Alerts
By default, the sensor alerts you when any Microsoft 365 service is in a degraded or interrupted state. If you need detailed information about the status of a specific service, you must create an alert for that service.
Reports (Data Collectors)
By default, the sensor collects statistical data on the number of services in different states, such as Services\Operational, Services\Degraded, and Services\Restoring. The metrics will be collected and available as a report or through Performance Trend Viewer
Google Analytics Sensors
Google Analytics sensors allow monitoring of various metrics provided by the Analytics Reporting API.
Options
This sensor uses OAuth 2.0 to get access to your Google Analytics data.
An Analytics account is organized into several levels: accounts, properties, and reporting views. You must select Reporting View for the selected Property in the sensor configuration.
GA Users and Sessions sensor
This sensor allows monitoring metrics related to Users' activity.
Alerts
- Possible Attack Alert - triggered when page views suddenly increase compared to a baseline
- Alert on Performance Threshold - set threshold on available counter values
Performance Metrics
- User\User Count - The number of users visiting the website
- User\New Users - The number of sessions marked as a user's first sessions
- User\Number of Sessions per User - The average number of user sessions
- Session\Session Count - The total number of sessions
- Session\% Bounce Rate - The percentage of single-page session views
- Session\Avg. Session Duration (sec) - The average duration (in seconds) of user sessions
- Page Tracking\Pageviews - The total number of pageviews for the property
- Page Tracking\Pages per Session - The average number of pages viewed during a session
Reports (Data Collectors)
By default, the sensor adds a report containing User Count, Number of Sessions per User, Session Count, Avg. Session Duration, Pageviews, and Pages per Session charts.
GA Metrics sensor
This sensor allows monitoring of the selected reporting view's metrics.
Alerts
- Alert on Performance Threshold - set threshold on available counter values
Performance Metrics
You can collect any predefined metrics provided by the Analytics Reporting API. Custom-defined metrics are also available.
Options
You can choose Data Collection Mode. This option determines how the sensor processes the counter values.
- Raw - raw values provided by Analytics
- Difference - value calculated as the difference between the previous and current sample
- Auto (default) - processing method selected on the basis of the type of metric
Other cloud services
Pingdom Sensor
This sensor monitors the status of the selected Pingdom check and response time of a monitored webpage
To use this sensor, you need to configure at least one Pingdom basic check.
Add some screen
Performance Counters:
- Response time (in seconds)
Statuses:
Last Check Status (Contains: time of the latest check, descriptions of statuses, probe id)
Default Alerts:
- Alert on check status - This alert occurs if the "Last Check Status" changes to a
down,unknown,orunconfirmedstate.
Default Report
- Response time - This report collects "Response time" counter data.
Credentials and registration
The sensor requires an API token to work that you can create in the Pingdom application.
NetCrunch requires Read Access permission.
Copy token and create a profile in NetCrunch (Click on edit next to the profile while adding the sensor and select the 'bearer' authentication scheme.
Pingdom sensor can be added to the Cloud Service node only
GitLab Cloud Sensor
This sensor monitors the latest build/job status on a specific project in the GitLab cloud repository. At least one project on GitLab, with configured jobs/builds, is necessary to use this sensor. GitLab documentation about jobs configuration can be found in GitLab CI/CD pipeline configuration reference
Performance Counters
- Total build duration (in seconds)
Statuses
- Last build overall (Contains information about "Last build date" and all "Build stages statuses")
Default Alerts
- Last build status changed to "Failed" - This alert will be generated if "The last build overall" changes to the "Failed" state.
Credentials
-
Access Token: GitLab documentation: https://docs.gitlab.com/ee/user/profile/personal_access_tokens.html#doc-nav E.g. ATzt2bfFo_YqLXsVc-6y
-
GitLab Namespace and GitLab Project name: After entering any project, both can be found within the URL to access your project. E.g., https://gitlab.com/test1ws12/test_123.git- GitLab Namespace is test1ws12, and GitLab Project name is test_123
Alerting
Alerting is the heart of the monitoring system. NetCrunch triggers alerts receive, process and then executes actions in response to them
External Event Sources
See how to create an alert for Syslog messages, SNMP traps, Web Messages, and Windows Event Log entries.
NetCrunch can act as a log server for external events. It can store them in the NetCrunch Event Log and perform defined alert actions (i.e., notifications) as the response. You can also correlate incoming events to track active alerts.
Syslog Server
Settings Monitoring Syslog Server
You can change the port on which NetCrunch listens to Syslog messages (default 514) and set the option to forward each message to another Syslog server.
Message Grouping
NetCrunch waits for a given time frame and groups the same messages. This helps to avoid flooding with the same messages. This may happen in case of a device or service failure.
Configuring Syslog Alerts
Configuring the NetCrunch Syslog server is the first step, while the next one is creating alerts.
You can add an alert to a node sending Syslog messages and specify a filtering condition for the received message. As such, you can create different alerts for different messages.
Only messages matching defined alerts (filters) pass into NetCrunch, whereas others are discarded.
Go to Settings Alerting & Notifications Monitoring Packs and Policies. In the desired monitoring pack, click Add Alert and choose 'New Event for Received Syslog Message.'
You can also go to Node SettingsMonitoring, click on the Syslog tile in the Node section, and click Add Alert.
The window will allow you to declare expected message parameters.
Web Messages
Settings Monitoring Web Messages Receiver
You can easily send an event message to NetCrunch using an HTTP request. The program accepts POST and GET requests. For example, we skip the first part of the URL, your NetCrunch Server Web Access URL. We strongly recommend configuring the server to use HTTPS protocol.
You can use the cURL program (available on multiple platforms) to send requests to NetCrunch. You can download it from curl.haxx.se.
Service URL
http://<nc-server>/api/rest/1/event/<node-identification>
Node identification is a node IP address or DNS name.
Sending message by GET
The simplest way is attaching the message to the URL as a search string.
api/rest/1/event/crm.acme.com?CRM%20must%20be%20restarted
Because URLs cannot contain spaces, it must be properly encoded.
If you form a query string as a parameter list, it will be converted to a JSON object, and then you can create alerts based on these parameters.
Example:
api/rest/1/event/crm.acme.com?error=1
Sending message by POST
NetCrunch accepts data encoded as typical form encoding application/x-www-form-urlencoded and allows filtering events on parameters. Another accepted encoding is JSON application/json.
Curl Example
curl -d "error=1" http://192.168.10.112:8008/api/rest/1/event/192.168.10.1
Configuring Web Messages
NetCrunch can receive messages by default. You can disable this feature and set the message grouping option.
Message Grouping
NetCrunch waits for a given time frame and groups the same messages. This helps to avoid flooding with the same messages. It may happen in case of a device or service failure.
Configuring Web Message Alerts
You can add an alert to a node that sends web messages and specifies the filtering condition for the received message. So you can create different alerts for different messages.
Only messages matching defined alerts (filters) pass into NetCrunch, whereas others are discarded.
Go to Settings Alerting & Notifications Monitoring Packs and Policies, in desired monitoring pack, click Add Alert and choose 'New Event for Received Web Message.'
You can also go to Node SettingsMonitoring, click on the Web Messages tile in the Node section.
The window will let you declare the expected message parameters and create a filter for the messages.
Example
Let's define a simple message alert where any non-empty message will be logged.

Receiving SNMP Traps
NetCrunch receives SNMPv1, SNMPv2, and SNMPv3 traps. It can also forward all received traps to another SNMP manager. Forwarding can be set in Settings Monitoring SNMP Trap Receiver.
On the Settings page, you can check the current status of the SNMP trap receiver. If SNMP is not enabled, click the button, enable it, and set its options.
You can change the port on which NetCrunch listens for SNMP traps (default 162) and set the option of forwarding traps to another SNMP manager.
Trap Message Grouping
NetCrunch waits for a given time frame and groups the same SNMP trap messages. This helps to avoid flooding with the same messages.
Configuring SNMP Trap Alert
You can add an alert to the node sending an SNMP trap by creating a trap alert. You can also receive traps in the External Events window and click on the desired trap to create an alert.
To add a trap alert, go to Node SettingsMonitoring and click on the SNMP Traps tile in the Node section.
To add an SNMP trap to the Monitoring Pack, the SNMP only option must be checked. Otherwise, SNMP events will not be visible.
Monitoring Windows Event Logs
Settings Monitoring Windows Event Log Collector Monitoring Windows Event Log is enabled by default. It's not just a passive receiver like SYSLOG or SNMP trap. The event Log monitor connects to a remote machine and needs authentication to registetooreceiveng Windows Event Log events. It is rather an extension of the Windows Monitoring Engine.
When you click the Windows Event Log button on the Monitoring tab, you can change the Windows Event Log engine's global options.
Event Log Entries grouping
NetCrunch waits for a given time frame and groups the Windows Event Log entries.
Configuring Windows Event Log Alert
Windows Event Log monitoring has the same requirements as standard Windows monitoring. It requires node OS monitoring to be set to Windows. Then you can go to the Windows Event Log tile under the Windows section in Node Settings and add an alert.
Alternatively, you can create a new Monitoring Pack with a set of rules to monitor Windows Event log in Settings Alerting & Notifications Monitoring Packs and Policies
You can also find the 'Security Audit' Monitoring Pack in the global section of defined monitoring packs. It contains alerts based on selected events from the Windows Event Log - Security category.
Alert Conditions & Correlation
NetCrunch alerts trigger proactive actions, not just notifications. They detect missing events and complex conditions while correlating events across nodes to enable tailored responses and automated remediation.
Conditional Alerts
NetCrunch allows you to define additional conditions for each defined alert, regardless if it is a node status, an event log alert, or the SNMP trap. These conditions allow you to trigger an action, even if an event has not been triggered. For example, if there is no log entry confirming an operation (i.e., backup). Also, NetCrunch can receive heartbeat events and notify if one is missing. Other conditions allow you to suppress alert execution for some time (as the alert won't be triggered, the actions set to run on alert close won't be executed).
Available conditions
- On Event Condition
- This is a regular event just triggered by an event condition.
- The event happened at least after (a given time)
- The alert will be triggered only if the event happens after a given time after the previous event of the same type.
- The event happened more than (x times in the last y minutes)
- The alert will be triggered if the event happens more than x times within the given time period.
- Only if the time between
- Restrict events to the given time range. Instead of disabling monitoring, you can disable specific events by setting a time range for them. The time range mask can be set for all weekdays.
- Only if time not between
- Restrict events to a given time range by exclusion.
- The event did not happen in the time between
- Trigger alert only if the event did not happen in the expected time range. For example, you are watching for confirmation of the backup or any other periodic task. It might happen that instead of getting an error, we got nothing.
- The event did not happen after a given time.
- Trigger the alert if the specified event is not detected (received). This condition helps monitor heartbeat kind events. This is one of the simplest alerting schemes implemented by many hardware devices. So we are expecting to receive events every given time period which suppress triggering the alert.
- Event pending for more than (a given time)
- The alert is suppressed for a given period of time to wait for it might be cleared. It is particularly useful in cases when the external event source is oversensitive.
Basic Correlation
NetCrunch triggered alerts are automatically correlated. It means that when the condition causing an event is no longer present, a closing event is triggered, and the alert is closed. This helps manage the pending alert list and execute an action (notification, closing ticket action) on alert close.
Correlating External Events
It is fairly simple when the external source (i.e., trap, syslog message) triggers an event confirming that the alerting condition is no longer present. In such a case, you can add closing correlation events to the given alert.

You can also decide to close the alert automatically after some time, or you can use the alert condition to define a closing alert.
Example
The device sends an alarm message every minute. If there is no error for 2 minutes, we can assume the alert is closed.
Advanced Correlation
Settings Alerting & Notifications Monitoring Packs and Policies Global
You can find the Correlations Monitoring Pack in the global section of defined monitoring packs. It allows defining alerts triggered when alerts from multiple nodes happen within the same time range (window) or when all alerts in the group are pending (all have to be correlated).
These correlated alerts can be for any events previously defined on any node in the Atlas.
Alert Views
Active Alerts
Active Alerts is one of the essential views showing current unresolved issues. NetCrunch tracks the state and correlates all internal events. When defining alerts for external events (SNMP, syslog, etc.), you can easily correlate by defining events that can close the alert.
This separate view shows only current alerts instead of forcing administrators to browse the history event log, which offers a history of all alerts. You can synchronize the Alert view with the Atlas Tree Window to change the Alerts window when you change the current view.
Grid
The Grid (Table) view offers enhanced capabilities for sorting and filtering alerts. This view provides a structured and detailed overview, allowing you to easily organize and pinpoint specific alerts based on various criteria. It's ideal for in-depth analysis and quick identification of important alerts.

Tiles
The Active Alerts Tiles view provides a dynamic dashboard for monitoring the latest active alerts. It highlights the most recent and important alerts, with animations to help you notice new alerts as they appear and observe closed alerts fading away.

Analytics
This view displays the number of alerts generated in the three time ranges (24 hours, 7 days, and 30 days). Additionally, it includes information about nodes with the most alerts, top critical and warning alerts by type, and statistics related to the number of alerts in custom views.

Every chart element is clickable and automatically brings you to the appropriate history view to dig deeper and see all selected events.
History - Event Log Views
NetCrunch offers many predefined event log views and allows you to create custom views using an intuitive query builder. Views can be saved and used for any node group in the Atlas.

You can select the view by dropdown in the center of the header, or you can easily build a new view. Read about Managing Event Log Views
Event Details
The Event Details window offers much more than just displaying more details. It allows you to check why this alert happened and its parameters, and you can change it or disable it for a particular node,

It allows you:
- Reviewing alerting actions execution log
- Checking where the alert is defined
- Adjusting alerting rule (condition)
- Changing alerting action script
- Making an exception by disabling the alert for the node
- Adding comments
- Analyzing alert occurrences in the past
- Modifying Monitoring Pack the alert is part of
- Reviewing all alert parameters
- Changing alert resolution state
This window also shows all executed actions and links to the event that closed a given alert.
If a performance counter value has triggered the alert, the Details view displays a chart showing values at the time of the alert.
Alerting Actions and Escalation
Each alert can have its own alert escalation script. This means that NetCrunch executes actions if the alert condition persists or can execute actions when the alert is closed.
Actions
As a response to an event, NetCrunch can execute a sequence of actions. Actions can also be executed when the alert ends (on close). NetCrunch contains various actions, including Notifications, Logging, Control Actions, and Remote Scripts.
Notifications are very flexible and can be controlled by user-profiles and groups. Additionally, they can be combined with a node group (atlas view) membership, so it's possible to send notifications to different groups based on network node location or other parameters.
Predefined Actions
- Basic Actions: Play Sound, Display Desktop Notification WIndow, Add Traceroute to Alert Message, Add Network Services Status to Alert Message, Notify user or group, Email, SMS via Email, SMS via GSM
- Computer Control Actions: Run Windows Program, Run Windows script, Run SSH script, Restart Computer, ShutDown Computer, Set SNMP Variable, Terminate Windows Process, Control, Start, Stop, Pause Window Service, Wake on LAN
- NetCrunch Control Actions: Change Node Monitoring Time, Modify Node Issue List, Modify Node Custom Field, Set Issue, Clear Issue
- Local Logging Actions: Write to File, Write to Windows Event Log, Write to Unique File
- Remote Logging Actions: Send SNMP Trap, Send Syslog Message, Trigger Webhook
- Linux Scripts: Shutdown Linux Machine, Reboot Linux Machine, Restart SNMP Daemon, Mount CD-ROM, Dismount CD-ROM
- Windows Scripts: Start SNMP Service, Stop SNMP Service
- Integrations: Send messages to slack or other services. Use SMS gateways or open tickets in service desk applications (like Zendesk, ConnectWise, and more). See: Alert Integrations.
See also Alerting Actions
Action Escalation & Conditional Execution
Actions can be executed immediately or with a delay (if the alert is not finished), and the last action can be repeated. Additionally, you can specify actions to be executed automatically when an alert is closed.
For example, you can decide to send a notification to some person and then, after some time, execute a server restart operation.
The script above executes only notifications for critical alerts and restarts the node causing this event to be a Windows Server node.
Receiving SNMPv3 Notifications
SNMPv3 uses a different notification model than previous SNMP versions. To receive SNMPv3 notifications, you need a proper authentication profile since they have to be decoded with a password and given encryption settings.
Because SNMPv3 allows authentication and encryption of receiving traps, you need to define the SNMPv3 Notification profile for them. Otherwise, the program won't be able to decode anything.
Unlike in v1 and v2 profiles, profiles for v3 are global, which means you can define them via NetCrunch Monitoring SNMP Communities and Passwords..., and you do not have to assign them to nodes.

NetCrunch supports the following authentication and encryption protocols:
Authentication Types
- HMAC-MD5-96
- HMAC-SHA-96
- HMAC-192-SHA-256
- HMAC-384-SHA-512
Encryption
- DES
- 3DES
- AES 128
- AES 192
- AES 256
Preventing False Alarms
Learn what situations increase alerts' volume and how NetCrunch helps prevent false alarms.
False alarms can arise in many situations. Here are some typical examples of events which can generate false alarms:
- When an intermediate device fails, all events and devices depending on this device tend to cause false alarms.
- Too sensitive Counter Event Triggers - you are alerted on momentary value change.
- Too sensitive Network Service monitoring: You are alerted when one or two packets are dropped or a single connection is lost.
- Slow responding SNMP devices - sometimes heavily loaded SNMP devices tend to respond with a long delay.
NetCrunch helps you avoid alert overload by implementing the following functionalities:
Prioritized Monitoring
The order and frequency of monitoring nodes depend on the priority; intermediate nodes have a higher priority than nodes connected through them.
Event Suppression
Event Suppression is the technique of preventing false alarms caused by network intermediate connection failure.
When NetCrunch receives an event related to a node connected through the intermediate link, it first ensures the link is OK so a broken intermediate connection does not cause the event. You can define exceptions when you want to receive an event from descendant nodes.
Additionally, NetCrunch can suppress alerts from various node services or sensors. Event suppression is enabled by default. You can disable it by clicking the icon next to network services or in a particular sensor settings window.

Configuration Tips
Fix Counter Event Triggers
When a counter value changes, you should set a trigger on the average value instead of the actual one. You can also define hysteresis by adding a reset threshold to the trigger.
Read more about Event Triggers for Counters.
Fix Network Service Monitoring Parameters
Usually, NetCrunch sends multiple requests in a row to check network service response. To ensure the service responds, increase the service's timeout or set an additional repeat count.
Fix SNMP Monitoring Engine settings
SNMP works over the UDP protocol, which is not reliable, as packets can be lost. In such a case, the program waits a given time, and when it does not get a response, it repeats the request.
Because of the nature of UDP communication, the program can't recognize whether the packet is lost or the device is bus,ywhichd delays the response.
Go to Node SettingsSNMP and increase SNMP timeout for busy devices or SNMP retry count for unreliable connections.
Alert Integrations
NetCrunch can easily integrate alerting with the external service desk, productivity, and messaging systems.
Integration profiles allow you to configure integration actions that can be executed in response to alerts. NetCrunch can automatically send messages and manage the tickets in external systems. Several systems allow two-way integration, which means that NetCrunch can close a pending alert in response to a notification sent from an external system.
From NetCrunch to External Service
Integration Profiles
Several steps need to be completed before NetCrunch can send data to the external system. Each step requires authentication by the API Key created for the application.
Integration Profiles store connection settings for these systems. So before we add an action to the alerting script, we need to open NetCrunch Alerting & Notifications Integrations and add a profile for the system you want to integrate NetCrunch.
We can group these external systems by the type of services provided.
Messaging & Notifications:
- Amazon SNS - send notification via Amazon Simple Notification Service
- Campfire - send a message to Campfire Chatroom,
- IFTTT - send a web request to IFTTT service
- Microsoft Teams - send Microsoft Team Message
- MQTT - publish a message to MQTT Broker
- Pushover - send a notification to devices using Pushover,
- Ryver - send notification via Ryver
- Slack - send notification via Slack
- X - send a tweet or direct message
SMS/Text Messaging:
- Clicatell - Send SMS/text message via Clicatell service
- MessageBird: Send SMS/text message via MessageBird service
- SMSEagle - send SMS/text message via SMSEagle Gateway
Service Desk & Productivity Systems:
- AlertOps - create or close an alert in AlertOps source
- Asana - create, update, or close Asana task
- ConnectWise - create or close the ConnectWise Service Desk ticket
- Freshdesk - create or close Freshdesk ticket
- Freshservice - create or close Freshservice ticket
- JIRA - create or comment on the JIRA Service Desk ticket
- JitBit - create or close JitBit ticket
- LiveAgent - open or resolve LiveAgent ticket
- Mojo Helpdesk - create or close Mojo Helpdesk ticket
- OpsGenie - create or close OpsGenie alert
- PagerDuty - create or resolve PageDuty incident
- Rootly.ai - create or resolve incidents
- Trello - create or update the Trello card
- Zendesk - create or close Zendesk ticket
Adding an Action
Once you have a profile, you can add integration actions to the alerting script. Each action has different options depending on the integration. You can also start by adding actions and creating a profile from the action editor.
From External Service to NetCrunch
Several systems allow information to be sent back to NetCrunch when tickets are closed to close the alert from the NetCrunch side. We need to open Settings Alerting & Notifications Integration API Keys to configure back-links to NetCrunch. The configuration is simple: you add a profile for a given system, and then you can copy part of the URL to send data to NetCrunch from an external system.
NetCrunch Web Access must be accessible outside the firewall. We recommend using a reverse proxy from an edge server, as it gives you more flexibility and allows you to use already-issued wildcard certificates. The other option is to install an SSL certificate into the NetCrunch Web Server, which always runs on the latest OpenSSL version.
Supported Systems:
- ConnectWise
- JIRA
- JitBit
- LiveAgent
- OpsGenie
- Pagerduty
- Rootly.ai
Handling Repeating Alerts
Learn how to handle alerts from devices or systems that keep sending them until the problem is resolved. This way, you get a single alert instead of hundreds of them.
There are situations when the device or service sends us alerts repeatedly. So when the alert occurs, we receive it every minute; otherwise, nothing is coming, which means it works fine now.
By default, an external event does not correlate and triggers actions every time it is received. This is not what we need. You can switch this option off (No pending state), but the alert will require manual closing. It's better because you get only one notification at the alert start, but you won't get the notification when the problem is solved.

You should check the option to close the alert automatically after a given time. The time is measured since the last alert occurrence, so we need this. If the alert is repeated every minute, set the time to two or three times larger value.
Predictive Analysis & Alerting
Forecast lists the monitored counters whose recent trend is heading toward a configured threshold, together with the date each one is expected to cross it. It turns NetCrunch's historical trend data into early warning, so you can deal with a disk that is filling up or memory that is leaking before it triggers a hard alert.
A counter appears in Forecast when it has a Predictive Threshold alert and its recent history shows a statistically sound trend that reaches the configured limit within the prediction period. Forecast is available on the global Alerts › Forecast page (scoped to the selected view) and on each node's Alerts › Forecast tab.
Setting it up
A counter is forecast when it carries a Predictive Threshold alert. Most of these come from monitoring packs — a pack can include predictive thresholds in its default alert set, so they are applied automatically to every node the pack monitors. You can also add or tune one on an individual counter in its threshold editor:
- Open the counter's threshold/alert configuration.
- Add a threshold of type Predictive Threshold.
- Set the limit and direction — raising (value climbing above it, e.g. memory used
>90%) or falling (value dropping below it, e.g. free disk space<10%). - Set the prediction period — how many days ahead the trend may reach the limit.
- Set the Prediction quality — the minimum trend quality before it fires (Low / Normal / High).
The predictive analyzer recalculates on a schedule (daily by default), so a threshold appears in Forecast after the next run, once there is enough history to fit a trend.
How it works
For each predictive threshold the analyzer reads the counter's history from the Trend Database and fits a least-squares linear regression, value ≈ α + β·t, where α (intercept) is the value at the start of the analyzed window and β (slope) is the average change per sample. The line is extended into the future, and the point where it reaches the threshold is the projected breach time shown as the breach date and ETA. A band of ±1 residual standard deviation around the line is used to discard "breaches" that fall within the noise of the data.
Each row's sparkline shows the observed trend (solid) continuing as the projection (colored) up to the red breach marker, against the dashed threshold line, with the current value at the cursor.
Good and poor candidates
Forecasting works on metrics that change slowly and roughly monotonically — where "more of the same" leads to a wall:
- Good: disk and volume space (used or free), database and table sizes, log and file growth, committed or available memory, inode usage, license or session counts.
- Poor: volatile or cyclic metrics — CPU utilization, network throughput, request/transaction rates, queue lengths. These swing with load and rarely trend toward a fixed limit.
The model is a single straight line, so it does not account for seasonality. A counter with daily or weekly cycles (business hours, nightly jobs, weekend dips) will not fit a line well — it yields a low-quality, often misleading projection and is filtered out. Predict on the slow underlying resource (e.g. disk space), not on the cyclic load that consumes it.
Confidence and quality
Two related but distinct settings use the word "quality":
- Prediction quality (set on the threshold) is the bar a trend must clear before the alert fires — Low, Normal, or High. It controls how selective NetCrunch is.
- Confidence (the Forecast column) reports how strong the detected trend actually is for a given prediction — High, Medium, or Low.
Both derive from a trend-quality index in the range 0–1 that measures how well a straight line really describes the data. It is a weighted blend of: R² (variation explained by the line); residual spread (how tightly points sit on the line); slope significance (a t-test that β is real, not chance); homoscedasticity (a Breusch–Pagan test that the scatter stays even and doesn't fan out); normality (a Shapiro–Wilk test that residuals look like random noise); and data sufficiency (enough samples and fill rate over the window). In Forecast, an index of about 0.75 and up reads as High, roughly 0.35–0.75 as Medium, and below that as Low. A clean, steadily changing series with little noise scores near 1; a noisy, curved, or cyclic series scores low and is treated as not predictable.
Default Alerts with predictive threshold
Monitoring Packs:
- Windows\Disk, Windows\Memory
- Linux\Disk, Linux\Memory
- Solaris\Disk, Solaris\Memory
- Mac Os X\Disk, Mac Os X\Memory
- BSD\Disk, BSD\Memory
- VMware\Disk, VMware\Memory
- Proxmox\Disk, Proxmox\Memory
There are two alerts in each Monitoring Pack:
- Volume Free Space will be low soon (%Free Space < 20) (Disk free space will be less than 20% within 1 to 30 days)
- Volume Free Space will be very low soon (%Free Space < 5) (Disk fee space will be less than 5% within 1 to 30 days)
Creating and Editing Alerting Rules in NetCrunch
This chapter provides a comprehensive guide on creating and editing alerting rules within NetCrunch. It covers the key properties that define an alert, such as Severity, Description, and Target State, and explores advanced configurations, including additional alerting conditions and automatic alert correlation. By understanding these concepts, network administrators can optimize monitoring strategies, reduce false positives, and ensure prompt and accurate incident responses.
Key Properties
When setting up alerting rules in NetCrunch, it's essential to comprehend the meaning of the fields that define an alert. You'll encounter three critical fields: Severity, Description, and Target State.
Severity
The Severity field signifies the importance level of the alert. It helps prioritize issues and determine the urgency of the response needed. The severity levels usually range from informational to critical. Here's a brief overview:
- Critical - The severity represents serious issues that need immediate attention, as they can cause significant disruptions if not resolved quickly.
- Warning - It indicates potential issues that may escalate if not addressed but are not critical.
- Informational - Alerts that provide informative insights but do not require immediate action.
- Minor - Minor severity alerts indicate issues that require attention but do not pose an immediate threat to operational functionality, serving as preventative signals to help maintain system health.
Choosing the correct severity level is crucial for proper incident management and ensuring that the right team members prioritize their responses effectively.
Description
The Description field should concisely explain the alert and its context. I.e. High Processor Utilization (> 90%)
Operational State
The Operational State field is essential for understanding the impact of alerts in NetCrunch. It distinguishes between a service merely experiencing issues and one that is entirely down, thus providing critical insight that supports effective incident management and swift resolution.
-
Operational - The object/service is functional. This includes scenarios where performance might be degraded, but the service remains available.
-
Non-Operational - The object/service is not functioning as expected, typically indicating that it is not responding or is entirely offline.
Event Condition
The Event Condition is the core element of an alerting rule in NetCrunch, defining the primary reason for triggering an alert. This condition specifies the exact circumstances under which an alert is generated. For example, it could be set to detect a state change—such as a service transitioning from responding to down—or to monitor a threshold on a particular metric, like CPU usage exceeding a predefined limit.
The alert will be triggered only when the Event Condition is met in conjunction with any configured Additional Alerting Conditions. This dual-layer approach ensures that alerts are both precise and contextually relevant. By accurately defining the Event Condition, you help ensure that the alert system responds only to significant events, thereby reducing false positives and alert fatigue while enabling prompt and effective incident response.
Additional Alerting Condition
NetCrunch allows you to define additional conditions for each alert, regardless of whether a node status change, an event log alert, or an SNMP trap trigger it. These additional conditions enable you to fine-tune the alerting process by triggering actions even when a primary event has not occurred. For example, you can specify conditions based on specific time intervals or the absence of an event, ensuring alerts are only activated under precise circumstances. The available additional conditions include:
- On Event Condition: Trigger an alert when a specific event occurs.
- Only if the time between: Execute the alert only if the event occurs within a designated time window.
- Only if time not between: Trigger the alert only outside a defined time window.
- The event did not happen in the time between: Ensure that the alert is only triggered if the expected event does not occur during a specified interval.
- The event did not happen after a given time: Activate the alert if a particular event fails to occur after a set time.
- Event pending for more than (a given time): Trigger an alert if an event remains unresolved for longer than a predefined duration.
Alert Close Correlation
NetCrunch's alert close correlation feature streamlines the management of alerts by automatically grouping related notifications. For internally triggered alerts—those generated by state changes or threshold breaches—NetCrunch is designed to close them automatically once the issue is resolved.
However, a closing correlation is required for external alerts originating from traps, syslog, or web messages. In these cases, external alerts are paired with corresponding resolution events to ensure they are appropriately dismissed. Alerts can be configured to close automatically after a set period, or they can be manually cleared by an operator once confirmed as resolved. This approach reduces alert fatigue and maintains clarity in the system, ensuring that the actual status of network issues is accurately represented.
Read more about conditions and correlation
Conclusion
Creating and editing alerting rules in NetCrunch requires a clear understanding of the Severity, Description, and Target State fields. Effectively using these fields, along with advanced configurations like additional alerting conditions and automatic alert close correlation, can enhance your monitoring strategy, streamline issue resolution, and ultimately ensure the reliability of your systems.
Monitoring & Visualization
This chapter covers how NetCrunch visualizes monitored data in real time through dashboards, topology maps, node views, and Auto-Screens. It explains how to create dynamic views that present network state clearly and interactively—from high-level overviews to in-depth diagnostics.
Status & Top Charts Dashboards
dashboards-overview
NetCrunch offers multiple dashboard types to visualize real-time system and network status. Each is designed for different scenarios: overview status, performance leaders, or fully customizable layouts.
NetCrunch provides three powerful types of dashboards that adapt to different monitoring needs. Each type offers distinct features for visualizing, interacting with, and drilling into system health and performance data.
Status Dashboard
This built-in dashboard type is available for all node-based views:
- IP Networks
- Physical Segments
- Node Groups
- Dynamic Folders
The Status dashboard provides a structured summary of the monitored environment, with interactive tiles showing alert levels, counts, and categories.
- The Overview view has extended layout and can include custom status panels focused on selected groups or nodes.
- Each alert/warning tile includes tooltips and hint overlays showing which nodes are affected.
- Clicking on an alert icon shows the list of active alerts, which can be expanded into a detailed event view.
Example: Overview Status Dashboard

Example: Alert Popup from Status Panel

- The alert chart is clickable—selecting a bar opens the 24h alert history.
- All dashboard tiles are interactive and link to relevant drill-down views.
For non-overview views, the dashboard layout includes six default tiles: - Monitoring Summary - Alerting (24h) - Network Services - Monitoring Packs - Monitoring Engines - Sensors
Tile order is customizable.
Top Charts Dashboard
Available for any node-based view, this dashboard shows ranked performance charts, for example:
- Top nodes by bandwidth usage
- Interfaces by error rate
- Highest CPU or memory usage
Example: Top Charts Dashboard with Selected Metrics

Each chart: - Can be selected from built-in templates - Can be fully customized with user-defined counters - Supports click-through to open trend viewer (for single series or entire tile)
User can control: - Number of items shown - Sorting direction (highest/lowest) - Alert thresholds (critical, warning) - Filtering by node importance
Custom Graphical Dashboards
To build entirely custom views, users can create Graphical Views with widget panels or boundless canvases. These dashboards support:
- Custom layout
- Live data binding
- Theme support (light/dark)
- Full interactivity and drill-down
Graphical Dashboards
graphical-dashboards
Graphical Dashboards let you build fully customizable panels composed of live data widgets and dynamic visuals. These dashboards adapt to themes, respond to data changes, and offer interactive features for real-time monitoring and user-friendly operation.
Graphical Dashboards offer a range of interactive and responsive features that go beyond basic layout. This section highlights what you can do with dashboards, especially things that are not immediately visible.
$bk$$theming$
Theming Without Duplication
Each dashboard supports automatic theming, adapting to the user's interface theme (light or dark). You don't need to create two versions of the same dashboard—NetCrunch will automatically render colors, backgrounds, and widget styling.

By default, the dashboard is in Auto mode, adjusting to the viewer's application settings. You can permanently make it Light or Dark.
Adaptive Panel Zoom
Dashboards are designed to display cleanly on screens of all sizes. Beyond scaling to aspect ratio, the Auto Zoom option adjusts the visible area dynamically:
- When enabled, the view zooms to focus only on the widgets you've placed, centered with appropriate padding.
- This makes the dashboard perfect for mobile or partial-screen use cases, where unused space is better hidden.

Widget-Based Visualization
While dashboards can include labels, icons, or shapes, their real power comes from data-bound widgets. These include:
- Value panels – display a single metric with optional caption and icon
- Bars – show linear comparisons or thresholds
- Gauges – visual dials (circular or linear) with multiple display modes
- Mini charts – embedded trend charts inside a widget
Most widgets are inserted in a "Themed" style by default:
- They include backgrounds and captions
- They automatically match the dashboard's current theme
- They use spacing and padding optimized for readability
Hidden Power in Widget Options
Each widget contains many powerful options grouped by function. These are not always visible unless the widget is selected and expanded in the editor:
- Display State Logic – shows status via color, arrows, or fill
- Threshold Ranges – define color bands for value ranges
- Change Indicators – visualize upward/downward trends
- Icon Overlays – replace background or add alert-like visuals
- Scaling & Unit Conversion – transform raw values on the fly
These options make widgets more intelligent and self-explanatory when properly configured.
Clickable, Live Elements
All dashboard widgets can be interactive: - Clicking a value widget or bar opens a tooltip with a live preview (e.g., trend or node state) - From the tooltip, users can open the Trend Viewer, Node Status, or perform actions - Visuals respond to real-time changes: flashing, color transitions, or icon switching

The dashboard is not static—it's a live control panel reacting to data.
Snap, Grid & Layers
The editor supports professional design tools behind the scenes:
- Grid snapping (toggleable)
- Alignment and spacing tools
- Bring to front / Send to back layering
- Group selection and multi-move
- Keyboard shortcuts for alignment, duplication, and locking
Though these features mimic tools like Figma or Illustrator, they're tailored to administrator workflows, not designers.
Visual Logic & State-Based Customization
Graphical Dashboards support two main classes of widgets:
Data Widgets
These display live data from counters or statuses:
- Bar
- Gauge (linear or circular)
- Line Chart
- Node icon
- Camera snapshot
They include a Data Source section where the user can bind:
- Node or object (e.g., sensor, interface)
- Counter or metric (e.g., % memory usage, traffic)
- Scaling, unit conversion, or rounding
Most support tooltips with live data previews and access to the trend viewer or node actions.
Reference-Based Widgets (Visual Elements)
These are static by default but become dynamic when bound to a State Reference: - Shapes (rectangle, triangle, blob, etc.) - Icons (font-based) - Symbols (vector-style images) - Pictures - Connection lines - Text and labels
Users can choose from 11 object types, such as:
- Node
- Interface
- Sensor
- Other widget
- Monitoring pack
- …and more
Setting Up a Reference Widget
To make these elements state-aware:
-
Assign State Reference
- Choose object type
- Select node and related object (e.g., sensor)
-
Select Object State
- Choose state to customize (
OK,Warning,Error, etc.)
- Choose state to customize (
-
Customize Visuals
- Modify opacity (can hide the element entirely)
- Change fill, line, stroke, border
- Use dynamic color, icons, or effects
- Customize per state or keep some properties common
Default styles are provided, but users can override every visual aspect.

This lets you build shape- or icon-driven dashboards with precise reactions to live conditions.
Animation & Attention Effects
You can add animations triggered by state changes:
- Animate (e.g., flash, spin, pulse, heartbeat, wiggle)
- Transform (e.g., flip, rotate, scale)
- Trigger Mode (always, or on state change)
These subtle effects help focus attention on critical elements like failed links or overheating nodes.

Real-World Example
A shape or icon can:
- Represent a sensor or switch
- Flash red when a failure is detected
- Hide itself when disabled
- Change its icon or label text dynamically
- Open trend charts or alert details on click
NetCrunch lets you build SCADA-like behavior with far less effort.
Visual Resources
Dashboards support rich visual libraries to enhance layout and clarity.
Images (Pictures)
Pictures can be used for background diagrams, branding, or visual overlays.
They can be stored in:
- Document (local view-only)
- Shared (across multiple views)
- Public (global use within organization)
This system reduces duplication and makes it easy to reuse assets.
Symbols
Symbols are vector-style images representing IT assets and services:
- Categories: Azure, Cisco, Google, VMware, AWS, etc.
- Fully searchable and grouped
- Treated more like images than icons (not font-based)
- Colorized if needed, but retain multi-color appearance

Icons (Font-Based)
NetCrunch supports over 3,000 icons via Font Awesome.
- Supports style: light, regular, solid
- Background shape: circle, hex, square, etc.
- Icon size and position control
- Can reflect the state when bound
These icons are ideal for compact state indicators.
Vector Shapes
A full set of vector shapes is included:
- Geometric shapes: rectangle, circle, triangle
- Flowchart elements: process, decision, input
- Organic shapes: blobs, clouds, connectors

Shapes are fully editable and animatable. They can also reflect the system state.
Interactivity
All visual elements can be:
- Bound to state
- Styled per status
- Clickable for drill-down
- Used as part of composite widgets
A simple icon or shape can become an alert source or a dynamic indicator.
Editing Basics
Graphical Dashboards include a visual editor with streamlined selection, linking, and widget creation tools. The left-side toolbar contains three context-sensitive selectors:
- Selection Tool – for selecting, moving, resizing, and editing existing widgets
- Connection Tool – allows creating connections between any widgets
- Widget Add Tool (+) – opens the widget gallery to insert new visual or data elements
When a new widget is dropped onto the canvas, the editor automatically opens a focused configuration panel. This avoids the need to browse through hundreds of settings initially.
For example:
- Dropping a data widget opens a dialog to select a node and counter
- Dropping an icon launches the icon picker with category filtering and search
This approach makes the experience intuitive, even for users unfamiliar with visual editors.
Multi-Chart Insertion
The editor supports intelligent chart creation. When adding a graph widget, you can configure it in two flexible ways:
- Multiple series for a single node – helpful in comparing different counters (e.g., CPU, memory, disk I/O) on one device
- Single series across multiple nodes – compare the same metric across several nodes (e.g., bandwidth usage)
You can also check the "Put on separate graphs" option to automatically insert multiple graph widgets at once, each with one configured series.
This makes building visual comparisons quick and avoids manual duplication.
Context Menus, Locking & Power Shortcuts
NetCrunch's editor includes a right-click popup menu that reveals advanced object actions and selection tools, modeled after design applications like Adobe XD or Illustrator.
Context Menu Actions
When you right-click a widget, you'll find:
- Select... – choose all widgets of a certain type (e.g., all shapes, all rectangles)
- Align – align to edges, centers, or distribute evenly (see shortcuts below)
- Resize – normalize size to the smallest or largest
- Copy / Duplicate / Delete
- Lock – freeze widget in place so it cannot be moved or edited accidentally
- Bring to Front / Send to Back – control visual stacking of elements
Locking is essential for layered dashboards or background assets like images and shapes.
Alignment Shortcuts
NetCrunch uses Adobe-style shortcuts for alignment operations:
Ctrl + Shift + Left– Align leftCtrl + Shift + Right– Align rightCtrl + Shift + Up– Align topCtrl + Shift + Down– Align bottomCtrl + Shift + C– Align center horizontallyCtrl + Shift + M– Align middle verticallyCtrl + Shift + V– Distribute verticallyCtrl + Shift + H– Distribute horizontally
These shortcuts work with multiple selected widgets to polish the layout quickly.
Type-Based Selection
From the context menu, you can also select all widgets of a specific type, such as:
- All rectangles
- All shapes
- All icons or charts
This makes applying style or layout changes to multiple elements easy without manual selection.
Combined with locking and alignment, this allows users to work quickly across complex dashboards without misplacing key visual components.
Multi-Selection, Zooming & Canvas Control
The dashboard editor supports flexible multi-selection, layout duplication, and viewport control to speed up complex design tasks.
Selecting Multiple Elements
You can select multiple widgets using several intuitive methods:
- Selection rectangle – click and drag to select everything inside the blue box
- Shift + Click – add or remove specific items from your selection
- Context Menu → Select by Type – choose all rectangles, all shapes, etc.
- Ctrl + A – select everything on the dashboard
These tools allow efficient bulk operations like simultaneously moving, aligning, or styling multiple items.
Canvas Navigation
The canvas supports panning and zooming for large views:
- Drag background with Ctrl – pans the visible canvas area
- Mouse wheel – zooms in and out smoothly
- Zoom slider (top-right) – manually set zoom level
This makes navigating large or boundless views fast and natural.
Copy, Paste & Duplication
- Ctrl + C / Ctrl + V – standard copy & paste between views
- Ctrl + D – duplicates selected elements in-place
- Alt + Drag – creates a duplicate while moving the original
When an element has connections, any duplicated version will retain those connections. This is especially useful for replicating status-linked layouts or structured diagrams without manually reconnecting lines.
Widgets also preserve their configuration and references when duplicated or pasted, allowing rapid reuse of common visual elements or layouts.
These advanced selection and navigation capabilities make dashboard design fluid and powerful, ideal for constructing rich views quickly with precise control.
Sharing and Embedding
sharing-embedding
NetCrunch allows for secure sharing of individual graphical views, enabling targeted visibility for specific users, departments, or external audiences. Sharing supports iframe embedding and HTTPS-based access, making it ideal for dashboards, executive summaries, and MSP-customer overviews.
Introduction
Sharing graphical views in NetCrunch enables focused, read-only visibility into parts of your infrastructure without exposing the entire system. Instead of giving users full access to the Web Console, you can share specific dashboards or maps, making them accessible only to the intended audience.
Use Cases for Shared Views
- Internal teams – grant management, DevOps, or NOC staff a direct link to a tailored dashboard
- Wall-mounted or kiosk displays – use auto-rotating dashboards to show service health in real time
- MSPs (Managed Service Providers) – share each customer’s infrastructure status through an isolated dashboard or diagram
- Customers or partners – provide a summary view of uptime or service metrics without exposing sensitive data
Sharing Methods
A shared view can be published in two ways:
- Local Web Server Link – accessible within your network using the built-in web server
- Connection Cloud Link (NetCrunch VPN) – securely shared over the internet using a
https://ncconsole.net/rc/connect/...address
These links use secure HTTPS transport. Even for local access, we recommend using HTTPS with a proper or self-signed certificate. HTTP is discouraged and may be deprecated in future versions.
By isolating what's shared and how it’s accessed, NetCrunch ensures data security, performance isolation, and user simplicity—no full console is required.
How Sharing Works
Shared views in NetCrunch use a restricted console-like interface designed solely for viewing. It provides a lightweight, secure way to present dashboards or diagrams without exposing the full system.
Unlike full Web Console access, shared views:
- Do not allow navigation beyond the assigned views
- Do not expose management features or node-level controls
- Are designed to be read-only and safe for public or semi-public access
What the User Sees
When a user opens a shared view link:
- A pulsing "LIVE" indicator appears in the top-left corner, confirming the view is up-to-date
- A dropdown selector shows all views currently assigned to that link, allowing instant switching between them
- Tooltips, charts, and details work normally, but no configuration or actions are available
This interface behaves like a minimal console, focused on visual clarity and simplicity. It's ideal for management, customers, or external stakeholders who need insights, not tools.
Behind the Scenes
NetCrunch handles shared views by automatically creating a dedicated "sharing user". This user:
- Cannot log in to the standard Web Console or Desktop Console
- Only sees the views assigned through sharing
- Reflects changes in real-time (view edits, additions, or removals)
If you assign additional views to an existing link, they become instantly available in the dropdown—there is no need to redistribute URLs. This makes sharing maintainable and scalable.
Link Access
A shared link can be:
- Local – if using your internal NetCrunch web server
- Remote (Internet) – via NetCrunch Connection Cloud
- Password-protected – optional
- Set to expire – define how long the link remains active
This combination ensures that shared access can be temporary, restricted, or public, depending on your needs.
Unlike the restricted Web Console (which still loads authentication, user profiles, and management modules), the sharing console is ultra-lightweight and contains only the essentials for view rendering.
- There are no background services, no configuration APIs, and no sensitive UI elements
- This makes it harder to attack, easier to cache, and far more efficient for remote or large-scale deployments (e.g., MSP dashboards, NOC wall views)
Sharing Options
To share a graphical view in NetCrunch, click the Share button at the view's top-left corner. This opens a guided sharing wizard where you configure who can access the view, under what conditions, and how.
Step 1: Choose or Create a Sharing User
- You can share the view with an existing sharing user or create a new one.
- Start typing an email address or click the dropdown arrow to see existing entries (typeahead support).
- Each sharing user is read-only and restricted to assigned views only.
Step 2: Configure Access Options
When creating a new user, you can decide:
- Whether a password is required to access the shared view
- Whether the view can be embedded in an external page using an iframe
These options affect how and where the view can be accessed. We recommend setting a password for sensitive dashboards and avoiding embedding unless required.
Step 3: Set Expiration and Navigation
- Define an expiration date for the shared link, if needed
- Decide whether to share linked views
Sharing linked views enables navigation between views, creating a portal-like experience using buttons or clickable widgets.
Step 4: Copy Access Link
NetCrunch generates two links for you:
- Local Access Link – works within your internal web server (e.g., http://yourserver/view)
- Internet Access Link – uses the secure Connection Cloud URL (e.g., https://ncconsole.net/rc/connect/...)
You can copy and send the link manually. NetCrunch never sends links automatically to the user.
If using password protection, we recommend sharing the password via a separate channel from the link (e.g., email and text message).
These steps ensure that you maintain complete control over who sees what, for how long, and under what conditions—all while keeping sharing secure and self-managed.
Embedding a View
NetCrunch allows shared views to be embedded into other websites, portals, or dashboards using an HTML <iframe>. This makes it easy to present live dashboards on intranets, customer portals, or wall-mounted displays.
How to Embed
You can copy the generated code snippet after enabling the "Allow embedding" option during sharing.
Server Restriction
When enabling embedding, you can optionally restrict which server or domain can embed the view. By default, the field accepts * to allow embedding from any origin.
You can enter a specific hostname (e.g., intranet.company.com) to restrict where the view is displayed. This helps reduce the risk of unintended exposure.
Security Requirements
Embedding requires proper configuration of the embedding site’s Content Security Policy (CSP). The CSP must include the NetCrunch sharing domain under frame-src or child-src.
For example:
Content-Security-Policy: frame-src https://ncconsole.net;
Additional notes:
- Avoid using
http://—browsers may block insecure content from being embedded in secure (https://) pages - Even a self-signed HTTPS certificate is acceptable for internal use
- NetCrunch plans to deprecate HTTP-based sharing entirely
Embedding Use Cases
- Displaying internal dashboards in intranet portals
- Creating customer-facing panels for service visibility
- Rotating wallboard displays for NOC rooms or operation centers
- Embedding multi-view dashboards using links between views
Behavior of Embedded Views
- Views are fully live, read-only, and theme-sensitive
- No navigation or toolbar is displayed unless linked views are enabled
- The view auto-scales to the iframe size and supports a responsive layout
- Additional views assigned to the same sharing user appear in the dropdown
Embedding is a secure and efficient way to deliver targeted insight from NetCrunch without exposing system internals or requiring user authentication.
Managing Shared Views
NetCrunch provides users and administrators with tools to manage access to shared resources effectively while keeping control centralized and secure.
Removing Shared Views
To revoke access to a shared view:
- Open the view in the Web Console
- Click the Share button
- In the "Shared by me" tab, open the context menu next to the shared user
- Select Unshare
This will immediately remove the view from the user's dropdown menu and deactivate the link. The view is no longer accessible without deleting the sharing user entirely.
Note: NetCrunch does not allow editing shared user settings after creation. To change access (e.g., password, expiration, or embedding), you must remove the user and recreate it with the new settings.
Administrator View of Shared Users
Administrators can view the full list of shared users via:
Users & Access Rights Manager → Sharing
This panel shows:
- The list of shared view users
- Creator identity (Admin or named user)
- Sharing method (with or without password)
- Number of views shared
However, this view does not allow editing—it’s for visibility and audit only. Modifications still need to be made directly from individual views.
Auditing Shared Activity
NetCrunch logs all sharing-related operations in the Activity Log tile ApplicationsServer
You can track:
- When a shared view was added
- Who added it
- Login/logout events of shared view users
- IP addresses accessing shared links
This provides administrators and security teams full visibility into the shared access lifecycle, including configuration changes and usage.
NetCrunch balances ease of sharing with clear boundaries: complete administrative control stays with the owner, while shared views remain lightweight and safe for external use.
Linking Between Views
One of the most powerful ways to enhance shared views is by linking them. NetCrunch allows you to create navigation between graphical views, turning individual dashboards into a complete, self-contained monitoring portal.
Why Link Views?
Shared links are great for single dashboards—but sometimes you want more:
- A home view that leads to detailed service dashboards
- A network map that links to per-site or per-customer views
- A high-level summary that drills into component-level diagnostics
By linking views, you allow users to move freely between views, without ever seeing the full NetCrunch interface.
How It Works
When sharing a view, you can enable the option “Include linked views.” This means:
- The user can also access any linked graphical view
- The links behave like navigation buttons or portals inside the shared interface
- Linked views appear automatically in the top dropdown menu
All transitions between views happen within the shared viewer. The user does not need a new link or reauthentication.
Linking is not just a design convenience—it’s a way to deliver structured navigation to users who shouldn’t see the entire system.
Creating Navigation
To create links between views:
- Add a shape, icon, or label to the graphical view
- Use the action menu to assign a navigation action (e.g., Go to View)
- Select the target graphical view from the list
This allows you to design clickable dashboards, just like a web application.
Example Use Cases
- A managed service provider (MSP) creates a shared home view with tiles linking to each customer's service dashboard
- An enterprise displays a wallboard with the option to zoom into specific departments
- An admin team builds a diagnostic dashboard with links to alert zones, charts, and node detail views
By combining links and embedding, you can deliver full navigable monitoring experiences to users without requiring logins or console access.
Viewer Experience
When someone opens a shared view—whether directly through a link or embedded on a webpage—they are presented with a simplified, focused interface that loads instantly and updates in real time.
What the Viewer Sees
- A pulsing “LIVE” indicator in the top-left corner confirms real-time updates are active
- A dropdown menu displays all available shared views assigned to that user
- The selected view is shown exactly as designed, including themes, scaling, and widget behavior
- Tooltips show detailed information (e.g., sensor values, trend previews), just like in the full console
If linked views are enabled, users can navigate between them using view links or from the dropdown selector—no reloads, re-logins, or new URLs required.
Theme & Responsiveness
- Shared views automatically respect the viewer’s light or dark theme (or apply the view’s fixed theme if configured)
- Dashboards scale to fit the container, whether opened standalone or in an iframe
- Panels can auto-zoom to content, ensuring optimal visibility on large displays or mobile screens
What’s Not Available
Shared view users cannot: - Access the full console - Perform any configuration or actions - View node lists or edit views - Access login-based features (sessions, roles, settings)
This ensures the view remains secure, read-only, and safe to expose to public or limited-audience environments.
Designed for Clarity
Whether embedding a live KPI display in a customer portal or rotating dashboards on a wall monitor, the shared view interface provides a focused, elegant way to share NetCrunch insight without complexity.
Network Topology Maps
NetCrunch automatically builds network topology maps to visually represent logical routing and physical Layer 2 connections between network devices. These maps aid in understanding network structure, monitoring connectivity, and troubleshooting problems.
Introduction
Network topology maps in NetCrunch provide a dynamic, visual representation of how devices are connected and communicate across your network. These maps fall into two categories:
- Routing Maps (Logical Topology) – showing relationships between routers and IP networks.
- Physical Connection Maps (Layer 2) – illustrating port-level connections between switches and devices.
To generate accurate topology maps, NetCrunch relies heavily on SNMP data. SNMP must be enabled on your network equipment for NetCrunch to access the necessary connectivity and port mapping details. Fortunately, nearly all business-grade hardware supports SNMP, and NetCrunch includes a built-in MIB compiler for vendor-specific extensions.
By default, NetCrunch uses the following protocols to detect network structure:
- STP (Spanning Tree Protocol)
- CDP (Cisco Discovery Protocol)
- LLDP (Link Layer Discovery Protocol)
- SNMP Forwarding Tables (RFC 1493)
Although SNMP forwarding tables can assist in building topology, maps based solely on them might not be fully accurate—especially when devices do not fully expose their topology or omit VLAN data.
If your generated topology maps do not match your real-world network layout, the most likely cause is that a device is not being monitored. An incomplete topology is usually a sign that NetCrunch lacks visibility into one or more infrastructure devices.
To ensure reliable topology mapping:
- Verify all switches and routers are added to the Atlas
- Confirm SNMP is enabled and accessible
- Use proper SNMP profiles with required credentials
If NetCrunch can’t see it, it can’t map it. Visibility is the prerequisite for topology accuracy.
When NetCrunch detects isolated or unreachable switches, it will display a live warning above the topology map. This alert may indicate that intermediate devices are missing or that SNMP is not properly configured on one or more switches. These warnings help quickly pinpoint where visibility gaps are breaking topology continuity.
Topology maps are also organized by site. A site in NetCrunch represents an isolated network location, typically defined by a unique address space, such as a network behind a NAT. Sites help prevent IP conflicts and allow topology to be visualized per-location. Each site can be monitored by one or multiple monitoring probes, which collect data and relay topology updates to the main server. This organization enables effective monitoring of distributed or multi-location environments without requiring direct routing between them.
Routing Maps (Logical Topology)
Routing maps in NetCrunch show how routers and subnets are logically connected across your network. These maps provide a high-level view of inter-network communication paths, helping you quickly assess network structure, routing issues, and device reachability.

Automatic Generation
Routing maps are automatically created for each monitored address space. NetCrunch builds them by analyzing IP address assignments, router interfaces, and routing tables obtained via SNMP.
The layout is dynamically generated and updated as topology changes. Unlike static diagrams in many other tools, NetCrunch maps are live, data-driven, and can reflect real-time routing changes.
Interactive Visualization
Each routing map includes the following interactive features:
- Monitored interfaces are color-coded to reflect current status (green for OK, red for down, yellow for warning).
- Interfaces are clickable — clicking an interface displays its real-time traffic and status information.
-
Nodes and networks are draggable — you can reposition any item on the map.
- Once moved, a node becomes pinned — NetCrunch will preserve its position during automatic layout recalculations and adjust the layout around it.
- A legend panel is available in the top-left corner. It allows quick node searching by name or address. Clicking a node in the legend automatically zooms and pans the map to that node's position.
Monitored vs. Unmonitored Networks
In routing maps, monitored subnets are shown using a tile grid icon, while unmonitored networks are marked with a distinct, lightweight network icon.
When you click an unmonitored network: - NetCrunch offers to add the network to monitoring. - Upon confirmation, the subnet is scanned, and discovered devices are added to the Atlas.
This feature makes it easy to incrementally expand monitoring coverage directly from the topology map, ensuring no reachable segment is left unmanaged.
Layout Types
NetCrunch supports multiple layout modes for routing maps:
- Graph Layout – Displays routers and subnets as connected nodes in a flowing graph structure.
- Hybrid Layout – Offers a more compact, space-optimized view by grouping elements.
The layout mode can be changed at any time using the layout selector above the map.
Physical Connection Maps (Layer 2)
NetCrunch visualizes Layer 2 (physical) topology by mapping switch-to-switch and switch-to-node port connections. These maps are derived from SNMP data and from discovery protocols such as CDP, LLDP, STP, and MAC address forwarding tables.
Unlike many other tools, NetCrunch does not overload the top-level map with thousands of end nodes. Instead, it separates the global Layer 2 view from per-switch segments, offering clarity and scalability.

Hierarchical Structure
The top-level map shows only the switches and their interconnections. Endpoints (e.g., computers, printers, IP phones) are not placed directly on this map to maintain readability—especially in large networks with thousands of devices.
Instead, each switch has its own segment view, listed under the Physical Connections container in the Atlas tree. These views display:
- Connected nodes per port
- Virtual interfaces (e.g., port channels)
- Live interface links for detailed traffic and status
Sometimes, a single port may appear as its own segment. This usually means multiple endpoints are connected through an unmanaged switch (i.e., a switch NetCrunch cannot see via SNMP).
Segment Interaction
In each segment view:
- Switches are visually linked to their ports
- Clicking on a port node opens a live interface popup with real-time traffic, utilization, errors, discards, and historical data (as shown in the popup from the screenshot)
- Clicking the switch-to-segment link (visible on top-level map) opens the same port-level detail panel
These insights allow for quick identification of overloaded ports, dropped packets, or faulty cabling.

Layout & Navigation
Like routing maps, Layer 2 maps are fully interactive:
-
Nodes and ports can be moved manually
- Once moved, they are pinned in place
- The system will auto-layout unpinned elements around the pinned ones
- A legend panel is available to search and locate any node or port; clicking it pans/zooms to the selection
-
Three layout modes are available:
- Tree – ideal for hierarchical topologies
- Star – places the switch at the center
- Graph – organic layout for more complex arrangements
- In Auto mode, NetCrunch chooses the most suitable layout based on segment structure
This separation between global and per-switch views—combined with layered navigation—makes NetCrunch uniquely capable of visualizing large-scale physical infrastructures without clutter or performance degradation.
Configuration and Setup
For physical topology maps to function properly, several configuration steps must be completed to ensure full device visibility and data accuracy.
Enabling Physical Monitoring
Physical connection monitoring must be explicitly enabled in NetCrunch. To activate it:
- Go to Settings → Monitoring → Physical Connections Monitoring
- Enable monitoring and SNMP discovery protocols (CDP, LLDP, STP, and forwarding tables)
- Apply changes and ensure proper SNMP access to all switches
This allows NetCrunch to begin polling devices for port-level data and build the physical connection maps automatically.
Managing SNMP Profiles
Accurate SNMP access is essential for physical topology mapping. You must ensure that SNMP credentials are correctly configured and matched to devices.
To manage SNMP profiles:
- Open Settings → Monitoring → Credentials Manager → SNMP
- Add one or more SNMP v1, v2c, or v3 profiles, depending on your environment
Once a profile is defined:
- If a device is already in the Atlas, NetCrunch will automatically try to match it with the correct profile
- You can also open any individual device’s settings, enable SNMP, and assign a specific SNMP profile manually
There are multiple ways to assign SNMP access, and it’s crucial to verify this step for every switch that should appear on the physical map.
Using the Physical Segments Configuration Wizard
To accelerate and fine-tune the configuration:
- Open the Physical Segments Wizard from the context menu or toolbar
- The wizard scans available SNMP-enabled switches
- It helps you group interfaces, resolve port-channel naming, and organize switch segments into Atlas views
The wizard ensures that each relevant device is properly included and the resulting maps are logically grouped and navigable.
Assigning Switches Manually
If a switch is not automatically placed into a segment, you can:
- Locate the switch node in the Atlas
- Open its context menu and choose "Add to Physical Connections"
- Select or create a segment for manual placement
This manual method is especially useful when SNMP visibility is partial or when devices use non-standard MIBs or discovery protocol implementations.
Troubleshooting Missing Devices or Incomplete Maps
The most common issues with topology accuracy stem from missing or misconfigured SNMP access. To resolve:
- Ensure all switches have correct SNMP credentials and profiles
- Confirm SNMP profiles are properly assigned in the Credentials Manager
- Use NetCrunch node tools to test SNMP communication
- Check that all switches use supported discovery protocols (CDP, LLDP, or STP)
- Validate that switches are actually forwarding MAC address tables
If segments appear with nodes grouped under one port or if entire switches are missing, the cause is typically:
- An unmanaged switch or dumb hub between devices
- A device not monitored or added to NetCrunch
- SNMP forwarding table limitations (incomplete or outdated entries)
You can always re-run discovery, adjust switch assignments, or tune SNMP configuration to restore map completeness and clarity.
Live Interface Status and Traffic
One of the most powerful aspects of NetCrunch’s physical topology maps is their ability to present live interface metrics directly within the map view. This gives administrators immediate visibility into the performance and health of individual ports and connections.
Real-Time Data Per Port
Each switch port displayed on a physical segment can be clicked to reveal a live interface popup. This panel shows:
- Port name and alias
- MAC address
- Link speed and current usage (inbound/outbound)
-
Status indicators for:
- Operational state
- Administrative state
- Interface errors, discards, and traffic statistics
-
Interactive traffic chart, which displays:
- Current and historical traffic data (live, 24h, 7d, 30d)
- Input/output volume over time
- Discards and errors at-a-glance
This allows you to identify bottlenecks, faulty cables, misconfigured VLANs, or flapping ports directly from the topology view—without switching to other tools or interfaces.
Switch-to-Segment Links
On the global physical topology map, each switch is linked to its physical segment. Clicking on this link opens the live interface popup for the corresponding port or port channel.
This feature provides a direct path from the high-level overview to low-level diagnostics, enabling efficient root-cause analysis of network issues.
Performance Metrics Available
When SNMP is correctly configured and monitored, NetCrunch collects and displays the following per-interface data:
- Traffic (in/out Mbps)
- Packet discards
- Error counts
- Total bytes transferred
- Interface uptime
These metrics are updated in real time and can be trended over time for capacity planning and anomaly detection.
With this level of per-port granularity, NetCrunch transforms passive diagrams into active diagnostic dashboards.
Navigating and Managing Topology Views
NetCrunch’s topology maps—both routing and physical—are designed to be more than static diagrams. They are live, interactive, and navigable interfaces that help users work efficiently in large-scale environments.
Atlas Tree Integration
Each topology view is accessible directly from the Network Atlas tree, which organizes all views hierarchically. Topology views are grouped under:
- IP Networks (for routing maps)
- Physical Connections (for Layer 2 maps)
You can expand these containers to browse all generated or user-added maps, including segments and special views. Selecting an item in the tree opens its live map view in the right pane.
Map Navigation Tools
Every topology map includes built-in tools to help users navigate large or complex networks:
- Pan and Zoom – Use mouse drag and scroll to pan and zoom the canvas freely
- Auto-Center – Use the auto-center control to refocus the view on the core of the map
-
Legend Panel – A small pop-up at the top-left allows:
- Search by node or address
- Quick navigation – Clicking an entry automatically zooms and pans to that object
- Layout Selector – Choose between Graph, Tree, Star, or Auto layout modes (depending on map type)
The layout engine ensures visual clarity and responsiveness even with hundreds of objects.
Manual Editing and Pinning
Topology maps support full manual layout control:
- Move any object by dragging it on the map
- Moved objects are pinned — they will retain their positions during future layout recalculations
- The system automatically arranges unpinned objects around pinned ones for optimal readability
This hybrid of automatic and manual layout makes it easy to tune visual structure while preserving clarity.
Linking and Navigation Between Maps
Devices often appear in multiple maps (e.g., a switch in physical segments and in routing maps). NetCrunch allows:
- Contextual jumping between views – For example, right-clicking a device may offer shortcuts to its related physical or routing map
- Consistent layout rules across views – So users quickly recognize objects and relationships
Topology views can also be linked to dashboards, node detail views, or embedded in Graphical Views for advanced use cases.
By combining live data, flexible layout, and intelligent navigation, NetCrunch makes its topology maps practical tools for daily operation—not just documentation artifacts.
Best Practices and Use Cases
NetCrunch topology maps are not just visual aids—they are functional tools used daily for troubleshooting, planning, and operational awareness. Below are key practices and real-world scenarios where topology mapping delivers significant value.
Use Topology to Verify Connectivity and Detect Gaps
- Ensure full visibility by confirming that all infrastructure devices are mapped and monitored
- Use routing maps to identify routing gaps, such as disconnected networks or missing routers
- Use physical maps to find unseen segments, like unmanaged switches or incorrect port setups
Unmapped nodes or ports often indicate misconfiguration or limited SNMP access—critical issues that can be resolved before they affect operations.
Detect Misconfigured or Faulty Devices
- Quickly spot down interfaces or isolated switches via real-time indicators
- Monitor interface errors and discards at-a-glance across the map
- Identify endpoints connected to the same port (often a sign of unmanaged intermediary hardware)
Topology maps help uncover devices that are improperly added, assigned the wrong VLANs, or physically miswired.
Troubleshoot Site-to-Site or Subnet Routing Issues
- Use routing maps to trace path relationships between subnets
- Detect broken links or unreachable networks caused by router failures or incorrect static routes
- Pinpoint which site or device is failing when multiple monitoring probes are deployed
This is particularly useful in multi-site or NATed environments, where routing visibility is otherwise fragmented.
Track Redundant and Critical Paths
- Visualize redundant switch uplinks, link aggregation groups, and spanning tree behavior
- Confirm HA configurations and validate that backup links are active and monitored
- Assess single points of failure directly from the map structure
By seeing which ports and links carry critical traffic, teams can better prioritize upgrades or repairs.
Align Maps With Change Management
- Use before-and-after snapshots to validate changes during switch replacements or topology redesigns
- Observe automatic remapping as devices are added or removed
- Reduce downtime risk by understanding how changes will impact dependent nodes
In dynamic environments, topology maps reduce human error and accelerate safe rollouts.
Whether you're operating a small LAN or a multi-site distributed infrastructure, NetCrunch topology maps give you a live, graphical interface to manage, diagnose, and improve your network.
Related Features
Topology maps in NetCrunch are tightly integrated with several other key platform features. Together, they create a comprehensive environment for monitoring, visualization, and diagnostics.
Interface Monitoring
All topology views reflect live status and performance of network interfaces, powered by SNMP polling:
- Interface utilization (in/out)
- Error and discard counters
- Link state (up/down/admin status)
- Historical trends
This interface-level visibility enables real-time health monitoring directly from topology diagrams.
Monitoring Dependencies
Topology maps help visualize dependencies between nodes, such as:
- Switch-to-endpoint relationships (Layer 2)
- Router-to-subnet links (Layer 3)
NetCrunch uses this structure to automatically determine root causes of alerts. For example, if a switch goes down, alerts from connected endpoints are suppressed or deprioritized, avoiding alert storms.
SNMP Configuration Tools
The SNMP Credentials Manager allows defining and managing all SNMP v1/v2c/v3 profiles:
- Centralized access via Settings → Monitoring → Credentials Manager
- Automatic profile matching for newly added devices
- Manual SNMP configuration per-node, with testing tools included
Proper SNMP setup is critical for accurate topology and interface data collection.
By combining real-time interface data, smart alert correlation, flexible SNMP management, and customizable visuals, NetCrunch topology maps act as both operational tools and communication assets for IT teams.
Auto-Screens – Automatic Full-Screen Network Presentation
NetCrunch Auto-Screens allow you to cycle through live views in full-screen mode across one or more displays. Designed for NOC and control room usage, Auto-Screens help keep teams informed in real time by rotating through non-scrollable dashboards, topology maps, and other visual summaries.
Overview
The Auto-Screens application is available in the NetCrunch Console, under Applications → Auto-Screens. It allows you to play full-screen live presentations of selected network views, cycling through them automatically at a defined interval.
This feature is designed for:
- NOC displays and monitoring stations
- Wallboard presentations
- Rotating status dashboards in control rooms
Auto-Screens are available in both the desktop and web console. You can open:
- Multiple scenarios in the same console session
- Multiple windows, each running a separate view sequence
This makes it easy to distribute different Auto-Screens across different monitors or browser tabs.
Creating and Managing Scenarios
Users can create and configure screen scenarios, each containing a set of live views. A scenario defines:
- The name of the screen sequence
- The interval (in seconds) for switching between screens
- The views to be displayed (routing maps, physical segments, graphical dashboards, etc.)
Each scenario is shown as a tile in the Auto-Screens panel, with the option to start playback or edit the scenario.
Scenario Editor
Clicking on a scenario opens the Edit Screens dialog. Here you can:
- Add or remove views from the scenario
- Select dashboards and maps for each node or group
- Choose which widgets (e.g., Status, Top Charts, Map) to include
Only non-scrollable views are supported—tables and long reports are excluded because they are not suitable for display in rotating dashboards. This is an intentional design decision to ensure each screen:
- Displays relevant, real-time status
- Is fully visible without interaction
- Does not require scrolling to understand
❗ Dashboards should always present live system state at a glance. Scrollable, dense tables are not dashboards—they are tools for filtering, sorting, or reporting. Many users confuse this with Grafana-style “dashboards” that act more like static reports. In Auto-Screens, the focus is always on presenting the current situation clearly and immediately.
Using Auto-Screens Effectively
- Create scenarios tailored to different teams (e.g., network, server, security)
- Use short intervals (5–15 seconds) for fast-paced environments
- Deploy in full-screen kiosk mode on wall-mounted monitors
- Run multiple windows on large setups to track distinct locations or domains
Whether used in a data center, campus NOC, or remote support team, Auto-Screens provide a passive, real-time awareness layer that augments active alerting and troubleshootin
Node Status Overview – Real-Time Monitoring & Context
The Node Status window in NetCrunch provides a comprehensive, real-time view of a monitored node’s condition. It includes monitoring status, performance metrics, activity logs, system properties, dependencies, alerts, and more. For Windows, Linux, hypervisors, and network devices, NetCrunch presents unmatched visibility in a unified interactive interface.
Overview
The Node Status window is the central panel for accessing complete, live information about any monitored node. The layout dynamically adapts to the type of node—Windows, Linux, ESXi, switches, routers, or others—and presents tabs that combine monitoring data with configuration and historical insights.

It provides:
- A unified entry point for monitoring and diagnostics
- Immediate access to alerts, trends, counters, and hardware/software state
- Deep system visibility without the need for agents
- Actionable views with remote control over processes and services (Windows)
Left Navigation Tabs (Context-Sensitive)
The following tabs may appear depending on node type:
- Overview – Overall health, monitoring targets, recent events, system metadata
- Performance – Visual charts of monitored counters (CPU, memory, disk, network)
- Windows – Advanced monitoring for Windows systems (see below)
- System – Linux/Unix process and network views
- Sensor Views – Specific to monitoring sensors on a given node
- ESXi – VMware-specific views for hosts, guests, and storage
- Interfaces – Switch/router interface metrics, VLANs, errors
- Dependencies – Live map of upstream/downstream connections
- Notes – Editable note log for operational documentation
- Activity – Monitoring activity log for changes, failures, actions
- Alerts – List of current and past alerts for this node, linked to counters
Windows Tab (for Windows Nodes)
The Windows tab includes specialized subviews offering live data and change tracking—not just static status.

● Services
- List of system services with real-time status
- Control actions: Start, Stop, Restart remotely
● Processes
- Live process list with CPU/memory usage
- Allows remote termination of selected processes
- Helps detect hung or runaway applications
● Sessions
- Displays currently active RDP or local sessions
- Username, session type, and login time
● Scheduled Tasks
- Lists scheduled tasks from Task Scheduler
- Includes last run time, status, and next run
● Hardware
- Monitors key physical components (CPU, RAM, disks, BIOS, etc.)
- Tracks hardware configuration changes over time
- Compares current vs. previous inventory states
● Software
- Displays all detected changes in installed applications
- Tracks installs, uninstalls, and version updates
- Allows comparison of software state across time
- Helpful for auditing unauthorized or unexpected deployments
● Hotfixes
- Lists installed Windows updates (KBs)
- Includes timestamps and versioning
- Change view highlights when updates were added or removed
● Updates
- Summarizes current state of pending and installed OS updates
- Gives visibility into patching status
- Complements Hotfixes by showing system update queue
● Virtual Machines (Hyper-V only)
- Lists VMs hosted by this Hyper-V node
- Displays resource usage and state of each guest
All of these views support historical snapshots, comparisons, and are part of NetCrunch’s monitoring layer—not just informational screens.
System Tab (for Linux/Unix Nodes)
The System tab includes runtime diagnostics for:
- Processes – Live view of running processes and usage
- Opened Files – Real-time file descriptor access
- TCP Connections – Active and listening sockets
- Sockets – Summary grouped by protocol and type
These are pulled via SNMP and SSH, offering high-value operational insight without installing agents.
ESXi Tab (for VMware Hosts)
When connected to VMware APIs, NetCrunch displays:
- Hardware Status – Health metrics: fans, sensors, temperatures
- Virtual Machines – List of all VMs with power state and metrics
- Datastores – Storage capacity, usage, and provisioning status
This gives full visibility into virtualization infrastructure from a single screen.
Interfaces Tab (Switches and Routers)
For network gear, the Interfaces tab displays:
- Interface list with operational and admin status
- Live traffic metrics (in/out throughput)
- VLAN assignments
- Packet errors and discards
- Link speed and duplex state
Each port includes a detailed popup with visual charts and counters. Interactive elements allow quick pinpointing of overloaded or misconfigured ports.
Configuration & Inventory Change Tracking
Many subviews in the Node Status window support change history, not just current values.
Hardware / Software / Hotfixes
- NetCrunch tracks and stores changes in these categories over time
- You can compare any snapshot to previous states
-
Useful for investigating:
- Unauthorized software installs
- OS rollbacks or update issues
- Hardware swaps or reconfigurations
This makes NetCrunch function as a configuration monitoring solution, not just a performance monitor.
Device Configuration (Switches, Routers, Firewalls)
Network devices that support CLI access expose a Device Configuration tab:
- Runs commands like
show version,show configuration, etc. - Snapshots are versioned and compared automatically
- Line-by-line diff shows what changed and when
-
Use cases:
- Auditing switch/router config changes
- Detecting policy drift
- Backing up CLI configurations

NetCrunch’s Node Status window is a single-pane, deeply integrated monitoring console. It unifies status, alerts, trends, configuration, and change intelligence for all supported node types—live, historical, and interactive.
Event Details – Reducing Alert Noise with Context, Not Just Data
The Event Details window in NetCrunch transforms alerts into actionable insights. It explains what triggered an alert, how often it happens, how critical it is, what response actions were taken, and what the system recommends next. Its purpose is to reduce alert overload and help you focus on what truly matters.

Purpose
NetCrunch doesn’t just tell you that something went wrong—it shows you why, how often, and what to do about it. The Event Details window is where that happens.
It’s designed to:
- Help users assess whether an alert is actionable
- Prevent alert fatigue by surfacing trends and suppressible noise
- Make the monitoring system self-explanatory, not cryptic
- Enable confident alert tuning and policy refinement
While other systems show a title and a value, NetCrunch shows a timeline, a frequency model, live counter correlation, action results, and AI-powered explanations.
Assessing an Alert with Confidence
Identify Alert Fatigue Sources
The Alert Frequency Chart shows how often this event has occurred in the last 24 hours, 7 days, or 30 days.
You can instantly spot:
- Repeated short spikes → likely too sensitive
- One sustained alert → likely a real issue
- Unstable, flapping patterns → candidate for suppression
This chart turns anecdotal "this alert keeps firing" into measurable, visual evidence.
Use Context to Confirm Severity
The Counter Snapshot graph shows whether the alerting condition was a momentary deviation or part of a long trend.
With threshold and reset lines clearly drawn, you can assess:
- Was this a brief violation?
- Is the counter still elevated?
- Does the condition merit action or tuning?
This visual clarity prevents overreaction and encourages accurate prioritization.
Check for Auto-Resolution or Upstream Closure
The left-side panel always shows:
- How the alert ended (auto-close, closed by event, or manually resolved)
- How long it lasted
- Whether it’s still active
If it was closed by a parent node issue, that relationship is shown too—so you know not to chase symptoms of a higher-level problem.
Understand the Monitoring Basis
Every alert includes its Monitoring Source:
- The sensor or monitoring pack responsible
- The triggering condition (e.g. “CPU Usage > 75%”)
- The actual value when the alert fired
- Whether averaging or sampling logic was used
This links policy to behavior—no more guessing how something was monitored.
See What Was Done (and Whether It Worked)
The Action Log shows:
- All automated responses triggered by the alert
- Notification history (e.g., emails, webhooks)
- Script or command execution results, including logs and output
This provides transparency and confidence. You don’t have to wonder whether a restart script failed or an alert was never sent—you can see it right here.
Let the AI Help Explain It
With the Explain button, NetCrunch gives you a contextual explanation of:
- Why the alert was triggered
- What the monitored value means
- Common root causes
- Suggested next steps
Especially useful for junior staff or occasional operators, this turns raw metrics into understandable action paths.
Inspect the Parameters Behind the Trigger
For threshold-based alerts, the Parameters section shows the full logic:
- Threshold value
- Reset value
- Sampling logic
- Whether averaging was used
- Monitoring interval
- Internal IDs and logic type
This allows anyone to reproduce the logic, debug it, or fine-tune it confidently. It’s built for transparency, not magic.
Comment, Acknowledge, or Escalate
The event window also supports human input:
- Add comments to track decisions, handoffs, or investigations
- Mark alerts as acknowledged or resolved
- Use it as a collaboration thread for incidents
No need to leave the alert context to document your work.
Why This Matters
Most monitoring tools show alerts as fragments. NetCrunch shows alerts as fully contextual events—with history, cause, trend, resolution, and interpretation—all on one screen.
That means:
- Less guessing
- Fewer false positives
- Easier tuning
- Faster reactions
- Better decisions
This is not just a window. It's your first defense against alert fatigue.
NetCrunch Visualization – Focused, Evolving, and Built for Clarity
This topic compares NetCrunch’s visualization capabilities to typical monitoring tools and explains the philosophy behind our design. NetCrunch isn’t trying to mimic enterprise software complexity—it’s built to deliver clarity, reduce noise, and help users focus. While others bloat, we simplify. And we’re just getting started.
Our Approach to Visualization
Visualization in NetCrunch is not a UI layer added for decoration—it’s deeply connected to how monitoring is designed to work: real-time, contextual, and actionable. We believe monitoring should show what’s happening now, help you act quickly, and reduce uncertainty—not bury you in graphs or endless configuration panels.
That’s why our dashboards, maps, event views, and Auto-Screens all follow three principles:
- Clarity over complexity – Information should be obvious at a glance.
- Context over charts – Data means nothing without understanding why it matters.
- Action over aesthetics – Dashboards must drive decisions, not just look good on a screen.
How We Compare (and Why That Matters)
We often get asked: “Why not just use Grafana?” or “How does this differ from XYZ?” Here's how NetCrunch compares to typical monitoring solutions:
Topology Maps
Most tools either don’t offer Layer 2/3 maps or treat them as static diagrams.
NetCrunch:
- Auto-generated topology (Layer 2 & 3)
- Per-switch segment views to avoid clutter
- Live interface traffic, VLANs, errors
- Node isolation warnings and drilldowns
Others:
- Manual mapping or basic link tools
- Overloaded with endpoints, unreadable at scale
- Often missing interface-level insight
Dashboards
Dashboards should show real-time status, not act as scrollable spreadsheets.
NetCrunch:
- Non-scrollable, focused dashboards
- Real-time charts, live alerts, and contextual widgets
- Easy to build from existing views
- Designed for NOC, not reporting
Others:
- Scrollable “reports disguised as dashboards”
- Disconnected from monitoring logic
- Often require scripting or data wrangling
Event Details
Most products give you a line of text. We give you understanding.
NetCrunch:
- Full condition breakdown
- Real-time value chart with thresholds
- Alert frequency over time
- Response action log
- AI explanation
- Parameter transparency
Others:
- Just the alert title and timestamp
- No response tracking or real-time context
- Tuning alerts is trial and error
Auto-Screens
We don’t need plugins, hacks, or browser extensions.
NetCrunch:
- Native NOC rotation scenarios
- Desktop and web console support
- No scrolling views allowed—focus by design
- Multi-screen, multi-scenario support
Others:
- Browser hacks, iframe loops
- Inconsistent fullscreen handling
- No native scheduling or layout discipline
Where We’re Headed
While some tools are becoming more complex—turning into enterprise platforms with rising costs and overwhelming interfaces—we are heading in the opposite direction.
We’re focused on:
- Making dashboards faster to build
- Making graphical views more expressive
- Enhancing context without adding noise
- Delivering visual clarity at scale, not flashy overload
GrafCrunch, our legacy Grafana fork, served its purpose. But we’ve moved beyond it—because NetCrunch’s native visual layer now provides greater value without third-party complexity.
This Is a Commitment, Not a Feature
We believe that clear visualization is operational power. It’s how you see problems before they escalate. How you communicate status to your team. How you trust the system is doing its job.
That’s why visualization in NetCrunch isn’t a bolt-on—it’s a core part of how we think.
And we’re not done.
The best monitoring UI isn’t the one with the most options. It’s the one that helps you act fast, confidently, and without distraction. That’s the future we’re building—one focused screen at a time.
Maintenance
Read about how to keep NetCrunch running smoothly over time, how to upgrade it and keep your network information up to date.
Troubleshooting
Explaining aspects that are not seen but taken care of. Use these tips to optimize your NetCrunch resilience.
Our goal with NetCrunch is to provide a practical, reliable solution that works in real-world environments. We’ve built it to be resilient and self-reliant, designed to help IT professionals manage complex networks without unnecessary hassle or false promises.
NetCrunch is engineered to be trouble-free. It undergoes extensive testing and follows a development process aimed at minimizing defects. However, as industry experts know, even the best practices can only detect 75% to 90% of bugs before release - a reality confirmed by decades of research. Network monitoring software like NetCrunch must also handle countless edge cases caused by the wide variety of vendor devices and technology implementations it interacts with.
Networks are inherently complex, often relying on technologies defined by RFC documents that vendors don’t always fully implement. This is particularly evident with protocols like SNMP and NetFlow. On top of that, operating systems such as some versions of Windows Server sometimes contain unresolved bugs in components like WMI. NetCrunch is built to navigate these challenges, delivering dependable performance for IT teams working in demanding environments.
Releases
To address various issues and bugs in the software, we release NetCrunch minor releases several times a year. These releases can be installed over previous versions, and they usually do not change the data format. Read Update, Migrate and Backup .
Issue Sources
Based on our experience, issues are coming from a limited number of sources. Let us explain where the problems come from and how you can correct them quickly, or help us to fix them for you.
Configuration
Most monitoring issues are caused by invalid configuration. There is no way for NetCrunch to connect to servers with wrong or missing OS credentials or wrong SNMP profiles (communities or passwords).
NetFlow
There is a range of protocols based on NetFlow implemented by various vendors. They usually conform to the NetFlow v5 protocol. Each device has specific settings, and starting from NetFlow v9, data contained in the flows depends on the configuration. First, you need to set up the device to send data to NetCrunch – there is a range of articles about NetFlow configuration on the Internet.
If NetCrunch cannot decode the flow data, you need to capture such data with Wireshark and send it to us. Sometimes the devices have bugs in their NetFlow implementations. Although we can’t fix them, sometimes we can go around and accept invalid data.
SNMP MIBs
More than 10,000 MIBs are circulating on the Internet. As there is no standard for MIB compiler (standard MIBs were defined only in RFC documents), it is somewhat hard to compile them. They were often written once and never checked, or compiled with a specific compiler in a particular environment.
Usually, the source of MIB problems is the wrong syntax or a missing module that some MIBs may depend on. This kind of issue can often be fixed by specifying the module name alias.
If you are not familiar with MIBs and can’t solve these problems, contact our support – we will try to find a solution. We already compiled over 8700 MIBs, so there is a chance we can handle some more...
Windows
Windows is a complex system. It’s built by setting layers on top of another layer. The easiest way to manage Windows configuration is by Active Directory. But we know that in real life, there are many unlinked systems and Windows versions.
Problems with Windows (Windows 7/2008 or later) are always related to Windows settings. See Windows Monitoring Setup. Monitoring of a workgroup Windows 7 workstation is easy with a built-in local Administrator account.
Although we know that it is possible to monitor remote systems with lower than administrative rights, we can't give you the recipe that is universal across all Windows versions. Simply, it sometimes works, and sometimes not - systems that appear to be configured the same way behave differently.
NetCrunch Performance Limits
There are always some limitations to NetCrunch.
- Licensing
- it may not impose limits on the number of nodes being monitored. In our tests, we've got to 25,000 nodes, but the program can choke with a lower number of nodes depending on what you are monitoring in real life.
- Hardware
- such as memory, disk, and network, set the ultimate limit for the software. SSD or disk array is very welcome.
NetCrunch is a multi-threaded system that scales well with many processors, especially because many tasks are dispatched to different processes and threads.
Slow SATA disks are very inefficient in reading large quantities of data. We recommend using SSD drives instead.
Diagnostic Report
NCDiag.exe
NCDiag is the program located in the NetCrunch server folder. It allows browsing various logs and bug reports.
Bug Reports
Bug Reports are not crash dumps.
Mostly, they are well-handled exceptions, but something that was not expected by the program.
It is always beneficial when you let us receive them automatically. The reports contain information about your system, memory, processor, and program execution context.
We do not know your computer address except its Windows machine name. All reports come by email, directly to our secure internal database, and are fully confidential.
You can review those files (if there are any) using the NCDiag program located in the NetCrunch server directory.
Logs
As many NetCrunch components run as background processes, they use text logs to store their activity and potential issues. You can review them using NetCrunch Console ApplicationServerLogs.
NetCrunch Logs:
- Activity Logs
- It contains the list of all actions performed by NetCrunch users.
- Atlas Backup
- It contains the NetCrunch auto-backup process activity log.
- Atlas Import
- It contains the import log.
- Auto Discovery
- Contains activity or issues of the NetCrunch autodiscovery process.
- Monitoring Engine
- Logs of all NetCrunch Monitoring Engine activity
- NetFlow Server
- Log of the Flow Collector service.
- Report Generator
- Log of the process responsible for generating automatic reports.
- Server Services
- Logs of all NetCrunch Server services activity.
- Task Scheduler
- The task scheduler is responsible for running the Report Generator and Auto-Discovery process.
Server Status View
You can find this view in the top Atlas view. It contains essential statuses and reports on hundreds of statistics NetCrunch collects on itself.
The report contains information such as memory used, the number of consumed internal resources, and program queues. The report can be exported to file in XML format or sent directly to AdRem Software from the console. It helps us to determine much loaded NetCrunch puts on your system.
NetCrunch Server Emergency Auto Restart
As NetCrunch is the eyes and ears of an administrator, it should work without interruption. In case of an irrecoverable error (blue screen at a smaller scale), NetCrunch service is automatically restarted to bring it back to a healthy state and avoid data loss. This process is done in seconds, not minutes, so its impact on the monitoring process is minimal.
Backup
NetCrunch automatically creates data backups each day. You can change the settings in the Atlas properties window.
NetCrunch Backup
Settings NetCrunch System Automatic Backup
Sometimes we need to save configuration files without saving collected monitoring data (performance trends and event log data).
Moving Data to Another Machine
You can save the backup file to a selected folder to move it to another machine. This backup will contain all configurations, including program registry settings and monitoring credentials database.
Quick Backup
You can create partial backup that does not contain any monitoring credentials (for example if you want to send it to AdRem for diagnostics). You can also decide to skip events and trends, which are the biggest part of the backup by unticking these option in the backup window.
License Management
License installation options described.
Installing
Help Install Program License
NetCrunch allows the license to be installed online straight from the program UI. When you purchase the product, the license is assigned to your account. If never logged into account.adremsoft.com, then you have to reset your password first.
After selecting the license from the list of available licenses, the license is installed on the NetCrunch Server and automatically activated.
Installing License without an Internet connection
It takes another step before you go to the customer portal. So select Install From License File, and then the window shows the activation code you need to copy and use to generate the file on the portal.

You can download the file and put it on the NetCrunch Server machine, which generated the activation code. This process must be repeated every time license gets updated, for example, when you add more nodes or features or a new maintenance expiration date.
Moving License to Another Machine
Before you decide to move NetCrunch to another machine, you need to deactivate your license. You can do it on NetCrunch Server by running NCLicenseManager located in the program installation folder.
License Manager
The program allows for installation, deactivation, or updating license.

You can deactivate the license online, which requires login to the customer portal from the license manager program. You can also use the numeric deactivation code to deactivate the license on the customer portal.

After the license is deactivated server restarts automatically.
Refreshing the License
(hamburger menu)Help Refresh Program License
You can refresh the license from the console or NCLicenseManager program on the server. You need to refresh the license when its properties change (expiration date, new modules, or additional elements).
If a refreshed license contains new features or modules to be enabled, the NetCrunch Server will restart automatically.
NetCrunch Databases
NetCrunch uses several specialized databases to efficiently manage configuration, event history, real-time status, long-term metrics, and documentation. Each database is optimized for its specific role in the monitoring platform, allowing NetCrunch to scale from hundreds to thousands of nodes while ensuring high performance.
Overview
The architecture separates data by function:
- Atlas holds configuration and topology.
- Event Log captures historical actions and alerts.
- Status DB maintains real-time state.
- Trend DB stores long-term performance metrics.
- DocDB manages auxiliary documentation like notes and inventory.
This separation improves scalability, simplifies backup strategies, and enables faster access to different data types.
NetCrunch Atlas (XML, JSON)
NetCrunch Atlas stores all network objects, their state, monitoring configurations, maps, and dependencies. It is maintained in-memory for performance and periodically saved to disk as multiple XML (and optionally JSON) files.
- Type: In-memory with periodic disk save
- Format: XML (primary), JSON (optional export)
- Scope: Nodes, maps, monitoring packs, policies, groups
NetCrunch Event Log (SQL)
The event log stores all system events and action execution logs. It is stored in a SQL database accessible via an ODBC driver.
- Type: SQL (external, user-managed)
- Access: ODBC-compatible
- Use: Audit trail, historical analysis, compliance
-
Disk Requirements:
- SATA drives support a few GB
- Use SSD or RAID for >5 GB of daily events
NetCrunch Status DB (NoSQL)
The Status DB is an in-memory hierarchical NoSQL database used to track the live state of monitored objects, triggers, and monitors.
- Type: In-memory NoSQL with persistent disk save
- Scope: Triggers, monitor states, external sensor overrides
- Realtime Updates: Supports dynamic changes from external sensors or agents
NetCrunch Performance Trend Database (NoSQL)
This is a specialized append-only NoSQL database optimized for storing and querying large volumes of performance metrics.
- Storage Model: Daily journaling files, compressed and aggregated
- Scale: Capable of handling 250+ million records per day
- Use: Long-term trend analysis (weekly/monthly/yearly)
- Optimized For: High write throughput and efficient time-series access
NetCrunch DocDB (NoSQL)
DocDB is a document-oriented database built on RocksDB. It is used for storing metadata and documentation linked to nodes.
- Engine: RocksDB (embedded)
-
Contents:
- Node notes
- Task assignments
- Device configurations
- Hardware/software/hotfixes inventory history
Summary
Each NetCrunch database serves a distinct role. This architecture allows NetCrunch to balance real-time responsiveness with historical analysis and robust configuration management. It also enables efficient use of resources across environments of different sizes.
Auto Discovery
The primary NetCrunch goal is to keep all your network data up to date. This also includes network nodes and virtual machines.
Discovering Network Nodes
NetCrunch can periodically discover nodes in a given IP network. Go to IP Networks, select IP network view, and open PropertiesMonitoring to schedule a periodic network discovery. The minimum network discovery time is 1 hour.
Discovering Active Directory Containers
NetCrunch creates automatic folders with all known containers. To enable auto-scanning of the AD container, go to the given view and open PropertiesMonitoring and select Add Automatically checkbox. Discovered nodes can be automatically added to the Atlas, or they will be kept in the Task notification window so you can filter them manually.
Virtual Machines (ESXi)
As NetCrunch monitors ESXi virtual machine hosts, it can add newly discovered machines to Network Atlas automatically. The option is disabled by default - you can also add virtual machines from the ESXi VM machine list manually.
Ask Piotrek about the VM autodiscovery option - add a path to manage the option.
Update, Migrate and Backup
Learn how to perform NetCrunch updates, migrate it to other machines, or set up a backup.
Updates
NetCrunch is updated several times per year, the procedure might be slightly different depending on an update type. It is recommended to perform a quick or full backup before upgrading NetCrunch.
Maintenance
Maintenance updates (i.e., 15.0.4) contain mostly bug fixes and small improvements that don’t require configuration data changes. They can be safely performed by installing the new version over the previous one (the installer will automatically uninstall the previous version).
Check your maintenance license expiration date before initiating the upgrade. If you install the NetCrunch version released after your upgrade & support subscription expiration date, it will work only in the trial license mode (14-day trial).
Minor Versions
The minor version (i.e., 14.2 or 15.1) updates contain some new features, requiring some changes to the existing configuration. Thus, we recommend performing a quick configuration backup before starting the update.
You don’t need to save all trend and event data – just save the configuration. See Backup procedure.
Major Version Upgrades
Major versions usually introduce important changes to the data to expand program performance, enhance stability, and accommodate new features.
Upgrading from one version to another is fairly easy. All upgrades are performed in place without copying data.
Before upgrading, ensure that the disk usage is less than 50%.
The installer automatically uninstalls the previous version of the program (keeping all data) and asks you to import it. (Make sure you have the latest version of the old program version installed - when in doubt, please confirm with the support team).
Atlas Backup
Atlas backup is, by default, scheduled to run automatically every day at 1 am. The backup contains Performance Trends data (TrendDB), an Event Log database, and an encrypted password database. The procedure keeps the last 3 backups, but you can increase the number of backups to keep.
To modify the automatic backup schedule, go to Settings NetCrunch System Automatic Backup and select the Modify Atlas backup schedule option at the bottom.
Atlas backups store only network monitoring data. The program configuration, such as NetCrunch server options, is not stored.
You can run a backup on demand by going to (hamburger icon) Maintenance Backup.
Quick Backup
Quick backup can be used before you start making configuration changes so that you can revert to the previous state at any time. It stores only Atlas configuration files such as nodes, alert configuration, maps, etc. It does not store the event log database or performance data.
Backup Folder
Settings NetCrunch System Automatic Backup
Each Atlas backup is stored in a single file in the directory specified in the program options. The default location points to a subfolder of the program data directory.
It's recommended to store backup files on a separate disk or disk partition. For example "E:\NetCrunch\backup".
Restoring the Atlas
(hamburger icon) Maintenance Restore...
You can easily restore previous Atlas versions by choosing a backup date in the Restore window. You can decide to restore only configuration or full data.
Migrate
If you need to migrate NetCrunch to new hardware, export all data to a single file, copy it to another machine, and import it to a freshly installed NetCrunch instance.
Export Data
- To export data to file go to (hamburger button) Maintenance Backup...
- Select the
Backup to separate folder...option. - In the next window, select the folder, where the backup should be saved by clicking on the folder icon in the Backup Filename field.
- Select the
Full Backup for migrating data to another machineoption in the Backup Type drop-down.
Import previously exported data
Upon the first NetCrunch console launch, select the Import Atlas from another machine... option to load the NetCrunch backup created on the previous Windows Server.
Restarting
Read restart recommendations.
We recommend restarting the NetCrunch Server service once a month to improve the system's performance.
We strongly recommend installing Microsoft updates and patches, so your whole system should also be restarted at least once per month.
NetCrunch includes an auto-restart feature that restarts its service on a given day and time. To change auto-restart parameters, go to: Settings NetCrunch System Maintenance. The shortest time between restarts is 1 day, and the longest is 100 days.
Why does restarting help to maintain healthy systems?
There are two main reasons why computers and systems do need to restart.
Fragmentation and resource cleanup
Memory Fragmentation
Even if the operating system uses algorithms that minimize the risk of fragmentation, it often happens. It manifests in an inability to allocate a large block of RAM. For example, the application must read a 10MB file to memory. The system might refuse to allocate the block despite having gigabytes of free memory. In such cases, the whole operating system must be restarted.
Resource Cleanup
The system has thousands of components, some of which leak resources. System resources are not limitless. This might be caused by the crashing process (process cleanup does not always claim 100% of resources) or a faulty DLL.
Restoring the proper state
In this case, programs or systems restart after the crash (i.e., blue screen BOD). The crash means that the program is in a state that does not allow further processing, which can lead to damage or unexpected behavior. In such cases, the code must be reinitialized into the proper state.
When such a problem occurs in any NetCrunch services (processes), they are automatically restarted, and the system continues running almost uninterrupted.
NCCLI NetCrunch Utilities
You can use NCCLI to execute commands served by the NetCrunch Server
The nccli command-line utility is a powerful tool designed for administrators and advanced users to perform various tasks, such as exporting trend and event data from nodes in a network. This utility offers flexibility in specifying time ranges, output formats, and other parameters to ensure that the exported data meets your specific needs. The following documentation outlines the usage, parameters, and examples for effectively using the nccli utility.
Usage
nccli.exe <command> [parameters]
Supported Commands:
- reset-admin-password
- generate-web-certificate
- run-task
run-task -task backup | auto-scan | reports | trend-compress - export-trend
- export-events
export-trend
Usage
nccli.exe export-trend -node node -counter counter -from fromDate [-to toDate] [-file fileName] [-date-format format]
Parameters:
- node: Node name, address, or ID.
- counter: Counter path, e.g.:
Processor(_Total)\% Processor Time. - from: Starting date.
- to: End date. If the parameter is not specified, the program will only export data for a single day.
- hour-from: Starting hour (0-23). Default: 0.
- hour-to: Ending hour (0-23). Default: 23.
- file: Output file name (full path). Default
<Atlas data folder>\TrendExport. - local-date: Save trend time using local date.
-
date-format: Date output format. Available options are:
- iso:
2024-06-03T08:17:48.291Z - local:
6/3/2024 10:17:48 AM - sql (default):
2024-06-03 10:17:48
- iso:
export-events
Usage
nccli.exe export-events -node node -from fromDate [-to toDate] [-file fileName] [-output dataFormat] [-local-time] [-date-format format]
Parameters:
- node: Node name, address, or ID.
- from: Starting date.
- to: End date. If the parameter is not specified, the program will only export data for a single day.
- hour-from: Starting hour (0-23). Default: 0.
- hour-to: Ending hour (0-23). Default: 23.
- file: Output file name (full path). Default
<Atlas data folder>\EventExport. -
output: Output data format. Available options:
- CSV (default)
- JSONL: Event parameters will be included only in JSONL format.
- local-date: Save event raise time using local date.
-
date-format: Date output format. Available options are:
- iso:
2024-06-03T08:17:48.291Z - local:
6/3/2024 10:17:48 AM - sql (default):
2024-06-03 10:17:48
- iso:
Examples
Export Trends
nccli.exe export-trend -node Node01 -counter "Processor(_Total)\% Processor Time" -from 2024-06-01 -to 2024-06-02 -file C:\Export\TrendData.csv -local-date -date-format iso
Export Events
nccli.exe export-events -node Node01 -from 2024-06-01 -to 2024-06-02 -file C:\Export\EventData.csv -output CSV -local-date -date-format iso
Advanced & experimental features
Keep in mind that topics covered in this section are experimental workarounds
Monitoring status of a node without using network services
This option enables status calculation based on sensors - not network services. This may be especially useful if nodes aren't reachable by normal means (e.g., they are behind nat), and the only way of monitoring is to use sensors.
Enabling sensors-as-status
- Add node where sensors should be used as a status
- If there any network services present on the node - remove all of them via the node settings - monitoring tab.
- Switch tab to 'properties' in the node settings and save node ID - it's located next to 'Identification,' e.g., #1234
- Stop NetCrunch server service
- Go to the NetCrunch data directory - by default
C:\ProgramData\AdRem\NetCrunch\data\<id of the atlas>where the id of the atlas is represented by a digit (usually it's 2 if there was more than one atlas created in the NetCrunch - this number may differ. - Create a new text file inside the data folder -
ipnodeOptions.json - Inside the file, add text like:
[{"id":1234,"noServices":true}] - Save the file and start the server
- Open node settings and add sensors that should be monitored; the important part is to disable event suppression (bell icon in the top right corner of the sensor settings window) on the sensors that were added to the node.
API & Integrations
Getting Started
Learn how to create a NetCrunch API key and use it with both REST API and MCP Server access channels.
NetCrunch exposes its management API through two access channels:
- REST API
- MCP Server
Both channels use the same API key mechanism and the same user-based access control model.
The REST API allows external applications, scripts, and automation tools to get information from NetCrunch and manage selected objects.
NetCrunch also exposes its REST API as an MCP (Model Context Protocol) server, allowing AI assistants and LLM-based tools to discover and call the NetCrunch management API programmatically.
You can use the API to:
- retrieve node, view, policy, and credential information
- add, remove, or modify nodes
- manage Atlas views and folders
- manage monitoring packs and policies
- automate selected configuration tasks
- integrate NetCrunch with external tools and workflows
- allow AI assistants to interact with NetCrunch through MCP
To see all available operations with examples, go to Nodes, Atlas Views and Policies, and related API reference chapters.
The API key inherits the access rights of the selected NetCrunch user. This applies to both REST API requests and MCP Server calls. The API cannot access more nodes, views, policies, or configuration objects than that user can access.
api-access-channels
API Access Channels
NetCrunch provides two ways to access the same management API.
- REST API
- Direct HTTP-based API access for scripts, integrations, custom applications, and automation tools.
- MCP Server
- Model Context Protocol access that exposes the NetCrunch REST API to AI assistants and LLM-based tools.
Both channels use:
- the same API key
- the same user account binding
- the same access rights
- the same read-only restrictions
- the same connection restrictions
- the same rate limiting rules
This means that creating an API key for REST API also makes it usable by MCP, as long as the key, user permissions, and connection restrictions allow the request.
MCP does not bypass NetCrunch permissions. It is another access channel to the same management API, not a separate security model.
REST API
The REST API is the standard integration interface for NetCrunch.
Use REST API when you want to:
- call NetCrunch from scripts
- integrate NetCrunch with external systems
- automate node, view, and policy management
- retrieve monitoring data in JSON format
- build custom tools around NetCrunch data
Base request format:
https://<NetCrunch Server IP>/api/rest/2/<scope>
Authentication can be provided by URL parameter:
https://<NetCrunch Server IP>/api/rest/2/<scope>?api_key=<user API key>
or by HTTP header:
x-api-key: <user API key>
Passing an API key in the URL is convenient for testing, but it can expose the key in browser history, proxy logs, server logs, or monitoring tools. For production integrations, use the x-api-key header.
MCP Server
NetCrunch exposes its REST API as an MCP (Model Context Protocol) server.
MCP allows AI assistants and LLM-based tools to:
- discover available NetCrunch API operations
- understand available parameters
- call NetCrunch management functions programmatically
- retrieve NetCrunch data through a controlled API layer
- perform authorized automation tasks
The MCP Server is useful when NetCrunch is connected to AI-based tools that can reason about monitoring configuration, node state, alerts, policies, or inventory data.
Typical MCP use cases include:
- asking an AI assistant to inspect node information
- retrieving Atlas view or policy data
- finding monitoring configuration issues
- preparing API-based automation steps
- generating scripts based on discovered NetCrunch API capabilities
- assisting operators with NetCrunch management tasks
MCP uses the same API key process as REST API. You do not create a separate MCP key.
MCP access should be treated with the same security discipline as REST API access. If the linked user can modify NetCrunch objects and the key is not read-only, an MCP client using that key can also perform write operations exposed by the API.
generate-api-key
Generate API Key
Before the NetCrunch API can be used through REST API or MCP Server, you need to generate an API key.
To create a new API key:
- Go to Settings NetCrunch System Users & Access Rights Manager
- Select API Keys in the left panel
- Add a new application
- Enter the application name
- Select the NetCrunch user account that the key should be tied to
- Select the expiration time of the API key
- Untick Read-Only if the script, application, or MCP client will modify NetCrunch objects
- Optionally, set connection restrictions
The selected user controls API permissions. If the user cannot access a view, node, policy, or credential in NetCrunch, the API key tied to that user cannot access it either.
This applies equally to:
- direct REST API calls
- MCP Server calls
- AI assistants connected through MCP
- automation tools using REST API
Use a dedicated NetCrunch user account for automation when possible. This makes API access easier to audit and prevents accidental dependency on a personal administrator account.
API Key Fields
- Application Name
- Name of the application, integration, script, or MCP client using the API key. This name appears in the NetCrunch event log when the API key is used.
- Username
- NetCrunch user account linked to the API key. This controls what objects the API can access. Every object accessible by the selected user can be accessed through the API key.
- API Key
- Secret value used to authenticate API requests. The same key is used for REST API and MCP Server access.
- Valid Until
- Expiration time of the API key. After this time, requests using the key will be rejected.
- Read-Only
- Restricts the API key to operations that do not modify NetCrunch objects. Keep this enabled for reporting, inventory, synchronization, AI-assisted inspection, and read-only integrations.
- Connection Restriction
- Restricts where the API key can be used from.
Available connection restriction options:
- No restriction
- NetCrunch Server Machine
- By IP Address
- No restriction
- The API key can be used from any source that can connect to the NetCrunch REST API or MCP Server endpoint.
- NetCrunch Server Machine
- The API key can be used only from the local NetCrunch Server machine.
- By IP Address
- The API key can be used only from selected IP addresses or address ranges. You can specify a network address, dash-separated IP range, or individual IP addresses separated by commas.
Example values:
192.168.1.10
192.168.1.10-192.168.1.50
192.168.1.10,192.168.1.20,192.168.1.30
192.168.1.0/24
Security Recommendations
Treat API keys as passwords.
Recommended practices:
- use HTTPS instead of HTTP
- prefer the x-api-key header over URL parameters for REST API
- avoid storing API keys directly in scripts or MCP client configuration files when possible
- use environment variables or secure secret storage
- create separate API keys for separate applications or MCP clients
- use read-only keys unless write access is required
- set expiration dates
- restrict API keys by source IP when possible
- remove unused keys
- review the NetCrunch event log for API usage
- use dedicated low-privilege users for AI and automation access
For MCP integrations, avoid using full administrator accounts unless the assistant or client must perform administrative operations. A read-only or limited-access user is safer for inspection, reporting, and diagnostic workflows.
rate-limiting
Rate Limiting
NetCrunch applies rate limiting to API requests.
By default, the limit is:
100 requests per 60 seconds
This limit applies to both:
- REST API requests
- MCP Server calls
The limit is shared because MCP exposes the same NetCrunch management API and can generate API calls programmatically. AI assistants and LLM-based tools may call several operations while resolving a single user request, so rate limiting protects the NetCrunch Server from accidental request bursts, inefficient automation loops, and excessive load.
Rate limiting helps protect:
- NetCrunch Server responsiveness
- monitoring performance
- event and configuration database access
- API availability for other integrations
- system stability when external tools behave unexpectedly
When the rate limit is exceeded, the client should slow down and retry later.
The limit can be changed in the NetCrunch server configuration file:
server.cfg.yml
However, changing the default value is not recommended.
Raising the limit may increase server load, especially if multiple integrations, scripts, or MCP clients are active at the same time. Lowering the limit may break existing automation or cause MCP clients to fail during multi-step operations.
If an integration reaches the rate limit, review the integration logic first. Prefer batching, caching, filtering, and fewer repeated requests instead of increasing the server limit.
Using the API
NetCrunch REST API consists of four main scopes that allow you to access and manipulate different areas of NetCrunch configuration and data.
Available scopes:
- Nodes
- Atlas Views
- Monitoring Packs and Policies
- Credentials
Data returned by NetCrunch is in JSON format.
Every REST API request must specify:
- NetCrunch Server address
- API version
- scope
- target object or operation
- API key
Base request format:
https://<NetCrunch Server IP>/api/rest/2/<scope>
Authentication using URL parameter:
https://<NetCrunch Server IP>/api/rest/2/<scope>?api_key=<user API key>
Authentication using HTTP header:
x-api-key: <user API key>
MCP clients use the same API key, but the key is provided through the MCP client configuration instead of being manually placed in every REST URL.
API Scopes
- Nodes
- Used to retrieve and manage NetCrunch nodes. This includes node properties, network addresses, device types, monitoring settings, custom fields, services, monitoring engines, and status information.
- Atlas Views
- Used to retrieve and manage Atlas views, folders, and their hierarchy.
- Monitoring Packs and Policies
- Used to retrieve and manage monitoring packs and policies. These define reusable monitoring, alerting, and reporting settings.
- Credentials
- Used to manage credential-related configuration available through the API.
Object Identifiers
Most scopes can reference objects by one of the supported identifiers, depending on the endpoint.
Common identifiers include:
- name
- IP address
- object ID
Node, view, or monitoring pack ID can be found in object settings. To copy the ID, click on it.


Using IDs is recommended for automation because names and addresses can change.
Request Format
A typical REST API request contains:
- HTTP method
- API endpoint
- API key
- optional request body
Common HTTP methods:
- GET
- Retrieves data.
- POST
- Creates a new object or executes an action.
- PUT
- Updates an existing object.
- DELETE
- Removes an object.
Use the method required by the specific API endpoint. Do not assume that every scope supports every HTTP method.
Response Format
NetCrunch returns data in JSON format.
A successful response usually contains the requested object, list, or operation result.
An error response may indicate:
- invalid API key
- expired API key
- insufficient user rights
- object not found
- invalid scope
- invalid request body
- connection restricted by API key settings
- read-only key used for a write operation
- rate limit exceeded
Example
Get All Node Properties
This example retrieves all properties of a node identified by its IP address.
cURL
curl --request GET --url "http://<netcrunch>/api/rest/2/nodes/192.168.0.25?api_key=fb91cd1f6479db477276761a93e878d0b65e2039"
The same request using the x-api-key header:
curl --request GET \
  --url "https://<netcrunch>/api/rest/2/nodes/192.168.0.25" \
  --header "x-api-key: fb91cd1f6479db477276761a93e878d0b65e2039"
Result
{
  "id": 1001,
  "name": "ncsrv.ac.acme",
  "dnsName": "ncsrv.ac.acme",
  "networkAddress": "10.20.16.94",
  "networkPrefixLength": 21,
  "snmpComputerName": "",
  "snmpOsDescription": "",
  "snmpSysObjId": "",
  "snmpLocation": "",
  "snmpAvailable": false,
  "snmpManaged": false,
  "snmpProfile": "",
  "snmpPort": 161,
  "snmpTimeout": 5000,
  "snmpRetryCount": 3,
  "displayName": "",
  "organization": "<Root>",
  "networkServices": [
    {
      "name": "PING",
      "status": "OK"
    },
    {
      "name": "HTTP",
      "status": "OK"
    },
    {
      "name": "CIFS/SMB",
      "isLeading": true,
      "status": "OK"
    }
  ],
  "monitoringTime": 1,
  "netBiosName": "",
  "identification": "ipAddress",
  "deviceType": {
    "class": "Server/Workstation",
    "os": "Windows Server",
    "version": "Windows 2016 Server",
    "manufacturer": "VMware"
  },
  "simplifiedMonitoring": false,
  "status": "OK",
  "avgResponseTime": 1,
  "maxResponseTime": 1,
  "alerts24h": {
    "count": 1,
    "critical": 0,
    "warning": 0,
    "unacknowledged": 0
  },
  "lastAlert": {
    "id": 187,
    "info": "PhysicalDisk(_Total)\% Disk Time 32.19 is back below reset value 60",
    "serverity": "Warning",
    "time": "2018-12-04T10:52:42.000Z"
  },
  "macAddress": "005056AB9815",
  "enabled": true,
  "disabledFrom": null,
  "disabledUntil": null,
  "addTime": "2018-12-03T13:58:46.841Z",
  "lastStatusChange": "2018-12-04T10:56:52.944Z",
  "issueCount": 0,
  "virtualization": {
    "type": "VMware",
    "hostNodeId": 1061,
    "hostName": "esxi05.ac.acme",
    "dataCenter": "ha-datacenter"
  },
  "monitoringEngines": [
    {
      "name": "win",
      "enabled": true,
      "status": "OK"
    },
    {
      "name": "ntsvc",
      "enabled": true,
      "status": "unknown"
    },
    {
      "name": "ntlog",
      "enabled": true,
      "status": "OK"
    },
    {
      "name": "inv",
      "enabled": true,
      "status": "OK"
    },
    {
      "name": "sensors",
      "enabled": true,
      "status": "OK"
    }
  ],
  "pendingAlertsCount": 1,
  "customFields": {
    "Virtual Machine ID": "ncsrv.ac.acme"
  },
  "interfacesMonitoringEnabled": false,
  "organizationalUnit": "For Running NC Machine",
  "snmpTrapCodePage": 4294967295,
  "sysLogCodePage": 4294967295,
  "lastNote": null,
  "nodeType": "IP Node",
  "osMonitorType": "windows",
  "hypervisorKind": "none",
  "probeType": "",
  "addressSpace": ""
}
Reading the Result
The returned node object contains several groups of information.
Basic identity fields:
- id
- name
- dnsName
- networkAddress
- displayName
- organization
- nodeType
Monitoring state fields:
- status
- enabled
- simplifiedMonitoring
- monitoringTime
- lastStatusChange
- issueCount
Service status fields:
- networkServices
- isLeading
- avgResponseTime
- maxResponseTime
Device identification fields:
- identification
- deviceType
- macAddress
- organizationalUnit
SNMP fields:
- snmpAvailable
- snmpManaged
- snmpProfile
- snmpPort
- snmpTimeout
- snmpRetryCount
- snmpLocation
- snmpSysObjId
Alert summary fields:
- alerts24h
- lastAlert
- pendingAlertsCount
Monitoring engine fields:
- monitoringEngines
Virtualization fields:
- virtualization
Custom data fields:
- customFields
Auditing API Usage
When an API key is used to execute a request, NetCrunch logs the following information to the NetCrunch event log:
- application name provided in API key configuration
- username linked to the API key
- source IP address of the request
This applies to both REST API and MCP Server access.

This makes it possible to audit API usage and identify which integration, script, or MCP client accessed NetCrunch.
Troubleshooting
API Key Does Not Work
Check the following:
- the API key was copied correctly
- the key has not expired
- the key is tied to an active NetCrunch user
- the selected user has access to the requested object
- the key is not restricted to a different source IP address
- the request is sent to the correct NetCrunch Server
- the correct API version is used in the URL
- the MCP client is configured with the same API key if using MCP
Write Operation Fails
Check whether the API key is configured as Read-Only.
If the key is read-only, it can retrieve data but cannot add, modify, or remove NetCrunch objects. This applies to both REST API and MCP Server calls.
Object Cannot Be Found
Check whether the object identifier is correct.
For automation, prefer object IDs instead of names or IP addresses. Names can be duplicated or changed. IP addresses can change when devices are moved, reconfigured, or monitored through a different address space.
Access Is Denied
The API key inherits the access rights of the selected NetCrunch user.
Check whether the user can access the same object in the NetCrunch Console.
Request Works Locally but Not Remotely
Check connection restrictions in the API key configuration.
The key may be limited to:
- NetCrunch Server Machine
- selected IP address
- selected IP range
- selected network
Too Many Requests
The API client may be exceeding the default rate limit.
Default limit:
100 requests per 60 seconds
This can happen with:
- polling scripts
- synchronization jobs
- poorly optimized integrations
- MCP clients performing multiple API calls for a single task
- automation loops
Review the integration first. Avoid increasing the limit unless there is a clear operational reason.
Best Practices
- Use read-only keys for reporting
- If the integration only retrieves data, keep Read-Only enabled.
- Use separate keys per integration
- Do not reuse one API key for many unrelated scripts, systems, or MCP clients.
- Use clear application names
- The application name appears in the event log, so use names that identify the integration clearly.
- Restrict source addresses
- Limit each API key to the server or network that actually runs the integration.
- Set expiration dates
- Permanent keys are harder to control. Use expiration dates and renew keys intentionally.
- Prefer IDs in scripts
- Object names and IP addresses may change. IDs are more stable for automation.
- Prefer HTTPS
- Use HTTPS for API calls, especially when the API key is transmitted over the network.
- Prefer headers for REST authentication
- Use x-api-key instead of putting the key in the URL.
- Limit MCP permissions
- Use read-only or limited users for AI assistants unless write access is explicitly required.
- Avoid unnecessary polling
- Cache results, filter requests, and avoid repeated calls for unchanged data.
- Respect rate limits
- The default limit protects the NetCrunch Server and should not be changed unless necessary.
- Review event logs
- Regularly check API usage in the NetCrunch event log.
Related Topics
See also:
Nodes
Nodes API gives many possibilities to access, modify, add, and remove node data from NetCrunch. It can be used to manage NetCrunch through scripts and external applications.
add-node
Add Node
Add node to the Atlas and enable monitoring, "name" or "networkAddress" are mandatory, the rest of the properties are optional.
POST /api/rest/2/nodes
cURL
curl --request POST --url "https://<netcrunch>/api/rest/2/nodes?api_key=<api key>" --header "Content-Type: application/json" --data "\"name\": \"<node name or address to add>\"}"
curl --request POST --url "http://<netcrunch>/api/rest/2/nodes?api_key=<api-key>&name=<node name or address to add>"
Node.js
const
    http = require('http'),
    options = {
        method: 'POST',
        hostname: 'localhost',
        path: '/api/rest/2/nodes',
        headers: {
            'Content-Type': 'application/json',
            "x-api-key": 'fb91cd1f6479db477276761a93e878d0b65e2039'
        }
    },
    nodeData = {
        "name": "NewNode.ac.acme"

    };
    const req = http.request(options, (res) => {
    res.setEncoding('utf8');
    res.on('error', (error) => { console.log(error) });
    res.on('data', (chunk) => { console.log(chunk) })
});
req.write(JSON.stringify(nodeData));
req.end();
PowerShell
$url = "http://localhost/api/rest/2/nodes"
$viewData = @{
    name='NewNode.ac.acme'
}
$body = (ConvertTo-Json $viewData)
$hdrs = @{}
$hdrs.Add("X-API-KEY","fb91cd1f6479db477276761a93e878d0b65e2039")
$hdrs.Add("Content-Type","application/json")
Invoke-RestMethod -Uri $url -Method Post -Body $body -Headers $hdrs
Python
import requests
url = 'http://localhost/api/rest/2/nodes'
data = {
  "name": "NewNode.ac.acme"
}
headers = {
    'Content-Type': 'application/json',
    'x-api-key': 'fb91cd1f6479db477276761a93e878d0b65e2039'
}
requests.post(url=url, data=data, headers=headers)
| Field Name | Description |
|---|---|
| name | DNS name |
| networkAddress | IP Address |
| networkPrefixLength | Network mask prefix length |
| displayName | Display name for node |
| organization | Name of organization. It must be added to NetCrunch prior to using it in API |
| snmpManaged | true/false - enable SNMP monitoring on the node |
| snmpProfile | Name of SNMP profile |
| snmpPort | SNMP Port |
| snmpTimeout | SNMP monitoring timeout in miliseconds |
| snmpRetryCount | Retry count for SNMP monitoring |
| networkServices | List of network services to monitor |
| monitoringTime | monitoring time represented in minutes |
| dependsOnNode | ID/name/address of node this node depends on |
| identification | node identification for monitoring. Values: 'default', 'ipAddress', 'dnsName', 'macAddress' |
| deviceType | object representing type of device |
| parentNode | ID/name/address of parent node |
| enabled | enable/disable monitoring of this node (true/false) |
| simplifiedMonitoring | Set simplified monitoring to true/false |
| disabledFrom | Set to disable monitoring (this is in UTC time) |
| disabledUntil | Set to disable monitoring (this is in UTC time) |
| customFields | object representing list of custom field values |
| interfacesMonitoringEnabled | enable/disable monitoring of interfaces on this node |
| snmpTrapPage | snmp trap code page |
| sysLogPage | syslog code page |
| organization | name of organization for this node |
| osMonitorType | Name of OS monitor to use. Values: 'auto', 'none', 'windows', 'macOS', 'linux', 'bsd', 'esx', 'solaris' |
| monitoringProvider | Name of the monitoring probe (If parameter is not used or monitoring probe does not exist - NetCrunch Server is a default option |
Example
{
  "name": "admin.ad.acme",
  "networkAddress": "192.168.0.25",
  "networkPrefixLength": 24,
  "displayName": "My New Node",
  "organization": "My organization",
  "identification": "ipAddress",
  "deviceType": {
    "class": "Switch",
    "manufacturer": "3Com",
    "model": "LinkSwitch 2200"
  },
  "dependsOnNode": "10.10.10.2",
  "snmpManaged": true,
  "snmpProfile": "Default (read-write)",
  "snmpPort": 161,
  "snmpTimeout": 5000,
  "snmpRetryCount": 3,
  "interfacesMonitoringEnabled": true,
  "osMonitorType": "linux",
  "networkServices": [
    {
      "name": "SSH",
      "timeout": 5000,
      "repeat": 3,
      "additionalRepeat": 0,
      "monitoringTime": 5
    },
    {
      "name": "CIFS/SMB",
      "isLeading": true
    }
  ],
  "simplifiedMonitoring": false,
  "enabled": true
}
Status Codes
| Status Code | Description |
|---|---|
| 200 | OK |
| 401 | Access denied |
Result
The result contains the id of the added node.
{ "id": 1001 }
get-node-properties
Get Node Properties
Get properties of the node based on the filter.
List of all available properties
GET/api/rest/2/nodes/<node>?properties=<filter>
cURL
curl --request GET --url "http://<netcrunch>/api/rest/2/nodes/192.168.0.25?api_key=fb91cd1f6479db477276761a93e878d0b65e2039&properties=name,status"
Node.js
const
    http = require('http');
    http.get('http://localhost/api/rest/2/nodes/192.168.0.25?api_key=0406adfb5e41f58092a38483f61f702602d8a4b6&properties=name,status', (res) => {
    res.setEncoding('utf8');
    res.on('error', (error) => { console.log(error) });
    res.on('data', (chunk) => { console.log(chunk) })
});
PowerShell
Invoke-RestMethod -Uri "http://localhost/api/rest/2/nodes/192.168.0.25?api_key=0406adfb5e41f58092a38483f61f702602d8a4b6&properties=name,status"
Python
import requests
requests.get('http://localhost/api/rest/2/nodes/192.168.0.25?api_key=0406adfb5e41f58092a38483f61f702602d8a4b6&properties=name,status')
Parameters
| Name | Description |
|---|---|
| node identifier | Node ID, DNS name or IP Address |
| filter | List of properties. Returns all properties if omitted, a value is "all" or "*" |
Status Codes
| Status Code | Description |
|---|---|
| 200 | OK |
| 412 | Missing or invalid parameter |
| 401 | Access denied |
| 404 | Node not found |
Example Result
{
"id": 1001,
"name": "admin.ad.acme",
"dnsName": "admin.ad.acme",
"networkAddress": "192.168.0.25",
"networkPrefixLength": 24,
"snmpComputerName": "admin.ad.acme",
"snmpOsDescription": "Hardware: Intel64 Family 6 Model 26 Stepping 5 AT/AT COMPATIBLE - Software: Windows Version 6.3 (Build 16299 Multiprocessor Free)",
"snmpSysObjId": "1.3.6.1.4.1.311.1.1.3.1.1",
"snmpLocation": "Development",
"snmpAvailable": true,
"snmpManaged": true,
"snmpProfile": "Default (read-write)",
"snmpPort": 161,
"snmpTimeout": 5000,
"snmpRetryCount": 3,
"displayName": "My Node",
"monitoringTime": "5",
"networkServices": [
  { "name": "SSH", "status": "Not Responding", "errorMessage": "Can't open connection" },
  { "name": "CIFS/SMB", "isLeading": true, "status": "OK" }
],
"dependsOnNode": {
  "nodeId": 1003,
  "name": "test.ad.acme",
  "networkAddress":"10.10.3.72",
  "dnsName":"test.ad.acme"
},
"netBiosName": "ADMIN",
"identification": "default",
"deviceType":{
  "class":"Server/Workstation",
  "os":"Windows Server",
  "version":"Windows 2012 R2 Server"
},
"parentNode": {
  "nodeId": 1003,
  "name": "test.ad.acme",
  "networkAddress":"10.10.3.72",
  "dnsName":"test.ad.acme"
},
"simplifiedMonitoring": false,
"status": "OK",
"avgResponseTime":10,
"maxResponseTime":100,
"alerts24h":{
  "count":5,
  "critical":2,
  "warning":3,
  "unacknowledged":1
},
"lastAlert":{
  "id":585266,
  "info":"Node Down",
  "serverity":"Critical",
  "time":"2018-10-09T06:15:15.000Z"
},
"macAddress":"D89EF32B5ADD",
"enabled":true,
"disabledFrom":"2018-03-08T13:27:34.876Z",
"disabledUntil":"2018-03-09T13:27:34.876Z",
"addTime":"2018-02-08T13:27:34.876Z",
"lastStatusChange":"2018-10-09T10:08:58.885Z",
"issueCount": 2,
"connectedToSwitch":{
  "nodeId":1078,
  "interface":"Port-channel2",
  "port":464,
  "vlanId":999
},
"virtualization": {
  "type": "Hyper-V",
  "hostNodeId": 1023,
  "hostName": "virt-host.ad.acme",
  "dataCenter": "Master Data Center"
},
 "monitoringEngines":[
   {"id":"win", "name": "Windows", "enabled":true, "status":"OK", credentials: 'MyPassword', monitoringTime: 4},
   {"is":"ntsvc", "name": "Windows Services", "enabled":true, "status":"unknown"},
   {"id":"ntlog", "name": "Windows Event Log", "enabled":true, "status":"OK"}
 ],
"children":[1506,1507],
"pendingAlertsCount":0,
"customFields":{
  "Info 1":"Wacław",
  "Info 2":"Misiek",
  "Pick":"3",
  "Date Field":"1990-10-04T23:00:00.000Z"
},
"interfacesMonitoringEnabled": true,
"organizationalUnit": "Testing",
"snmpTrapCodePage":4294967295,
"sysLogCodePage":4294967295,
"lastNote":null,
"templateNode": {
  "nodeId": 1234,
  "name": "template",
  "networkAddress":"",
  "dnsName":""
},
"addressSpace":"",
"sensors":[{
 "UId":"Pending Reboot#1546607522658",
 "Status":"Unknown",
 "Changed":"2019-01-04T08:37:08.057Z",
 "Object":"MyObject",
 "Instance":"MyObject",
 "Name":"My Sensor",
 "Alerts":0,
 "CfgGroup":"sensors",
 "Message":"",
 "Enabled":true,
 "MonitoringTime":1,
 "Credentials":"<Use from Windows monitor>"
}]
}{
"id": 1001,
"name": "admin.ad.acme",
"dnsName": "admin.ad.acme",
"networkAddress": "192.168.0.25",
"networkPrefixLength": 24,
"snmpComputerName": "admin.ad.acme",
"snmpOsDescription": "Hardware: Intel64 Family 6 Model 26 Stepping 5 AT/AT COMPATIBLE - Software: Windows Version 6.3 (Build 16299 Multiprocessor Free)",
"snmpSysObjId": "1.3.6.1.4.1.311.1.1.3.1.1",
"snmpLocation": "Development",
"snmpAvailable": true,
"snmpManaged": true,
"snmpProfile": "Default (read-write)",
"snmpPort": 161,
"snmpTimeout": 5000,
"snmpRetryCount": 3,
"displayName": "My Node",
"monitoringTime": "5",
"networkServices": [
  { "name": "SSH", "status": "Not Responding", "errorMessage": "Can't open connection" },
  { "name": "CIFS/SMB", "isLeading": true, "status": "OK" }
],
"dependsOnNode": {
  "nodeId": 1003,
  "name": "test.ad.acme",
  "networkAddress":"10.10.3.72",
  "dnsName":"test.ad.acme"
},
"netBiosName": "ADMIN",
"identification": "default",
"deviceType":{
  "class":"Server/Workstation",
  "os":"Windows Server",
  "version":"Windows 2012 R2 Server"
},
"parentNode": {
  "nodeId": 1003,
  "name": "test.ad.acme",
  "networkAddress":"10.10.3.72",
  "dnsName":"test.ad.acme"
},
"simplifiedMonitoring": false,
"status": "OK",
"avgResponseTime":10,
"maxResponseTime":100,
"alerts24h":{
  "count":5,
  "critical":2,
  "warning":3,
  "unacknowledged":1
},
"lastAlert":{
  "id":585266,
  "info":"Node Down",
  "serverity":"Critical",
  "time":"2018-10-09T06:15:15.000Z"
},
"macAddress":"D89EF32B5ADD",
"enabled":true,
"disabledFrom":"2018-03-08T13:27:34.876Z",
"disabledUntil":"2018-03-09T13:27:34.876Z",
"addTime":"2018-02-08T13:27:34.876Z",
"lastStatusChange":"2018-10-09T10:08:58.885Z",
"issueCount": 2,
"connectedToSwitch":{
  "nodeId":1078,
  "interface":"Port-channel2",
  "port":464,
  "vlanId":999
},
"virtualization": {
  "type": "Hyper-V",
  "hostNodeId": 1023,
  "hostName": "virt-host.ad.acme",
  "dataCenter": "Master Data Center"
},
 "monitoringEngines":[
   {"id":"win", "name": "Windows", "enabled":true, "status":"OK", credentials: 'MyPassword', monitoringTime: 4},
   {"id":"ntsvc", "name": "Windows Services", "enabled":true, "status":"unknown"},
   {"id":"ntlog", "name": "Windows Event Log", "enabled":true, "status":"OK"}
 ],
"children":[1506,1507],
"pendingAlertsCount":0,
"customFields":{
  "Info 1":"Hello",
  "Info 2":"Test",
  "Pick":"3",
  "Date Field":"1990-10-04T23:00:00.000Z"
},
"interfacesMonitoringEnabled": true,
"organizationalUnit": "Testing",
"snmpTrapCodePage":4294967295,
"sysLogCodePage":4294967295,
"lastNote":null,
"templateNode": {
  "nodeId": 1234,
  "name": "template",
  "networkAddress":"",
  "dnsName":""
},
"addressSpace":"",
"sensors":[{
 "UId":"Pending Reboot#1546607522658",
 "Status":"Unknown",
 "Changed":"2019-01-04T08:37:08.057Z",
 "Object":"MyObject",
 "Instance":"MyObject",
 "Name":"My Sensor",
 "Alerts":0,
 "CfgGroup":"sensors",
 "Message":"",
 "Enabled":true,
 "MonitoringTime":1,
 "Credentials":"<Use from Windows monitor>"
}],
"tags": "A,B,C"
}
get-node-property
Get Node Property
Get a single property value.
GET/api/rest/2/nodes/<node identifier>/<property>
List of all available properties
cURL
curl --request GET --url "http://<netcrunch>/api/rest/2/nodes/1001/name?api_key=<api key>"
Node.js
const
    http = require('http');
    http.get('http://localhost/api/rest/2/nodes/1001/name?api_key=0406adfb5e41f58092a38483f61f702602d8a4b6', (res) => {
    res.setEncoding('utf8');
    res.on('error', (error) => { console.log(error) });
    res.on('data', (chunk) => { console.log(chunk) })
});
PowerShell
Invoke-RestMethod -Uri "http://localhost/api/rest/2/nodes/1001/name?api_key=0406adfb5e41f58092a38483f61f702602d8a4b6"
Python
import requests
requests.get('http://localhost/api/rest/2/nodes/1001/name?api_key=0406adfb5e41f58092a38483f61f702602d8a4b6')
Parameters
| Name | Description |
|---|---|
| node identifier | Node ID, DNS name or IP Address |
| property | Name of node property to get. The property name can contain a dot to query for sub-property. For example: lastAlert.id or customFields.Info 1 |
Status Codes
| Status Code | Description |
|---|---|
| 200 | OK |
| 401 | Access denied |
| 404 | Node not found |
Result
The result contains property and value.
{
"name": "email.ac.acme",
}
get-list-of-maps-of-the-node
Get List of Views of the Node
Get a list of views of the node. The result is returned as an array of JSON objects.
GET/api/rest/2/nodes/<node identifier>/views
cURL
curl --request GET --url "http://<netcrunch>/api/rest/2/nodes/1001/views?api_key=<api key>"
Node.js
const
    http = require('http');
    http.get('http://localhost/api/rest/2/nodes/1001/views?api_key=0406adfb5e41f58092a38483f61f702602d8a4b6', (res) => {
    res.setEncoding('utf8');
    res.on('error', (error) => { console.log(error) });
    res.on('data', (chunk) => { console.log(chunk) })
});
PowerShell
Invoke-RestMethod -Uri "http://localhost/api/rest/2/nodes/1001/views?api_key=0406adfb5e41f58092a38483f61f702602d8a4b6"
Python
import requests
requests.get('http://localhost/api/rest/2/nodes/1001/maps?api_key=0406adfb5e41f58092a38483f61f702602d8a4b6')
Parameters
| Name | Description |
|---|---|
| node identifier | ID, name or IP address of the node |
Status Codes
| Status Code | Description |
|---|---|
| 200 | OK |
| 401 | Access denied |
| 404 | Node not found |
Result
[
 {"id":75,"name":"Locations"},
 {"id":219,"name":"Operating System Monitoring"},
 {"id":1005,"name":"Monitoring Dependencies"},
 {"id":1006,"name":"10.10.8.13/26"},
 {"id":1007,"name":"Windows 10"},
 {"id":1008,"name":"Workstations"}
]
get-list-of-monitoring-packs-of-the-node
Get List of Monitoring Packs of the Node
Get a list of Monitoring Packs of the node. The list is returned as an array of JSON objects.
GET/api/rest/2/nodes/<node identifier>/policies
cURL
curl --request GET --url "http://<netcrunch>/api/rest/2/nodes/1001/policies?api_key=<api key>"
Node.js
const
    http = require('http');
    http.get('http://localhost/api/rest/2/nodes/1001/policies?api_key=0406adfb5e41f58092a38483f61f702602d8a4b6', (res) => {
    res.setEncoding('utf8');
    res.on('error', (error) => { console.log(error) });
    res.on('data', (chunk) => { console.log(chunk) })
});
PowerShell
Invoke-RestMethod -Uri "http://localhost/api/rest/2/nodes/1001/policies?api_key=0406adfb5e41f58092a38483f61f702602d8a4b6"
Python
import requests
requests.get('http://localhost/api/rest/2/nodes/1001/policies?api_key=0406adfb5e41f58092a38483f61f702602d8a4b6')
Parameters
| Name | Description |
|---|---|
| node identifier | ID, name or IP address of the node |
Status Codes
| Status Code | Description |
|---|---|
| 200 | OK |
| 401 | Access denied |
| 404 | Node not found |
Result
[
 {"id":64,"name":"Basic Windows Monitoring"},
 {"id":78,"name":"Node Status"},
 {"id":79,"name":"Service Status"}
]
set-node-properties
Set Node Properties
Use a single request to change or set multiple properties of the node. You can use a JSON file as a payload to change multiple properties at once
List of all available properties
PUT/api/rest/2/nodes/<node identifier>/<property>
cURL
curl --request PUT --url "http://<netcrunch>/api/rest/2/nodes/1001/name?api_key=<api key>&value=<value>"
Node.js
const
    http = require('http'),
    options = {
        method: 'PUT',
        hostname: 'localhost',
        path: '/api/rest/2/nodes/1001',
        headers: {
            'Content-Type': 'application/json',
            "x-api-key": 'fb91cd1f6479db477276761a93e878d0b65e2039'
        }
    },
    data = {
        "name": "NewNodeName.ac.acme"
    };
const req = http.request(options, (res) => {
    res.setEncoding('utf8');

    res.on('error', (error) => { console.log(error) });
    res.on('data', (chunk) => { console.log(chunk) })
});
req.write(JSON.stringify(data));
req.end();
PowerShell
$url = "http://localhost/api/rest/2/nodes/1001"
$data = @{
    name='NewNodeName.ac.acme'
}
$body = (ConvertTo-Json $data)
$hdrs = @{}
$hdrs.Add("X-API-KEY","fb91cd1f6479db477276761a93e878d0b65e2039")
$hdrs.Add("Content-Type","application/json")
Invoke-RestMethod -Uri $url -Method Put -Body $body -Headers $hdrs
Python
import requests
url = 'http://localhost/api/rest/2/nodes/1001'
data = {
  "name": "NewNodeName.ac.acme"
}
headers = {
    'Content-Type': 'application/json',
    'x-api-key': 'fb91cd1f6479db477276761a93e878d0b65e2039'
}
requests.put(url=url, data=data, headers=headers)
Parameters
| Name | Description |
|---|---|
| node identifier | Node ID, DNS name or IP Address |
| property | Name of node property to get. The property name can contain a dot to query for sub-property. For Example, lastAlert.id or customFields.Info 1 |
| value | Value to set for the field |
Status Codes
| Status Code | Description |
|---|---|
| 200 | OK |
| 401 | Access denied |
| 404 | Node not found |
Result
{
"status": "ok"
}
set-node-property
Set Node Property
Change or set a single property of the node.
List of all available properties
PUT/api/rest/2/nodes/<node identifier>/<property>
cURL
curl --request PUT --url "http://<netcrunch>/api/rest/2/nodes/1001/name?api_key=<api key>&value=<value>"
Node.js
const
    http = require('http'),
    options = {
        method: 'PUT',
        hostname: 'localhost',
        path: '/api/rest/2/nodes/1001',
        headers: {
            'Content-Type': 'application/json',
            "x-api-key": 'fb91cd1f6479db477276761a93e878d0b65e2039'
        }
    },
    data = {
        "name": "NewNodeName.ac.acme"
    };
const req = http.request(options, (res) => {
    res.setEncoding('utf8');

    res.on('error', (error) => { console.log(error) });
    res.on('data', (chunk) => { console.log(chunk) })
});
req.write(JSON.stringify(data));
req.end();
PowerShell
$url = "http://localhost/api/rest/2/nodes/1001"
$data = @{
    name='NewNodeName.ac.acme'
}
$body = (ConvertTo-Json $data)
$hdrs = @{}
$hdrs.Add("X-API-KEY","fb91cd1f6479db477276761a93e878d0b65e2039")
$hdrs.Add("Content-Type","application/json")
Invoke-RestMethod -Uri $url -Method Put -Body $body -Headers $hdrs
Python
import requests
url = 'http://localhost/api/rest/2/nodes/1001'
data = {
  "name": "NewNodeName.ac.acme"
}
headers = {
    'Content-Type': 'application/json',
    'x-api-key': 'fb91cd1f6479db477276761a93e878d0b65e2039'
}
requests.put(url=rul, data=data, headers=headers)
Parameters
| Name | Description |
|---|---|
| node identifier | Node ID, DNS name or IP Address |
| property | Name of node property to get. The property name can contain a dot to query for sub-property. For example, lastAlert.id or customFields.Info 1 |
| value | Value to set for the field |
Status Codes
| Status Code | Description |
|---|---|
| 200 | OK |
| 401 | Access denied |
| 404 | Node not found |
Result
{
  "id": 1001
}
manage-node-monitoring-state
Manage Node Monitoring State
Enable or disable node monitoring by setting the value to on or off, additionally schedule a time when a node should be disabled and re-enabled
PUT/api/rest/2/nodes/<node identifier>/monitoring/<value>
cURL
curl --request PUT --url "http://<netcrunch>/api/rest/2/nodes/1001/monitoring/off?api_key=fb91cd1f6479db477276761a93e878d0b65e2039"
--header "Content-Type: application/json" --data "{\"disabledFrom\": \"2018-03-08T13:27:34.876Z\", \"disabledUntil\": \"2018-03-09T13:27:34.876Z\"}"
Node.js
const
    http = require('http'),
    options = {
        method: 'PUT',
        hostname: 'localhost',
        path: '/api/rest/2/nodes/1001/monitoring/off',
        headers: {
            'Content-Type': 'application/json',
            "x-api-key": 'fb91cd1f6479db477276761a93e878d0b65e2039'
        }
    },
    viewData = {
        "disabledFrom": "2018-03-08T13:27:34.876Z",
        "disabledUntil": "2018-03-09T13:27:34.876Z"
    };
    const req = http.request(options, (res) => {
    res.setEncoding('utf8');
    res.on('error', (error) => { console.log(error) });
    res.on('data', (chunk) => { console.log(chunk) })
});
req.write(JSON.stringify(viewData));
req.end();
PowerShell
$url = "http://localhost/api/rest/2/nodes/1001/monitoring/off"
$viewData = @{
    disabledFrom='2018-03-08T13:27:34.876Z'
    disabledUntil='2018-03-09T13:27:34.876Z'
}
$body = (ConvertTo-Json $viewData)
$hdrs = @{}
$hdrs.Add("X-API-KEY","fb91cd1f6479db477276761a93e878d0b65e2039")
$hdrs.Add("Content-Type","application/json")
Invoke-RestMethod -Uri $url -Method Put -Body $body -Headers $hdrs
Python
import requests
url = 'http://localhost/api/rest/2/nodes/1001/monitoring/off'
data = {
  "disabledFrom": "2018-03-08T13:27:34.876Z",
  "disabledUntil": "2018-03-09T13:27:34.876Z"
}
headers = {
    'Content-Type': 'application/json',
    'x-api-key': 'fb91cd1f6479db477276761a93e878d0b65e2039'
}
requests.put(url=url, data=data, headers=headers)
Parameters
| Name | Description |
|---|---|
| node identifier | Node ID, DNS name or IP Address |
| value | Values "on" / "off" |
| disabledFrom | Date to disable from. Ignored when value is "on" |
| disabledUntil | Date to disable until. Ignored when value is "on" |
Status Codes
| Status Code | Description |
|---|---|
| 200 | OK |
| 401 | Access denied |
| 404 | Node not found |
Result
{
"status": "ok"
}
add-network-service
Add Network Service
Add network service to the node. Node identifier and network service name are mandatory if no other parameters are provided program defaults will be used.
POST/api/rest/2/nodes/<node>/network-services
curl --request POST --url "https://localhost/api/rest/2/nodes/192.168.3.10/network-services?api_key=fb91cd1f6479db477276761a93e878d0b65e2039&name=SSH"
Node.js
const
    http = require('http');
    http.post('http://localhost/api/rest/2/nodes/1001/network-services?api_key=6e1190b27df8f5eb2bebeddea87426001e6f4b3d&name=SSH', (res) => {
    res.setEncoding('utf8');
    res.on('error', (error) => { console.log(error) });
    res.on('data', (chunk) => { console.log(chunk) })
});
PowerShell
Invoke-RestMethod -Method Post -Uri "http://localhost/api/rest/2/nodes/1001/network-services?api_key=6e1190b27df8f5eb2bebeddea87426001e6f4b3d&name=SSH"
Python
import requests
requests.post('http://localhost/api/rest/2/nodes/1001/network-services?api_key=6e1190b27df8f5eb2bebeddea87426001e6f4b3d&name=SSH')
Parameters
| Name | Description |
|---|---|
| node identifier | ID or name or IP address of node |
| name | Name of service to monitor |
| timeout | Specifies the maximum time in milliseconds that NetCrunch should wait for a reply |
| repeat | Number of requests to send in a single check |
| additionalRepeat | Number of additional checks when service is not responding (Error, timeout, etc.) |
| monitoringTime | Time set in minutes |
Status Codes
| Status Code | Description |
|---|---|
| 200 | OK |
| 401 | Access denied |
| 404 | Node not found |
Result
{
"status": "ok"
}
set-network-services-parameters
Set Network Services Parameters
Modify parameters of monitored network service of a node
PUT/api/rest/2/nodes/<node identifier>/network-services/<service>
cURL
curl --request PUT --url "https://localhost/api/rest/2/nodes/192.168.3.10/network-services/SSH?api_key=fb91cd1f6479db477276761a93e878d0b65e2039&timeout=2000"
Node.js
const
    http = require('http');
    http.put('https://localhost/api/rest/2/nodes/192.168.3.10/network-services/SSH?api_key=fb91cd1f6479db477276761a93e878d0b65e2039&timeout=2000', (res) => {
    res.setEncoding('utf8');
    res.on('error', (error) => { console.log(error) });
    res.on('data', (chunk) => { console.log(chunk) })
});
PowerShell
Invoke-RestMethod -Method put -Uri "https://localhost/api/rest/2/nodes/192.168.3.10/network-services/SSH?api_key=fb91cd1f6479db477276761a93e878d0b65e2039&timeout=2000"
Python
import requests
requests.put('https://localhost/api/rest/2/nodes/192.168.3.10/network-services/SSH?api_key=fb91cd1f6479db477276761a93e878d0b65e2039&timeout=2000')
Parameters
| Name | Description |
|---|---|
| node identifier | ID or name or IP address of node |
| service | Name of network service to modify |
| timeout | Specifies the maximum time in milliseconds that NetCrunch should wait for a reply |
| repeat | Number of requests to send in a single check |
| additionalRepeat | Number of additional checks when service is not responding (Error, timeout, etc.) |
| monitoringTime | Time set in minutes |
| isLeading | true/false, Leading Service is a network service designed to be checked as the only service when the node is DOWN |
Status Codes
| Status Code | Description |
|---|---|
| 200 | OK |
| 401 | Access denied |
| 404 | Node not found |
Result
{
"status": "ok"
}
remove-network-service
Remove Network Service
Remove network service monitoring from the node.
DELETE/api/rest/2/nodes/<node identifier>/network-services/<service>
cURL
curl --request DELETE --url "https://localhost/api/rest/2/nodes/192.168.3.10/network-services/SSH?api_key=fb91cd1f6479db477276761a93e878d0b65e2039&name=SSH"
Node.js
const
    http = require('http');
    http.delete('http://localhost/api/rest/2/nodes/1001/network-services?api_key=6e1190b27df8f5eb2bebeddea87426001e6f4b3d&name=SSH', (res) => {
    res.setEncoding('utf8');
    res.on('error', (error) => { console.log(error) });
    res.on('data', (chunk) => { console.log(chunk) })
});
PowerShell
Invoke-RestMethod -Method delete -Uri "http://localhost/api/rest/2/nodes/1001/network-services?api_key=6e1190b27df8f5eb2bebeddea87426001e6f4b3d&name=SSH"
Python
import requests
requests.delete('http://localhost/api/rest/2/nodes/1001/network-services?api_key=6e1190b27df8f5eb2bebeddea87426001e6f4b3d&name=SSH')
Parameters
| Name | Description |
|---|---|
| node identifier | ID or name or IP address of node |
| service | Name of network service to remove |
Status Codes
| Status Code | Description |
|---|---|
| 200 | OK |
| 401 | Access denied |
| 404 | Node not found |
Result
{
"status": "ok"
}
set-custom-field-value
Set Custom Field Value
Set the value of the custom field on a node. The custom field needs to be defined in NetCrunch in order to set the value on it.
PUT/api/rest/2/nodes/<node>/custom-fields/<field>
cURL
curl --request PUT --url "https://localhost/api/rest/2/nodes/192.168.3.10/custom-fields/Info%201?api_key=fb91cd1f6479db477276761a93e878d0b65e2039&value=My_Value"
Node.js
const
    http = require('http');
    http.put('https://localhost/api/rest/2/nodes/192.168.3.10/custom-fields/Info%201?api_key=fb91cd1f6479db477276761a93e878d0b65e2039&value=My_Value', (res) => {
    res.setEncoding('utf8');
    res.on('error', (error) => { console.log(error) });
    res.on('data', (chunk) => { console.log(chunk) })
});
PowerShell
Invoke-RestMethod -Method put -Uri "https://localhost/api/rest/2/nodes/192.168.3.10/custom-fields/Info%201?api_key=fb91cd1f6479db477276761a93e878d0b65e2039&value=My_Value"
Python
import requests
requests.put('https://localhost/api/rest/2/nodes/192.168.3.10/custom-fields/Info%201?api_key=fb91cd1f6479db477276761a93e878d0b65e2039&value=My_Value')
Parameters
| Name | Description |
|---|---|
| node identifier | ID or name or IP address of node |
| field | Name of the custom field to set |
| value | New field value |
Status Codes
| Status Code | Description |
|---|---|
| 200 | OK |
| 401 | Access denied |
| 404 | Node or field not found |
Result
{
"status": "ok"
}
remove-custom-field-value
Remove Custom Field Value
Remove custom field value from the node.
DELETE/api/rest/2/nodes/<node identifier>/custom-fields/<field>
cURL
curl --request DELETE --url "https://localhost/api/rest/2/nodes/192.168.3.10/custom-fields/Info%201?api_key=fb91cd1f6479db477276761a93e878d0b65e2039"
Node.js
const
    http = require('http');
    http.delete('https://localhost/api/rest/2/nodes/192.168.3.10/custom-fields/Info%201?api_key=fb91cd1f6479db477276761a93e878d0b65e2039', (res) => {
    res.setEncoding('utf8');
    res.on('error', (error) => { console.log(error) });
    res.on('data', (chunk) => { console.log(chunk) })
});
PowerShell
Invoke-RestMethod -Method delete -Uri "https://localhost/api/rest/2/nodes/192.168.3.10/custom-fields/Info%201?api_key=fb91cd1f6479db477276761a93e878d0b65e2039"
Python
import requests
requests.delete('https://localhost/api/rest/2/nodes/192.168.3.10/custom-fields/Info%201?api_key=fb91cd1f6479db477276761a93e878d0b65e2039')
Parameters
| Name | Description |
|---|---|
| node identifier | ID or name or IP address of node |
| field | Name of the custom field to remove |
Status Codes
| Status Code | Description |
|---|---|
| 200 | OK |
| 401 | Access denied |
| 404 | Node or field not found |
Result
{
"status": "ok"
}
add-secondary-interface
Add Secondary Interface
Add a secondary interface to a node. Both primary and secondary interface nodes must be monitored by NetCrunch.
POST/api/rest/2/nodes/<node identifier>/children/<child>
cURL
curl --request POST --url "https://localhost/api/rest/2/nodes/192.168.3.10/children/192.168.3.20?api_key=fb91cd1f6479db477276761a93e878d0b65e2039"
Node.js
const
    http = require('http');
    http.post('https://localhost/api/rest/2/nodes/192.168.3.10/children/192.168.3.20?api_key=fb91cd1f6479db477276761a93e878d0b65e2039', (res) => {
    res.setEncoding('utf8');
    res.on('error', (error) => { console.log(error) });
    res.on('data', (chunk) => { console.log(chunk) })
});
PowerShell
Invoke-RestMethod -Method Post -Uri "https://localhost/api/rest/2/nodes/192.168.3.10/children/192.168.3.20?api_key=fb91cd1f6479db477276761a93e878d0b65e2039"
Python
import requests
requests.post('https://localhost/api/rest/2/nodes/192.168.3.10/children/192.168.3.20?api_key=fb91cd1f6479db477276761a93e878d0b65e2039')
Parameters
| Name | Description |
|---|---|
| node identifier | ID or name or IP address of node |
| child | ID or name or IP address of a node to add |
Status Codes
| Status Code | Description |
|---|---|
| 200 | OK |
| 401 | Access denied |
| 404 | Node or child not found |
Result
{
"status": "ok"
}
remove-secondary-interface
Remove Secondary Interface
Remove the secondary interface node from the node.
DELETE/api/rest/2/nodes/<node identifier>/children/<child>
cURL
curl --request DELETE --url "https://localhost/api/rest/2/nodes/192.168.3.10/children/192.168.3.20?api_key=fb91cd1f6479db477276761a93e878d0b65e2039"
Node.js
const
    http = require('http');
    http.delete('https://localhost/api/rest/2/nodes/192.168.3.10/children/192.168.3.20?api_key=fb91cd1f6479db477276761a93e878d0b65e2039', (res) => {
    res.setEncoding('utf8');
    res.on('error', (error) => { console.log(error) });
    res.on('data', (chunk) => { console.log(chunk) })
});
PowerShell
Invoke-RestMethod -Method delete -Uri "https://localhost/api/rest/2/nodes/192.168.3.10/children/192.168.3.20?api_key=fb91cd1f6479db477276761a93e878d0b65e2039"
Python
import requests
requests.delete('https://localhost/api/rest/2/nodes/192.168.3.10/children/192.168.3.20?api_key=fb91cd1f6479db477276761a93e878d0b65e2039')
Parameters
| Name | Description |
|---|---|
| node identifier | ID or name or IP address of node |
| child | ID or name or IP address of a node to remove |
Status Codes
| Status Code | Description |
|---|---|
| 200 | OK |
| 401 | Access denied |
| 404 | Node or child not found |
Result
{
"status": "ok"
}
set-sensor-parameters
Set Sensor Parameters
Set parameters of the sensor
PUT/api/rest/2/nodes/<node>/sensors/<sensor>
curl --request PUT --url "https://localhost/api/rest/2/nodes/192.168.3.10/sensors/My%20Sensor?api_key=fb91cd1f6479db477276761a93e878d0b65e2039 --header "Content-Type: application/json" --data "{\"enabled\": true, \"credentials\": \"CredentialProfileName\", \"monitoringTime\": 5 }""
Node.js
const
    http = require('http'),
    querystring = require('querystring'),
    options = {
        method: 'PUT',
        hostname: 'localhost',
        path: '/api/rest/2/nodes/192.168.3.10/sensors/' + querystring.escape('My Sensor') ,
        headers: {
            "content-type": "application/json",
            "x-api-key": 'fb91cd1f6479db477276761a93e878d0b65e2039'
        }
    },
    data = {
        "enabled": true,
        "credentials": "CredentialProfileName",
        "monitoringTime": 5
    };
    const req = http.request(options, (res) => {
    res.setEncoding('utf8');

    res.on('error', (error) => { console.log(error) });
    res.on('data', (chunk) => { console.log(chunk) })
});
req.write(JSON.stringify(data));
req.end();
PowerShell
$url = "http://localhost/api/rest/2/nodes/192.168.3.10/sensors/My%20Sensor"
$data = @{
  enabled=true,
  credentials='CredentialProfileName',
  monitoringTime=5
}
$body = (ConvertTo-Json $viewData)
$hdrs = @{}
$hdrs.Add("X-API-KEY","fb91cd1f6479db477276761a93e878d0b65e2039")
$hdrs.Add("Content-Type","application/json")
Invoke-RestMethod -Uri $url -Method Put -Body $body -Headers $hdrs
Python
import requests
url = 'http://localhost/api/rest/2/nodes/192.168.3.10/sensors/My%20Sensor'
data = {
    "enabled": true,
    "credentials": "CredentialProfileName",
    "monitoringTime": 5
}
headers = {
    'Content-Type': 'application/json',
    'x-api-key': 'fb91cd1f6479db477276761a93e878d0b65e2039'
}
response = requests.put(url=url, data=data, headers=headers)
URL Parameters
| Name | Description |
|---|---|
| node identifier | ID, name, or IP address of a node to delete |
| sensor | UID or name of the sensor to modify. It may be a list of values separated by comma |
Data Parameters
| Name | Description |
|---|---|
| enabled | True/False |
| credentials | Name of credential profile |
| monitoring time | Value in minutes |
Status Codes
| Status Code | Description |
|---|---|
| 200 | OK |
| 401 | Access denied |
| 404 | Node or sensor not found |
set-monitoring-engine-parameters
Set Monitoring Engine Parameters
PUT/api/rest/2/nodes/<node>/monitoring-engines/<engine>
curl --request PUT --url "https://localhost/api/rest/2/nodes/192.168.3.10/monitoring-engines/Windows?api_key=fb91cd1f6479db477276761a93e878d0b65e2039 --header "Content-Type: application/json" --data "{\"enabled\": true, \"credentials\": \"<CredentialProfileName>\", \"monitoringTime\": 5}""
Node.js
const
    http = require('http'),
    querystring = require('querystring'),
    options = {
        method: 'PUT',
        hostname: 'localhost',
        path: '/api/rest/2/nodes/192.168.3.10/monitoring-engines/Windows',
        headers: {
            "content-type": "application/json",
            "x-api-key": 'fb91cd1f6479db477276761a93e878d0b65e2039'
        }
    },
    data = {
        "enabled": true,
        "credentials": "<CredentialProfileName>",
        "monitoringTime": 5
    };
    const req = http.request(options, (res) => {
    res.setEncoding('utf8');

    res.on('error', (error) => { console.log(error) });
    res.on('data', (chunk) => { console.log(chunk) })
});
req.write(JSON.stringify(data));
req.end();
PowerShell
$url = "http://localhost/api/rest/2/nodes/192.168.3.10/monitoring-engines/Windows"
$data = @{
  enabled=true,
  credentials='CredentialProfileName',
  monitoringTime=5
}
$body = (ConvertTo-Json $viewData)
$hdrs = @{}
$hdrs.Add("X-API-KEY","fb91cd1f6479db477276761a93e878d0b65e2039")
$hdrs.Add("Content-Type","application/json")
Invoke-RestMethod -Uri $url -Method Put -Body $body -Headers $hdrs
Python
import requests
url = 'http://localhost/api/rest/2/nodes/192.168.3.10/monitoring-engines/Windows'
data = {
    "enabled": true,
    "credentials": "CredentialProfileName",
    "monitoringTime": 5
}
headers = {
    'Content-Type': 'application/json',
    'x-api-key': 'fb91cd1f6479db477276761a93e878d0b65e2039'
}
response = requests.put(url=url, data=data, headers=headers)
URL Parameters
| Name | Description |
|---|---|
| node identifier | ID, name or IP address of a node |
| engine | ID or name of monitoring engine |
DataParameters
| Name | Description |
|---|---|
| enabled | true/false |
| credentials | Name of credential profile |
| monitoringTime | Value in minutes. Set to null to use the default (from the node) |
Status Codes
| Status Code | Description |
|---|---|
| 200 | OK |
| 401 | Access denied |
| 404 | Node or monitoring engine not found |
delete-sensor
Delete Sensor
This API has been deprecated for security reasons.
add-node-tag
Add Tag
Add tag to a node.
PUT/api/rest/2/nodes/<node>/tags/<tag>
cURL
curl --request PUT --url "https://localhost/api/rest/2/nodes/192.168.3.10/tags/tagA?api_key=fb91cd1f6479db477276761a93e878d0b65e2039"
Node.js
const
    http = require('http');
    http.put('https://localhost/api/rest/2/nodes/192.168.3.10/tags/tagA?api_key=fb91cd1f6479db477276761a93e878d0b65e2039', (res) => {
    res.setEncoding('utf8');
    res.on('error', (error) => { console.log(error) });
    res.on('data', (chunk) => { console.log(chunk) })
});
PowerShell
Invoke-RestMethod -Method put -Uri "https://localhost/api/rest/2/nodes/192.168.3.10/tags/tagA?api_key=fb91cd1f6479db477276761a93e878d0b65e2039"
Python
import requests
requests.put('https://localhost/api/rest/2/nodes/192.168.3.10/tags/tagA?api_key=fb91cd1f6479db477276761a93e878d0b65e2039')
Parameters
| Name | Description |
|---|---|
| node identifier | ID or name or IP address of node |
| tag | Name of the tag to add |
Status Codes
| Status Code | Description |
|---|---|
| 200 | OK, tag already exists |
| 201 | Created |
| 401 | Access denied |
| 404 | Node or field not found |
Result
{
"status": "ok"
}
remove-node-tag
Remove Tag
Remove tag the node.
DELETE/api/rest/2/nodes/<node identifier>/tags/<tag>
cURL
curl --request DELETE --url "https://localhost/api/rest/2/nodes/192.168.3.10/tags/tagA?api_key=fb91cd1f6479db477276761a93e878d0b65e2039"
Node.js
const
    http = require('http');
    http.delete('https://localhost/api/rest/2/nodes/192.168.3.10/tags/tagA?api_key=fb91cd1f6479db477276761a93e878d0b65e2039', (res) => {
    res.setEncoding('utf8');
    res.on('error', (error) => { console.log(error) });
    res.on('data', (chunk) => { console.log(chunk) })
});
PowerShell
Invoke-RestMethod -Method delete -Uri "https://localhost/api/rest/2/nodes/192.168.3.10/tags/tagA?api_key=fb91cd1f6479db477276761a93e878d0b65e2039"
Python
import requests
requests.delete('https://localhost/api/rest/2/nodes/192.168.3.10/tags/tagA?api_key=fb91cd1f6479db477276761a93e878d0b65e2039')
Parameters
| Name | Description |
|---|---|
| node identifier | ID or name or IP address of node |
| tag | Name of the tag to remove |
Status Codes
| Status Code | Description |
|---|---|
| 200 | OK |
| 401 | Access denied |
| 404 | Node or field not found |
Result
{
"status": "ok"
}
delete-node
Delete Node
Remove the node from the Atlas.
DELETE/api/rest/2/nodes/<node identifier>
curl --request DELETE --url "https://localhost/api/rest/2/nodes/192.168.3.15?api_key=fb91cd1f6479db477276761a93e878d0b65e2039"
Node.js
const
    http = require('http');
    http.delete('https://localhost/api/rest/2/nodes/192.168.3.15?api_key=fb91cd1f6479db477276761a93e878d0b65e2039', (res) => {
    res.setEncoding('utf8');
    res.on('error', (error) => { console.log(error) });
    res.on('data', (chunk) => { console.log(chunk) })
});
PowerShell
Invoke-RestMethod -Method delete -Uri "https://localhost/api/rest/2/nodes/192.168.3.15?api_key=fb91cd1f6479db477276761a93e878d0b65e2039"
Python
import requests
requests.delete('https://localhost/api/rest/2/nodes/192.168.3.15?api_key=fb91cd1f6479db477276761a93e878d0b65e2039')
Parameters
| Name | Description |
|---|---|
| node identifier | ID, name or IP address of a node to delete |
Status Codes
| Status Code | Description |
|---|---|
| 200 | OK |
| 401 | Access denied |
| 404 | Node not found |
Atlas Views and Folders
Views and Folders API allows us to add, remove, access, and retrieve Folders and Views data in NetCrunch.
add-view
Add View
Add a static view to the atlas. If no parent folder is provided, the view will be added on the "Custom Views" level.
POST/api/rest/2/views
cURL
curl --request POST --url "https://localhost/api/rest/2/views?api_key=fb91cd1f6479db477276761a93e878d0b65e2039"
--header "Content-Type: application/json" --data "{\"name\": \"New view\"}"
Node.js
const
    http = require('http'),
    options = {
        method: 'POST',
        hostname: 'localhost',
        path: '/api/rest/2/views',
        headers: {
            'Content-Type': 'application/json',
            "x-api-key": 'fb91cd1f6479db477276761a93e878d0b65e2039'
        }
    },
    viewData = {
        "name": "New View"
    };
    const req = http.request(options, (res) => {
    res.setEncoding('utf8');
    res.on('error', (error) => { console.log(error) });
    res.on('data', (chunk) => { console.log(chunk) })
});
req.write(JSON.stringify(viewData));
req.end();
PowerShell
$url = "http://localhost/api/rest/2/views"
$viewData = @{
    name='New View'
}
$body = (ConvertTo-Json $viewData)
$hdrs = @{}
$hdrs.Add("X-API-KEY","fb91cd1f6479db477276761a93e878d0b65e2039")
$hdrs.Add("Content-Type","application/json")
Invoke-RestMethod -Uri $url -Method Post -Body $body -Headers $hdrs
Python
import requests
url = 'http://localhost/api/rest/2/views'
data = {
  "name": "New View"
}
headers = {
    'Content-Type': 'application/json',
    'x-api-key': 'fb91cd1f6479db477276761a93e878d0b65e2039'
}
requests.post(url=url, data=data, headers=headers)
Parameters
| Name | Description |
|---|---|
| name | Name of the new view |
| parent | ID, name or path to parent map |
Status Codes
| Status Code | Description |
|---|---|
| 200 | OK |
| 400 | Name is missing |
| 400 | NetCrunch request error |
| 401 | Access Denied |
| 412 | No API Key |
Result
The result contains the id of the added (or found) view.
{ "id": 1001 }
add-folder
Add Folder
Add empty folder to the Atlas. If no parent folder is provided, it will be added on the "Custom Views" level.
POST/api/rest/2/views/folder
cURL
curl --request POST --url "https://localhost/api/rest/2/views/folder?api_key=fb91cd1f6479db477276761a93e878d0b65e2039"
--header "Content-Type: application/json" --data "{\"name\": \"New Folder\"}"
Node.js
const
    http = require('http'),
    options = {
        method: 'POST',
        hostname: 'localhost',
        path: '/api/rest/2/views/folder',
        headers: {
            'Content-Type': 'application/json',
            "x-api-key": 'fb91cd1f6479db477276761a93e878d0b65e2039'
        }
    },
    viewData = {
        "name": "New Folder"
    };
    const req = http.request(options, (res) => {
    res.setEncoding('utf8');
    res.on('error', (error) => { console.log(error) });
    res.on('data', (chunk) => { console.log(chunk) })
});
req.write(JSON.stringify(viewData));
req.end();
PowerShell
$url = "http://localhost/api/rest/2/views/folder"
$viewData = @{
    name='New Folder'
}
$body = (ConvertTo-Json $viewData)
$hdrs = @{}
$hdrs.Add("X-API-KEY","fb91cd1f6479db477276761a93e878d0b65e2039")
$hdrs.Add("Content-Type","application/json")
Invoke-RestMethod -Uri $url -Method Post -Body $body -Headers $hdrs
Python
import requests
url = 'http://localhost/api/rest/2/views/folder'
data = {
  "name": "New Folder"
}
headers = {
    'Content-Type': 'application/json',
    'x-api-key': 'fb91cd1f6479db477276761a93e878d0b65e2039'
}
requests.post(url=url, data=data, headers=headers)
Parameters
| Name | Description |
|---|---|
| name | Name of the new view |
| parent | ID, name or path to parent map |
Status Codes
| Status Code | Description |
|---|---|
| 200 | OK |
| 400 | Name is missing |
| 400 | NetCrunch request error |
| 401 | Access denied |
| 412 | No API key |
Result
{
  "id": 1001
}
get-view-properties
Get View Properties
Get properties of the view based on the filter.
List Of Additional IP Network View Properties
GET/api/rest/2/views/<view>?properties=<filter>
cURL
curl --url "http://localhost/api/rest/2/views/Custom%20Views?api_key=fb91cd1f6479db477276761a93e878d0b65e2039&properties=name,status"
Node.js
const
    http = require('http');
    http.get('http://localhost/api/rest/2/views/Custom%20Views?api_key=0406adfb5e41f58092a38483f61f702602d8a4b6&properties=name,status', (res) => {
    res.setEncoding('utf8');
    res.on('error', (error) => { console.log(error) });
    res.on('data', (chunk) => { console.log(chunk) })
});
PowerShell
Invoke-RestMethod -Uri "http://localhost/api/rest/2/views/Custom%20Views?api_key=0406adfb5e41f58092a38483f61f702602d8a4b6&properties=name,status"
Python
import requests
requests.get('http://localhost/api/rest/2/views/Custom%20Views?api_key=0406adfb5e41f58092a38483f61f702602d8a4b6&properties=name,status')
Parameters
| Name | Description |
|---|---|
| view | View ID, name or path |
| filter | List of properties. Returns all properties if omitted, value is "all" or "*" |
Status Codes
| Status Code | Description |
|---|---|
| 200 | OK |
| 401 | Access denied |
| 404 | View not found |
Result
{
 "id": 1050,
 "name": "Parent",
 "status": "unknown",
 "stats": {
   "nodes": {
     "total": 0,
     "ok": 0,
     "unknown": 0,
     "warning": 0,
     "error": 0,
     "alerts": {
       "active": 0,
       "las24Hours": {
         "unacknowledged": 0,
         "total": 0,
         "critical": 0,
         "warning": 0
       }
     }
   },
   "maps": {
     "total": 2,
     "ok": 0,
     "unknown": 0,
     "warning": 2,
     "error": 0
   }
 },
 "path": "/Custom Views",
 "isDynamic": true,
 "isFolder": true,
 "readOnly": false
 }
get-view-property
Get View Property
Get a single property of the view.
GET/api/rest/2/views/<view>/<property>
[List Of Additional IP Network View Properties](@api-data-properties:ip-network-property-list
cURL
curl --url "http://localhost/api/rest/2/views/Custom%20Views/id?api_key=fb91cd1f6479db477276761a93e878d0b65e2039"
Node.js
const
    http = require('http');
    http.get('http://localhost/api/rest/2/views/Custom%20Views/id?api_key=0406adfb5e41f58092a38483f61f702602d8a4b6', (res) => {
    res.setEncoding('utf8');
    res.on('error', (error) => { console.log(error) });
    res.on('data', (chunk) => { console.log(chunk) })
});
PowerShell
Invoke-RestMethod -Uri "http://localhost/api/rest/2/views/Custom%20Views/id?api_key=0406adfb5e41f58092a38483f61f702602d8a4b6"
Python
import requests
requests.get('http://localhost/api/rest/2/views/Custom%20Views/id?api_key=0406adfb5e41f58092a38483f61f702602d8a4b6')
Parameters
| Name | Description |
|---|---|
| view | Name ID or path to the view |
| property | Name of the property to get |
Status Codes
| Status Code | Description |
|---|---|
| 200 | OK |
| 401 | Access denied |
| 404 | View not found |
Result
{
  "id": 1001
}
set-view-property
Set View Property
Set or change view property
PUT/api/rest/2/views/<view>/<property>
cURL
curl --request PUT --url "https://localhost/api/rest/2/views/1050?api_key=fb91cd1f6479db477276761a93e878d0b65e2039"
--header "Content-Type: application/json" --data "{\"name\": \"New Name\"}"
Node.js
const
    http = require('http'),
    options = {
        method: 'PUT',
        hostname: 'localhost',
        path: '/api/rest/2/views/1050',
        headers: {
            'Content-Type': 'application/json',
            "x-api-key": 'fb91cd1f6479db477276761a93e878d0b65e2039'
        }
    },
    viewData = {
        "name": "New Name"
    };
    const req = http.request(options, (res) => {
    res.setEncoding('utf8');
    res.on('error', (error) => { console.log(error) });
    res.on('data', (chunk) => { console.log(chunk) })
});
req.write(JSON.stringify(viewData));
req.end();
PowerShell
$url = "http://localhost/api/rest/2/views/1050"
$viewData = @{
    name='New Name'
}
$body = (ConvertTo-Json $viewData)
$hdrs = @{}
$hdrs.Add("X-API-KEY","fb91cd1f6479db477276761a93e878d0b65e2039")
$hdrs.Add("Content-Type","application/json")
Invoke-RestMethod -Uri $url -Method Put -Body $body -Headers $hdrs
Python
import requests
url = 'http://localhost/api/rest/2/views/1050'
data = {
  "name": "New Name"
}
headers = {
    'Content-Type': 'application/json',
    'x-api-key': 'fb91cd1f6479db477276761a93e878d0b65e2039'
}
requests.put(url=url, data=data, headers=headers)
Parameters
| Name | Description |
|---|---|
| view | View ID, name or path |
| property | Name of view property to set |
Status Codes
| Code | Description |
|---|---|
| 200 | OK |
| 401 | Access denied |
| 404 | View Not Found |
Result
{
 "status": "ok"
 }
get-list-of-nodes-in-the-view
Get List of Nodes in the View
Get the list of Nodes Present in the View.
GET/api/rest/2/views/<view>/nodes
cURL
curl --url "http://localhost/api/rest/2/views/Unresponding%20Nodes/nodes?api_key=fb91cd1f6479db477276761a93e878d0b65e2039"
Node.js
const
    http = require('http');
    http.get('http://localhost/api/rest/2/views/Unresponding%20Nodes/nodes?api_key=0406adfb5e41f58092a38483f61f702602d8a4b6', (res) => {
    res.setEncoding('utf8');
    res.on('error', (error) => { console.log(error) });
    res.on('data', (chunk) => { console.log(chunk) })
});
PowerShell
Invoke-RestMethod -Uri "http://localhost/api/rest/2/views/Unresponding%20Nodes/nodes?api_key=0406adfb5e41f58092a38483f61f702602d8a4b6"
Python
import requests
requests.get('http://localhost/api/rest/2/views/Unresponding%20Nodes/nodes?api_key=0406adfb5e41f58092a38483f61f702602d8a4b6')
Parameters
| Name | Description |
|---|---|
| view | Name ID or path to the view |
| property | Name of the property to get |
Status Codes
| Status Code | Description |
|---|---|
| 200 | OK |
| 401 | Access denied |
| 404 | View not found |
Result
[
  {"id":1019,"name":"foo","networkAddress":"192.168.1.89","dnsName":"foo.test.com"},
  {"id":1019,"name":"bar","networkAddress":"192.168.1.10","dnsName":"bar.test.com"}
]
add-node-to-the-view
Add Node to the View
Add the monitored node to a view.
POST/api/rest/2/views/<view>/nodes/<node>
cURL
curl --request POST --url "https://localhost/api/rest/2/views/New%20View/nodes/192.168.1.10?api_key=fb91cd1f6479db477276761a93e878d0b65e2039"
Node.js
const
    http = require('http'),
    querystring = require('querystring'),
    options = {
        method: 'POST',
        hostname: 'localhost',
        path: '/api/rest/2/views/' + querystring.escape('New View') + '/nodes/192.168.1.10' ,
        headers: {
            "x-api-key": 'fb91cd1f6479db477276761a93e878d0b65e2039'
        }
    };
    const req = http.request(options, (res) => {
    res.setEncoding('utf8');
    res.on('error', (error) => { console.log(error) });
    res.on('data', (chunk) => { console.log(chunk) })
});
req.end();
PowerShell
$url = "http://localhost/api/rest/2/views/New%20View/nodes/192.168.1.10"
$hdrs = @{}
$hdrs.Add("X-API-KEY","fb91cd1f6479db477276761a93e878d0b65e2039")
$hdrs.Add("Content-Type","application/json")
Invoke-RestMethod -Uri $url -Method Post -Headers $hdrs
Python
import requests
url = 'http://localhost/api/rest/2/views/New%20View/nodes/192.168.1.10'
headers = {
    'Content-Type': 'application/json',
    'x-api-key': 'fb91cd1f6479db477276761a93e878d0b65e2039'
}
response = requests.post(url=url, headers=headers)
Parameters
| Name | Description |
|---|---|
| view | Name ID or path to the view |
| node | ID, name or IP address of the node to add |
Status Codes
| Status Code | Description |
|---|---|
| 200 | OK |
| 401 | Access denied |
| 404 | View or node not found |
Result
{
  "status":"ok"
}
remove-node-from-the-view
Remove Node From the View
Remove the node from a view.
DELETE/api/rest/2/views/<view>/nodes/<node>
cURL
curl --request DELETE --url "https://localhost/api/rest/2/views/New%20View/nodes/192.168.1.10?api_key=fb91cd1f6479db477276761a93e878d0b65e2039"
Node.js
const
    http = require('http'),
    querystring = require('querystring'),
    options = {
        method: 'DELETE',
        hostname: 'localhost',
        path: '/api/rest/2/views/' + querystring.escape('New View') + '/nodes/192.168.1.10',
        headers: {
            "x-api-key": 'fb91cd1f6479db477276761a93e878d0b65e2039'
        }
    };
    const req = http.request(options, (res) => {
    res.setEncoding('utf8');
    res.on('error', (error) => { console.log(error) });
    res.on('data', (chunk) => { console.log(chunk) })
});
req.end();
PowerShell
$url = "http://localhost/api/rest/2/views/New%20View/nodes/192.168.1.10"
$hdrs = @{}
$hdrs.Add("X-API-KEY","fb91cd1f6479db477276761a93e878d0b65e2039")
$hdrs.Add("Content-Type","application/json")
Invoke-RestMethod -Uri $url -Method Delete -Headers $hdrs
Python
import requests
url = 'http://localhost/api/rest/2/views/New%20View/nodes/192.168.1.10'
headers = {
    'Content-Type': 'application/json',
    'x-api-key': 'fb91cd1f6479db477276761a93e878d0b65e2039'
}
response = requests.delete(url=url, headers=headers)
Parameters
| Name | Description |
|---|---|
| view | Name ID or path to the view |
| node | ID, name or IP address of the node to remove |
Status Codes
| Status Code | Description |
|---|---|
| 200 | OK |
| 401 | Access denied |
| 404 | View or node not found |
Result
{
  "status":"ok"
}
enable-ip-network-view-monitoring
Enable IP Network View Monitoring
Enable monitoring of all nodes in the view
PUT/api/rest/2/views/<view>/enable
cURL
curl --request PUT --url "https://localhost/api/rest/2/views/1050/enable?api_key=fb91cd1f6479db477276761a93e878d0b65e2039"
Node.js
const
    http = require('http'),
    options = {
        method: 'PUT',
        hostname: 'localhost',
        path: '/api/rest/2/views/1050/enable',
        headers: {
            'Content-Type': 'application/json',
            "x-api-key": 'fb91cd1f6479db477276761a93e878d0b65e2039'
        }
    };
    const req = http.request(options, (res) => {
    res.setEncoding('utf8');
    res.on('error', (error) => { console.log(error) });
    res.on('data', (chunk) => { console.log(chunk) })
});
req.end();
PowerShell
$url = "http://localhost/api/rest/2/views/1050/enable"
$hdrs = @{}
$hdrs.Add("X-API-KEY","fb91cd1f6479db477276761a93e878d0b65e2039")
$hdrs.Add("Content-Type","application/json")
Invoke-RestMethod -Uri $url -Method Put -Headers $hdrs
Python
import requests
url = 'http://localhost/api/rest/2/views/1050/enable'
headers = {
    'Content-Type': 'application/json',
    'x-api-key': 'fb91cd1f6479db477276761a93e878d0b65e2039'
}
requests.put(url=url, headers=headers)
Parameters
| Name | Description |
|---|---|
| view | View ID, name or path |
Status Codes
| Status Code | Description |
|---|---|
| 200 | OK |
| 401 | Access denied |
| 404 | View not found |
Result
{
  "status":"ok"
}
disable-ip-network-view-monitoring
Disable IP Network View Monitoring
Disable monitoring of all nodes in the view
PUT/api/rest/2/views/<view>/disable
cURL
curl --request PUT --url "https://localhost/api/rest/2/views/1050/disable?api_key=fb91cd1f6479db477276761a93e878d0b65e2039"
--header "Content-Type: application/json"
--data "{\"disabledFrom\": \"2019-01-01T13:27:34.876Z\", \"disabledUntil\": \""2019-02-01T13:27:34.876Z"\"}"
Node.js
const
    http = require('http'),
    options = {
        method: 'PUT',
        hostname: 'localhost',
        path: '/api/rest/2/views/1050/disable',
        headers: {
            'Content-Type': 'application/json',
            "x-api-key": 'fb91cd1f6479db477276761a93e878d0b65e2039'
        }
    },
    viewData = {
        "disabledFrom": "2019-01-01T13:27:34.876Z",
        "disabledUntil": "2019-02-01T13:27:34.876Z"
    };
PowerShell
$url = "http://localhost/api/rest/2/views/1050/disable"
$viewData = @{
    disabledFrom: '2019-01-01T13:27:34.876Z',
    disabledUntil: '2019-02-01T13:27:34.876Z'
}
$body = (ConvertTo-Json $viewData)
$hdrs = @{}
$hdrs.Add("X-API-KEY","fb91cd1f6479db477276761a93e878d0b65e2039")
$hdrs.Add("Content-Type","application/json")
Invoke-RestMethod -Uri $url -Method Put -Body $body -Headers $hdrs
Python
import requests
url = 'http://localhost/api/rest/2/views/1050/disable'
data = {
  "disabledFrom": "2019-01-01T13:27:34.876Z",
  "disabledUntil": "2019-02-01T13:27:34.876Z"
}
headers = {
    'Content-Type': 'application/json',
    'x-api-key': 'fb91cd1f6479db477276761a93e878d0b65e2039'
}
requests.put(url=url, data=data, headers=headers)
Parameters
| Name | Description |
|---|---|
| view | View ID, name or path |
| disabledFrom | 2018-03-08T13:27:34.876Z |
| disabledUntil | 2018-03-09T13:27:34.876Z |
Status Codes
| Status Code | Description |
|---|---|
| 200 | OK |
| 401 | Access denied |
| 404 | View not found |
Result
{
  "status":"ok"
}
delete-view
Delete View
Remove view from the Atlas.
DELETE/api/rest/2/views/<view>
cURL
curl --request DELETE --url "https://localhost/api/rest/2/views/New%20View?api_key=fb91cd1f6479db477276761a93e878d0b65e2039"
Node.js
const
    http = require('http'),
    querystring = require('querystring'),
    options = {
        method: 'DELETE',
        hostname: 'localhost',
        path: '/api/rest/2/views/' + querystring.escape('New View'),
        headers: {
            "x-api-key": 'fb91cd1f6479db477276761a93e878d0b65e2039'
        }
    };
    const req = http.request(options, (res) => {
    res.setEncoding('utf8');
    res.on('error', (error) => { console.log(error) });
    res.on('data', (chunk) => { console.log(chunk) })
});
req.end();
PowerShell
$url = "http://localhost/api/rest/2/views/New%20View"
$hdrs = @{}
$hdrs.Add("X-API-KEY","fb91cd1f6479db477276761a93e878d0b65e2039")
$hdrs.Add("Content-Type","application/json")
Invoke-RestMethod -Uri $url -Method Delete -Headers $hdrs
Python
import requests url = 'http://localhost/api/rest/2/views/New%20View' headers = { 'Content-Type': 'application/json', 'x-api-key': 'fb91cd1f6479db477276761a93e878d0b65e2039' } response = requests.delete(url=url, headers=headers)
Parameters
| Name | Description |
|---|---|
| view | Name or ID or path of the view to delete |
Status Codes
| Status Code | Description |
|---|---|
| 200 | OK |
| 401 | Access denied |
| 404 | View not found |
Result
{ "id": 1001 }
Monitoring Packs And Map Policies
Monitoring Packs and Map Policies API allows us to get and set various properties of Monitoring Packs and Map Policies; additionally, it can be used to get a list of nodes that are using monitoring pack or policy and modify such list by adding and removing nodes.
All requests below can be applied to Monitoring Packs and Map Policies
get-monitoring-pack-properties
Get Monitoring Pack Properties
Get properties of the monitoring pack based on the filter.
GET/api/rest/2/policies/<policy>?properties=<filter>
List Of Additional Monitoring Pack Properties
cURL
curl --url "http://localhost/api/rest/2/policies/CPU?api_key=fb91cd1f6479db477276761a93e878d0b65e2039&properties=name,status"
Node.js
const http = require('http'); http.get('http://localhost/api/rest/2/policies/CPU?api_key=0406adfb5e41f58092a38483f61f702602d8a4b6&properties=name,status', (res) => { res.setEncoding('utf8'); res.on('error', (error) => { console.log(error) }); res.on('data', (chunk) => { console.log(chunk) }) });
PowerShell
Invoke-RestMethod -Uri "http://localhost/api/rest/2/policies/CPU?api_key=0406adfb5e41f58092a38483f61f702602d8a4b6&properties=name,status"
Python
import requests requests.get('http://localhost/api/rest/2/policies/CPU?api_key=0406adfb5e41f58092a38483f61f702602d8a4b6&properties=name,status')
Parameters
| Name | Description |
|---|---|
| policy | Policy ID, name or path |
| filter | List of properties. Returns all properties if omitted, value is "all" or "*" |
Status Codes
| Status Code | Description |
|---|---|
| 200 | OK |
| 401 | Access denied |
| 404 | Policy not found |
Result
{ "id": 1050, "name": "CPU", "status": "unknown", "stats": { "nodes": { "total": 0, "ok": 0, "unknown": 0, "warning": 0, "error": 0, "alerts": { "active": 0, "las24Hours": { "unacknowledged": 0, "total": 0, "critical": 0, "warning": 0 } } }, "maps": { "total": 2, "ok": 0, "unknown": 0, "warning": 2, "error": 0 } }, "path": "/Monitoring Packs/Operating Systems/Windows/CPU", "isDynamic": true, "isFolder": true, "readOnly": false }
get-monitoring-pack-property
Get Monitoring Pack Property
Get a single property of the monitoring pack.
GET/api/rest/2/policies/<policy>/<property>
List Of Additional Monitoring Pack Properties
cURL
curl --url "http://localhost/api/rest/2/policies/CPU/id?api_key=fb91cd1f6479db477276761a93e878d0b65e2039"
Node.js
const http = require('http'); http.get('http://localhost/api/rest/2/policies/CPU/id?api_key=0406adfb5e41f58092a38483f61f702602d8a4b6', (res) => { res.setEncoding('utf8'); res.on('error', (error) => { console.log(error) }); res.on('data', (chunk) => { console.log(chunk) }) });
PowerShell
Invoke-RestMethod -Uri "http://localhost/api/rest/2/policies/CPU/id?api_key=0406adfb5e41f58092a38483f61f702602d8a4b6"
Python
import requests requests.get('http://localhost/api/rest/2/policies/CPU/id?api_key=0406adfb5e41f58092a38483f61f702602d8a4b6')
Parameters
| Name | Description |
|---|---|
| policy | Policy ID, name or path |
| property | Name of the property to get |
Status Codes
| Status Code | Description |
|---|---|
| 200 | OK |
| 401 | Access denied |
| 404 | Policy not found |
Result
{ "id": 78 }
set-monitoring-pack-property
Set Monitoring Pack Property
Set a property of the monitoring pack
PUT/api/rest/2/policies/<policy>/<property>
cURL
curl --request PUT --url "https://localhost/api/rest/2/policies/1050?api_key=fb91cd1f6479db477276761a93e878d0b65e2039" --header "Content-Type: application/json" --data "{\"name\": \"New Name\"}"
Node.js
const http = require('http'), options = { method: 'PUT', hostname: 'localhost', path: '/api/rest/2/policies/1050', headers: { 'Content-Type': 'application/json', "x-api-key": 'fb91cd1f6479db477276761a93e878d0b65e2039' } }, viewData = { "name": "New Name" }; const req = http.request(options, (res) => { res.setEncoding('utf8');
res.on('error', (error) => { console.log(error) }); res.on('data', (chunk) => { console.log(chunk) }) }); req.write(JSON.stringify(viewData)); req.end();
PowerShell
$url = "http://localhost/api/rest/2/policies/1050" $viewData = @{ name='New Name' } $body = (ConvertTo-Json $viewData) $hdrs = @{} $hdrs.Add("X-API-KEY","fb91cd1f6479db477276761a93e878d0b65e2039") $hdrs.Add("Content-Type","application/json") Invoke-RestMethod -Uri $url -Method Put -Body $body -Headers $hdrs
Python
import requests url = 'http://localhost/api/rest/2/policies/1050' data = { "name": "New Name" } headers = { 'Content-Type': 'application/json', 'x-api-key': 'fb91cd1f6479db477276761a93e878d0b65e2039' } requests.put(url=url, data=data, headers=headers)
Parameters
| Name | Description |
|---|---|
| view | Policy ID, name or path |
| property | Name of policy property to set |
Status Codes
| Status Code | Description |
|---|---|
| 200 | OK |
| 401 | Access denied |
| 404 | Policy not found |
Result
{ "status":"ok" }
enable-monitoring-pack
Enable Monitoring Pack
Enable all alerting and data collection of the monitoring pack
PUT/api/rest/2/policies/<view>/enable
cURL
curl --request PUT --url "https://localhost/api/rest/2/policies/1050/enable?api_key=fb91cd1f6479db477276761a93e878d0b65e2039"
Node.js
const http = require('http'), options = { method: 'PUT', hostname: 'localhost', path: '/api/rest/2/policies/1050/enable', headers: { 'Content-Type': 'application/json', "x-api-key": 'fb91cd1f6479db477276761a93e878d0b65e2039' } }; const req = http.request(options, (res) => { res.setEncoding('utf8'); res.on('error', (error) => { console.log(error) }); res.on('data', (chunk) => { console.log(chunk) }) }); req.end();
PowerShell
$url = "http://localhost/api/rest/2/policies/1050/enable" $hdrs = @{} $hdrs.Add("X-API-KEY","fb91cd1f6479db477276761a93e878d0b65e2039") $hdrs.Add("Content-Type","application/json") Invoke-RestMethod -Uri $url -Method Put -Headers $hdrs
Python
import requests url = 'http://localhost/api/rest/2/policies/1050/enable' headers = { 'Content-Type': 'application/json', 'x-api-key': 'fb91cd1f6479db477276761a93e878d0b65e2039' } requests.put(url=url, headers=headers)
Parameters
| Name | Description |
|---|---|
| view | View ID, name or path |
Status Codes
| Status Code | Description |
|---|---|
| 200 | OK |
| 401 | Access denied |
| 404 | Policy not found |
Result
{ "status":"ok" }
disable-monitoring-pack
Disable Monitoring Pack
Disable all alerting and data collection of the monitoring pack
PUT/api/rest/2/policies/<policy>/disable
cURL
curl --request PUT --url "https://localhost/api/rest/2/views/1050/disable?api_key=fb91cd1f6479db477276761a93e878d0b65e2039"
Node.js
const http = require('http'), options = { method: 'PUT', hostname: 'localhost', path: '/api/rest/2/views/1050/disable', headers: { 'Content-Type': 'application/json', "x-api-key": 'fb91cd1f6479db477276761a93e878d0b65e2039' } }; const req = http.request(options, (res) => { res.setEncoding('utf8'); res.on('error', (error) => { console.log(error) }); res.on('data', (chunk) => { console.log(chunk) }) }); req.end();
PowerShell
$url = "http://localhost/api/rest/2/views/1050/disable" $hdrs = @{} $hdrs.Add("X-API-KEY","fb91cd1f6479db477276761a93e878d0b65e2039") $hdrs.Add("Content-Type","application/json") Invoke-RestMethod -Uri $url -Method Put -Headers $hdrs
Python
import requests url = 'http://localhost/api/rest/2/views/1050/disable' headers = { 'Content-Type': 'application/json', 'x-api-key': 'fb91cd1f6479db477276761a93e878d0b65e2039' } requests.put(url=url, headers=headers)
Parameters
| Name | Description |
|---|---|
| policy | Policy ID, name or path |
Status Codes
| Status Code | Description |
|---|---|
| 200 | OK |
| 401 | Access denied |
| 404 | Policy not found |
Result
{ "status":"ok" }
get-list-of-nodes-of-the-monitoring-pack
Get List of Nodes of the Monitoring Pack
Get all nodes that belong to the monitoring pack.
GET/api/rest/2/policies/<policy>/nodes
cURL
curl --url "http://localhost/api/rest/2/policies/CPU/nodes?api_key=fb91cd1f6479db477276761a93e878d0b65e2039"
Node.js
const http = require('http'); http.get('http://localhost/api/rest/2/policies/CPU/nodes?api_key=0406adfb5e41f58092a38483f61f702602d8a4b6', (res) => { res.setEncoding('utf8'); res.on('error', (error) => { console.log(error) }); res.on('data', (chunk) => { console.log(chunk) }) });
PowerShell
Invoke-RestMethod -Uri "http://localhost/api/rest/2/policies/CPU/nodes?api_key=0406adfb5e41f58092a38483f61f702602d8a4b6"
Python
import requests requests.get('http://localhost/api/rest/2/policies/CPU/nodes?api_key=0406adfb5e41f58092a38483f61f702602d8a4b6')
Parameters
| Name | Description |
|---|---|
| policy | Name ID or path to the policy |
Status Codes
| Status Code | Description |
|---|---|
| 200 | OK |
| 401 | Access denied |
| 404 | Policy not found |
Result
[ {"id":1019,"name":"foo","networkAddress":"192.168.1.89","dnsName":"foo.test.com"}, {"id":1019,"name":"bar","networkAddress":"192.168.1.10","dnsName":"bar.test.com"} ]
add-node-to-the-monitoring-pack
Add Node To the Monitoring Pack
Add node to the monitoring pack (applies to manual monitoring packs only)
POST/api/rest/2/policies/<view>/nodes/<node>
cURL
curl --request POST --url "https://localhost/api/rest/2/policies/CPU/nodes/192.168.1.10?api_key=fb91cd1f6479db477276761a93e878d0b65e2039"
Node.js
const http = require('http'), querystring = require('querystring'), options = { method: 'POST', hostname: 'localhost', path: '/api/rest/2/policies/CPU/nodes/192.168.1.10' , headers: { "x-api-key": 'fb91cd1f6479db477276761a93e878d0b65e2039' } }; const req = http.request(options, (res) => { res.setEncoding('utf8'); res.on('error', (error) => { console.log(error) }); res.on('data', (chunk) => { console.log(chunk) }) }); req.end();
PowerShell
$url = "http://localhost/api/rest/2/policies/CPU/nodes/192.168.1.10" $hdrs = @{} $hdrs.Add("X-API-KEY","fb91cd1f6479db477276761a93e878d0b65e2039") $hdrs.Add("Content-Type","application/json") Invoke-RestMethod -Uri $url -Method Post -Headers $hdrs
Python
import requests url = 'http://localhost/api/rest/2/policies/CPU/nodes/192.168.1.10' headers = { 'Content-Type': 'application/json', 'x-api-key': 'fb91cd1f6479db477276761a93e878d0b65e2039' } response = requests.post(url=url, headers=headers)
Parameters
| Name | Description |
|---|---|
| view | Name ID or path to the policy |
| node | ID, name or IP address of the node to add |
Status Codes
| Status Code | Description |
|---|---|
| 200 | OK |
| 401 | Access denied |
| 404 | Policy or node not found |
Result
{ "status":"ok" }
remove-node-from-the-monitoring-pack
Remove Node from the Monitoring Pack
Remove a node from the monitoring pack (applies to manual monitoring packs only)
DELETE/api/rest/2/policies/<policy>/nodes/<node>
cURL
curl --request DELETE --url "https://localhost/api/rest/2/policies/CPU/nodes/192.168.1.10?api_key=fb91cd1f6479db477276761a93e878d0b65e2039"
Node.js
const http = require('http'), querystring = require('querystring'), options = { method: 'DELETE', hostname: 'localhost', path: '/api/rest/2/policies/CPU/nodes/192.168.1.10' , headers: { "x-api-key": 'fb91cd1f6479db477276761a93e878d0b65e2039' } }; const req = http.request(options, (res) => { res.setEncoding('utf8'); res.on('error', (error) => { console.log(error) }); res.on('data', (chunk) => { console.log(chunk) }) }); req.end();
PowerShell
$url = "http://localhost/api/rest/2/policies/CPU/nodes/192.168.1.10" $hdrs = @{} $hdrs.Add("X-API-KEY","fb91cd1f6479db477276761a93e878d0b65e2039") $hdrs.Add("Content-Type","application/json") Invoke-RestMethod -Uri $url -Method Delete -Headers $hdrs
Python
import requests url = 'http://localhost/api/rest/2/policies/CPU/nodes/192.168.1.10' headers = { 'Content-Type': 'application/json', 'x-api-key': 'fb91cd1f6479db477276761a93e878d0b65e2039' } response = requests.delete(url=url, headers=headers)
Parameters
| Name | Description |
|---|---|
| policy | Name ID or path to the policy |
| node | ID, name or IP address of the node to remove |
Status Codes
| Status Code | Description |
|---|---|
| 200 | OK |
| 401 | Access denied |
| 404 | Policy or node not found |
Result
{ "status":"ok" }
Credentials
Credentials API allows to get information and remove credentials in NetCrunch
get-credential-types
Get Credential Types
Get a list of credential types as an array.
GET/api/rest/2/credentials
cURL
curl --url "http://localhost/api/rest/2/credentials?api_key=fb91cd1f6479db477276761a93e878d0b65e2039""
Node.js
const http = require('http'); http.get('http://localhost/api/rest/2/credentials?api_key=0406adfb5e41f58092a38483f61f702602d8a4b6', (res) => { res.setEncoding('utf8'); res.on('error', (error) => { console.log(error) }); res.on('data', (chunk) => { console.log(chunk) }) });
PowerShell
Invoke-RestMethod -Uri "http://localhost/api/rest/2/credentials?api_key=0406adfb5e41f58092a38483f61f702602d8a4b6"
Python
import requests requests.get('http://localhost/api/rest/2/credentials?api_key=0406adfb5e41f58092a38483f61f702602d8a4b6')
Status Codes
| Status Code | Description |
|---|---|
| 200 | OK |
| 401 | Access denied |
Result
["BSD","ESXi","Linux","macOS","Solaris","Windows","Database Connection","HTTP","Email incoming","IPMI","Email (SMTP)","Simple"]
get-names-of-defined-credentials
Get Names of Defined Credentials
Get a list of defined credentials.
GET/api/rest/2/credentials/<type>
cURL
curl --url "http://localhost/api/rest/2/credentials/Windows?api_key=fb91cd1f6479db477276761a93e878d0b65e2039"
Node.js
const http = require('http'); http.get('http://localhost/api/rest/2/credentials/Windows?api_key=0406adfb5e41f58092a38483f61f702602d8a4b6', (res) => { res.setEncoding('utf8'); res.on('error', (error) => { console.log(error) }); res.on('data', (chunk) => { console.log(chunk) }) });
PowerShell
Invoke-RestMethod -Uri "http://localhost/api/rest/2/credentials/Windows?api_key=0406adfb5e41f58092a38483f61f702602d8a4b6"
Python
import requests requests.get('http://localhost/api/rest/2/credentials/Windows?api_key=0406adfb5e41f58092a38483f61f702602d8a4b6')
Parameters
| Name | Description |
|---|---|
| type | Type of credentials |
Status Codes
| Status Code | Description |
|---|---|
| 200 | OK |
| 401 | Access denied |
Result
["<Default>","New Profile"]
remove-credentials
Remove Credentials
The API has been deprecated for security reasons.
Notes
Notes API allows to add, edit, retrieve, and archive notes
add-note
Add Note
Notes added this way can't be later changed, retrieved or archived, for such functionalities, see: Add or update note using reference id
POST /api/rest/2/notes/<node>
cURL
curl --request POST --url "http://localhost/api/rest/2/notes/1001?api_key=fb91cd1f6479db477276761a93e878d0b65e2039"--header "Content-Type: application/json" --data "{\"subject\": \"Note\ Subject\"}"
Node.js
const http = require('http'), options = { method: 'POST', hostname: 'localhost', path: '/api/rest/2/notes/1001', headers: { 'Content-Type': 'application/json', "x-api-key": 'fb91cd1f6479db477276761a93e878d0b65e2039' } }, data = { "subject": "Note Subject", "text": "Note Text", "label": "red", "category": "Note Category" }; const req = http.request(options, (res) => { res.setEncoding('utf8');
res.on('error', (error) => { console.log(error) }); res.on('data', (chunk) => { console.log(chunk) }) }); req.write(JSON.stringify(data)); req.end();
PowerShell
$url = "http://localhost/api/rest/2/notes/1001" $ata = @{ subject='Note Subject' } $body = (ConvertTo-Json $data) $hdrs = @{} $hdrs.Add("X-API-KEY","fb91cd1f6479db477276761a93e878d0b65e2039") $hdrs.Add("Content-Type","application/json") Invoke-RestMethod -Uri $url -Method Post -Body $body -Headers $hdrs
Python
import requests url = 'http://localhost/api/rest/2/notes/1001' data = { "subject": "Note Subject" } headers = { 'Content-Type': 'application/json', 'x-api-key': 'fb91cd1f6479db477276761a93e878d0b65e2039' } requests.post(url=url, data=data, headers=headers)
Parameters
| Name | Description |
|---|---|
| node | Node ID, DNS name or IP Address |
POST parameters
| Name | Description |
|---|---|
| subject | Note subject |
| text | Note text |
| label | leave empty or use predefined labels: 'red', 'green', 'blue', 'yellow' |
| due | Note due date |
| category | Note category |
| archived | true or false |
Parameters in JSON format
{ "subject": "Note Subject", "text": "Note Text", "label": "red", "due": "2020-01-10T18:02:36.017Z", "category": "My Category", "archived": false }
Status Codes
| Status Code | Description |
|---|---|
| 200 | OK |
| 401 | Access denied |
| 404 | Node not found |
update-or-add-note-using-reference-id
Add or update note by using reference ID
This method will add a note to the node with reference id - passed in the URL. Reference ID can be any string or numeric value, and it's used to identify note in NetCrunch for further modification or archivization of the note
PUT /api/rest/2/notes/<node>/<refId>
cURL
curl --request put--url "http://localhost/api/rest/2/notes/1001/myNoteID?api_key=fb91cd1f6479db477276761a93e878d0b65e2039" --header "Content-Type: application/json" --data "{\"subject\": \"Note\ Subject\"}"
Node.js
const http = require('http'), options = { method: 'put', hostname: 'localhost', path: '/api/rest/2/notes/1001/myNoteID', headers: { 'Content-Type': 'application/json', "x-api-key": 'fb91cd1f6479db477276761a93e878d0b65e2039' } }, data = { "subject": "Note Subject", "text": "Note Text", "label": "red", "category": "Note Category" };const req = http.request(options, (res) => { res.setEncoding('utf8');
res.on('error', (error) => { console.log(error) }); res.on('data', (chunk) => { console.log(chunk) }) }); req.write(JSON.stringify(data)); req.end();
PowerShell
$url = "http://localhost/api/rest/2/notes/1001/myNoteID" $data = @{ subject='Note Subject' } $body = (ConvertTo-Json $data) $hdrs = @{} $hdrs.Add("X-API-KEY","fb91cd1f6479db477276761a93e878d0b65e2039") $hdrs.Add("Content-Type","application/json") Invoke-RestMethod -Uri $url -Method put-Body $body -Headers $hdrs
Python
import requests url = 'http://localhost/api/rest/2/notes/1001/myNoteID' data = { "subject": "Note Subject" } headers = { 'Content-Type': 'application/json', 'x-api-key': 'fb91cd1f6479db477276761a93e878d0b65e2039' } requests.put(url=url, data=data, headers=headers)
Parameters
| Name | Description |
|---|---|
| node | Node ID, DNS name or IP Address |
| refid | Note reference ID |
PUT parameters
| Name | Description |
|---|---|
| subject | Note subject |
| text | Note text |
| label | leave empty or use predefined labels: 'red', 'green', 'blue', 'yellow' |
| due | Note due date |
| category | Note category |
| archived | true or false |
Parameters in JSON format
{ "subject": "Note Subject", "text": "Note Text", "label": "red", "due": "2020-01-10T18:02:36.017Z", "category": "My Category", "archived": false }
Status Codes
| Status Code | Description |
|---|---|
| 200 | OK |
| 401 | Access denied |
| 404 | Node not found |
update-or-add-note-property-using-reference-id
Add or Update note property by using reference ID
PUT /api/rest/2/notes/<node>/<refId>/<property>
cURL
curl --request PUT--url "http://localhost/api/rest/2/notes/1001/myNoteID/subject?api_key=fb91cd1f6479db477276761a93e878d0b65e2039" --header "Content-Type: application/json" --data "{\"value\": \"New\ Subject\"}"
Node.js
const http = require('http'), options = { method: 'PUT', hostname: 'localhost', path: '/api/rest/2/notes/1001/myNoteID/subject', headers: { 'Content-Type': 'application/json', "x-api-key": 'fb91cd1f6479db477276761a93e878d0b65e2039' } }, data = { "value": "New Subject" };const req = http.request(options, (res) => { res.setEncoding('utf8');
res.on('error', (error) => { console.log(error) }); res.on('data', (chunk) => { console.log(chunk) }) }); req.write(JSON.stringify(data)); req.end();
PowerShell
$url = "http://localhost/api/rest/2/notes/1001/myNoteID/subject" $data = @{ value='New Subject' } $body = (ConvertTo-Json $data) $hdrs = @{} $hdrs.Add("X-API-KEY","fb91cd1f6479db477276761a93e878d0b65e2039") $hdrs.Add("Content-Type","application/json") Invoke-RestMethod -Uri $url -Method put-Body $body -Headers $hdrs
Python
import requests url = 'http://localhost/api/rest/2/notes/1001/myNoteID/subject' data = { "value": "New Subject" } headers = { 'Content-Type': 'application/json', 'x-api-key': 'fb91cd1f6479db477276761a93e878d0b65e2039' } requests.post(url=url, data=data, headers=headers)
Parameters
| Name | Description |
|---|---|
| node | Node ID, DNS name or IP Address |
| refid | Note reference ID |
| property | Name of property to change. Values: 'subject', 'text', 'label', 'due', 'category', 'archived' |
PUT parameters
| Name | Description |
|---|---|
| subject | Note subject |
| text | Note text |
| label | leave empty or use predefined labels: 'red', 'green', 'blue', 'yellow' |
| due | Note due date |
| category | Note category |
| archived | true or false |
Parameters in JSON format
{ "subject": "Note Subject", "text": "Note Text", "label": "red", "due": "2020-01-10T18:02:36.017Z", "category": "My Category", "archived": false }
Status Codes
| Status Code | Description |
|---|---|
| 200 | OK |
| 401 | Access denied |
| 404 | Node not found |
get-note-by-reference-id
Get note by reference ID
GET GET /api/rest/2/notes/<node>/<refId>
cURL
curl --url "http://localhost/api/rest/2/notes/1001/myNoteID?api_key=fb91cd1f6479db477276761a93e878d0b65e2039"
Node.js
const http = require('http');http.get('http://localhost/api/rest/2/notes/1001/myNoteID?api_key=0406adfb5e41f58092a38483f61f702602d8a4b6', (res) => { res.setEncoding('utf8');
res.on('error', (error) => { console.log(error) }); res.on('data', (chunk) => { console.log(chunk) }) });
PowerShell
Invoke-RestMethod -Uri "http://localhost/api/rest/2/notes/1001/myNoteID?api_key=0406adfb5e41f58092a38483f61f702602d8a4b6"
Python
import requests requests.get('http://localhost/api/rest/2/notes/1001/myNoteID?api_key=0406adfb5e41f58092a38483f61f702602d8a4b6')
Parameters
| Name | Description |
|---|---|
| node | Node ID, DNS name or IP Address |
| refid | Note reference ID |
Status Codes
| Status Code | Description |
|---|---|
| 200 | OK |
| 401 | Access denied |
| 404 | Node or note not found |
Result
{ subject: "Note subject", archived: false, category: 'Note Category', due: '2020-04-17T15:53:19.773Z', label: 'red', refId: 'myNoteID', text: 'My Note Text' }
get-note-property-by-reference-id
Get note property by reference ID
GET /api/rest/2/notes/<node>/<refId>/<property>
cURL
curl --url "http://localhost/api/rest/2/notes/1001/myNoteID/subject?api_key=fb91cd1f6479db477276761a93e878d0b65e2039"
Node.js
const http = require('http');http.get('http://localhost/api/rest/2/notes/1001/myNoteID/subject?api_key=0406adfb5e41f58092a38483f61f702602d8a4b6', (res) => { res.setEncoding('utf8');
res.on('error', (error) => { console.log(error) }); res.on('data', (chunk) => { console.log(chunk) }) });
PowerShell
Invoke-RestMethod -Uri "http://localhost/api/rest/2/notes/1001/myNoteID/subject?api_key=0406adfb5e41f58092a38483f61f702602d8a4b6"
Python
import requests requests.get('http://localhost/api/rest/2/notes/1001/myNoteID/subject?api_key=0406adfb5e41f58092a38483f61f702602d8a4b6')
Parameters
| Name | Description |
|---|---|
| node | Node ID, DNS name or IP Address |
| refid | Note reference ID |
| property | Name of property to change. Values: 'subject', 'text', 'label', 'due', 'category', 'archived' |
Status Codes
| Status Code | Description |
|---|---|
| 200 | OK |
| 401 | Access denied |
| 404 | Node or note not found |
Result
{ subject: "Note subject", archived: false, category: 'Note Category', due: '2020-04-17T15:53:19.773Z', label: 'red', refId: 'myNoteID', text: 'My Note Text' }
Data Properties Reference
Find a reference to all NetCrunch object properties exposed through API
This section describes fields that can be accessed via API. Please refer to examples to see the results of a query of the individual fields.
node-property-list
Node Property List
The list below shows all node fields accessible via API. Not every field can be modified. These are marked as Read-Only
| API Name | Data Type | Read-Only | Comments | |
|---|---|---|---|---|
| networkServices | string | |||
| monitoringTime | number | minutes | ||
| dependsOnNode | number | |||
| netBiosName | string | x | ||
| identification | string | values: 'default', 'ipAddress', 'dnsName', 'macAddress' | ||
| deviceType | string | |||
| parentNode | number | |||
| children | number | |||
| id | number | x | ||
| name | string | |||
| networkAddress | string | |||
| snmpComputerName | string | x | ||
| snmpSysObjId | string | x | ||
| snmpOsDescription | string | x | ||
| snmpLocation | string | x | ||
| dnsName | string | x | ||
| avgResponseTime | number | x | miliseconds(ms) | |
| maxResponsetime | number | x | miliseconds(ms) | |
| alerts24h | number | x | ||
| lastAlert | number/string | x | result contains both number and string values | |
| snmpManaged | bool | |||
| snmpProfile | string | Name of SNMP profile | ||
| snmpPort | number | |||
| snmpTimeout | number | miliseconds(ms) | ||
| snmpRetryCount | number | |||
| macAddress | string | x | ||
| networkPrefixLength | number | i.e. 24 = 255.255.255.0 | ||
| connectedToSwitch | string | x | ||
| enabled | bool | |||
| status | string | x | values: 'unknown', 'down', 'warning', 'OK', 'disabled', 'disabled by dependency', 'disabled by time restrictions', 'disabled by user', 'waiting for response', 'disabled by network', 'disabled by unknown IP address', 'monitoring paused' | |
| simplifiedMonitoring | bool | true/false | ||
| disabledFrom | number | |||
| disabledUntil | number | |||
| addTime | number | x | ||
| lastStatusChange | number | x | ||
| parentNode | string | x | ||
| issueCount | number | x | ||
| virtualization | string | x | ||
| monitoringEngines | string | See column Monitoring Engines in Nodes view | ||
| children | object | It can be an array - depends on how many child nodes are provided, e.g. [1021,1022] | ||
| pendingAlertsCount | number | x | ||
| customFields | object | It's possible to set multiple custom fields with one object e.g. {"Info 1": "TestVal1", "Info 2": "TestVal2", "Pick": "3"} | ||
| interfacesMonitoringEnabled | bool | |||
| organizationalUnit | string | x | ||
| snmpTrapCodePage | number | |||
| sysLogCodePage | number | |||
| lastNote | object | x | ||
| displayName | string | |||
| organization | number | |||
| nodeType | string | x | values: 'IP Node', 'Business Status', 'Remote Sensor Node', 'Monitoring Probe', 'Node Monitoring Template' | |
| probeType | string | x | ||
| addressSpace | number | x | ||
| templateNode | number | x | ||
| osMonitorType | string | values: 'auto', 'none', 'windows', 'macOS', 'linux', 'bsd', 'esx', 'solaris', 'proxmox' | ||
| hypervisorKind | number | x | ||
| sensors | object | |||
| tags | string | values: A,B,C |
Example
{ "id": 1001, "name": "admin.ad.acme", "dnsName": "admin.ad.acme", "networkAddress": "192.168.0.25", "networkPrefixLength": 24, "snmpComputerName": "admin.ad.acme", "snmpOsDescription": "Hardware: Intel64 Family 6 Model 26 Stepping 5 AT/AT COMPATIBLE - Software: Windows Version 6.3 (Build 16299 Multiprocessor Free)", "snmpSysObjId": "1.3.6.1.4.1.311.1.1.3.1.1", "snmpLocation": "Development", "snmpAvailable": true, "snmpManaged": true, "snmpProfile": "Default (read-write)", "snmpPort": 161, "snmpTimeout": 5000, "snmpRetryCount": 3, "displayName": "My Node", "monitoringTime": "5", "networkServices": [ { "name": "SSH", "status": "Not Responding", "errorMessage": "Can't open connection" }, { "name": "CIFS/SMB", "isLeading": true, "status": "OK" } ], "dependsOnNode": { "nodeId": 1003, "name": "test.ad.acme", "networkAddress": "10.10.3.72", "dnsName": "test.ad.acme" }, "netBiosName": "ADMIN", "identification": "default", "deviceType": { "class": "Server/Workstation", "os": "Windows Server", "version": "Windows 2012 R2 Server" }, "parentNode": { "nodeId": 1003, "name": "test.ad.acme", "networkAddress": "10.10.3.72", "dnsName": "test.ad.acme" }, "simplifiedMonitoring": false, "status": "OK", "avgResponseTime": 10, "maxResponseTime": 100, "alerts24h": { "count": 5, "critical": 2, "warning": 3, "unacknowledged": 1 }, "lastAlert": { "id": 585266, "info": "Node Down", "serverity": "Critical", "time": "2018-10-09T06:15:15.000Z" }, "macAddress": "D89EF32B5ADD", "enabled": true, "disabledFrom": "2018-03-08T13:27:34.876Z", "disabledUntil": "2018-03-09T13:27:34.876Z", "addTime": "2018-02-08T13:27:34.876Z", "lastStatusChange": "2018-10-09T10:08:58.885Z", "issueCount": 2, "connectedToSwitch": { "nodeId": 1078, "interface": "Port-channel2", "port": 464, "vlanId": 999 }, "virtualization": { "type": "Hyper-V", "hostNodeId": 1023, "hostName": "virt-host.ad.acme", "dataCenter": "Master Data Center" }, "monitoringEngines": [ { "name": "win", "enabled": true, "status": "OK" }, { "name": "ntsvc", "enabled": true, "status": "unknown" }, { "name": "ntlog", "enabled": true, "status": "OK" } ], "children": [ 1506, 1507 ], "pendingAlertsCount": 0, "customFields": { "Info 1": "TestVal1", "Info 2": "TestVal2", "Pick": "3", "Date Field": "1990-10-04T23:00:00.000Z" }, "interfacesMonitoringEnabled": true, "organizationalUnit": "Testing", "snmpTrapPage": 4294967295, "sysLogPage": 4294967295, "lastNote": null, "templateNode": { "nodeId": 1234, "name": "template", "networkAddress": "", "dnsName": "" }, "addressSpace": "" }
view-property-list
View Property List
The list below shows view fields accessible via API
| Property | Read-Only | Comments |
|---|---|---|
| id | x | ID of the view |
| name | Name of the View | |
| status | x | values: 'unknown', 'down', 'OK', 'warning' |
| stats | x | object representing view stats |
| path | x | "/" seperated path to view/policy |
| isDynamic | x | |
| isFolder | x | |
| readOnly | x |
Example
{ "id": 50, "name": "CPU", "status": "unknown", "stats": { "nodes": { "total": 0, "ok": 0, "unknown": 0, "warning": 0, "error": 0, "alerts": { "active": 0, "las24Hours": { "unacknowledged": 0, "total": 0, "critical": 0, "warning": 0 } } }, "maps": { "total": 22, "ok": 0, "unknown": 16, "warning": 3, "error": 3 } }, "path": "/Monitoring Packs/Operating Systems/Windows/CPU", "isDynamic": true, "isFolder": false, "readOnly": false }
ip-network-property-list
Additional Properties for IP Network Views
Besides of view property list table below shows an additional field for IP network views.
| Property | Read-Only | Comments |
|---|---|---|
| networkAddress | x | Network Address of the View |
| networkPrefixLength | x | Prefix length of the view |
| monitoringEnabled | Monitoring enabled true/false | |
| addressSpace | x | Address Space of the view |
Example
{ "networkAddress": "10.10.4.64", "networkPrefixLength": 26, "monitoringEnabled": true, "addressSpace": "" }
monitoring-pack-property-list
Additional Properties for Monitoring Packs
Besides of view, the property list table below shows an additional field for policies.
| Property | Read-Only | Comments |
|---|---|---|
| policyType | x | values: '', 'windows', 'linux', 'macos', 'bsd', 'esx', 'solaris' |
| enabled | true/false | |
| snmpRequired | x | true/false |
Example
{ "policyType": "windows", "enabled": true, "snmpRequired": false }
REST API Use Cases
Use NetCrunch REST API to automate repeatable administration tasks, including maintenance mode, node import, custom field updates, and monitoring provider assignment.
NetCrunch REST API is best suited for deterministic automation: scripts, scheduled jobs, integrations, and repeatable operational procedures.
Typical REST API use cases include:
- importing nodes from CSV or an external inventory system
- synchronizing NetCrunch with a CMDB, IPAM, or asset database
- updating node custom fields
- assigning monitoring providers
- enabling or disabling monitoring during maintenance
- retrieving node, alert, view, or policy data
- integrating NetCrunch with internal tools and portals
REST API is the right choice when the workflow is known in advance and should behave the same way every time.
For AI-assisted workflows, adaptive investigation, or autonomous agents, see the separate MCP and Agent Use Cases chapter.
REST API and MCP Server use the same API key mechanism, user permissions, read-only mode, connection restrictions, audit logging, and rate limiting. This chapter focuses on direct REST API scripting.
Before You Start
Before running any script, create an API key in NetCrunch.
See Getting Started for the API key creation process.
Recommended API key settings for scripts:
- use a dedicated NetCrunch user account
- use read-only mode unless the script must change NetCrunch configuration
- set an expiration date
- restrict the key by source IP address when possible
- use a separate API key per script or integration
- use the x-api-key header instead of passing the key in the URL
- review NetCrunch event logs after deployment
Treat API keys as passwords. Do not commit API keys to source control or store them in shared script folders.
Maintenance-mode Script
This Python script puts a node into the monitoring disabled state and sets the given message in the Info1 field.
This can be used to avoid false-positive alerts on nodes under maintenance and inform other users that the disabled state is intentional.
Typical use cases:
- planned server restart
- switch replacement
- operating system patching
- hardware maintenance
- temporary application shutdown
- suppressing alerts during a known outage window
Pre-requisites
- Python 3
- argparse library
- requests library
Install dependencies:
pip install argparse requests
Usage
python maintenance-mode.py 192.168.0.50 disable -msg Maintenance
To re-enable monitoring:
python maintenance-mode.py 192.168.0.50 enable
Setup
-
Add an application in NetCrunch. See Getting Started to learn how to add an application and generate an API key
-
Update these two lines in the script:
nc_address = "NetCrunch Address"nc_api_key = "Application API Key"
-
Required arguments:
- node: node ID, IP address, or DNS name
- action: enable or disable
-
Optional argument:
-msg: message to set in the Info1 field
If the -msg argument is omitted, the Info1 field is cleared.
Using node ID is the most stable option for automation. Names and addresses can change.
Script file
maintenance-mode.py
import requests import argparsenc_address = "NetCrunch Address" nc_api_key = "Application API-Key"
def send_request(url, request): headers = { "content-type": "application/json", "x-api-key": nc_api_key }
if (request == "delete"): r = requests.delete(url, headers=headers) print("Status Code:", r.status_code, ", NetCrunch response:", r.text) return r elif (request == "put"): r = requests.put(url, headers=headers) print("Status Code:", r.status_code, ", NetCrunch response:", r.text) return rparser = argparse.ArgumentParser() parser.add_argument("node", help="Node to change monitoring state, identified by ID, IP address, or DNS name") parser.add_argument("action", help="Monitoring state: enable or disable") parser.add_argument("-msg", nargs="?", help="Optional: set message in Info1 field. Omit to clear Info1 field") args = parser.parse_args()
if (args.action == "enable"): action = "on" else: action = "off"
url = "http://" + nc_address + "/api/rest/2/nodes/" + args.node + "/monitoring/" + action print("Changing monitoring state:") send_request(url, "put")
if (args.msg != None): url = "http://" + nc_address + "/api/rest/2/nodes/" + args.node + "/custom-fields/Info%201?value=" + args.msg print("Adding Info1 field:") send_request(url, "put") else: url = "http://" + nc_address + "/api/rest/2/nodes/" + args.node + "/custom-fields/Info%201" print("Removing data from Info1 field:") send_request(url, "delete")
Notes
This script uses the x-api-key header. This is preferred over passing the API key in the URL.
The API key must not be read-only because the script changes node monitoring state and updates a custom field.
Recommended Improvements
For production use, consider extending the script with:
- HTTPS instead of HTTP
- validation of the
enableordisableargument - URL encoding for the message value
- timeout handling
- retry logic for temporary connection errors
- environment variables for API key storage
- logging to a file
- automatic re-enable time if used in maintenance workflows
Import Nodes from CSV File
This JavaScript script adds nodes to NetCrunch from a CSV file.
Additionally, this use case adds extra data to two custom fields for each node:
- Location
- Info 2
The use case includes two files:
- script file:
add-nodes.js - data file:
data.csv
This pattern is useful when importing nodes from:
- external inventory systems
- CMDB exports
- asset management databases
- IPAM tools
- manually prepared spreadsheets
- provisioning systems
Pre-requisites
- Node.js
Usage
node add-nodes.js
Setup
-
Add an application in NetCrunch. See Getting Started to learn how to add an application and generate an API key
-
Update these entries in the script:
hostname: "NetCrunch address or DNS name""x-api-key": "application api key"
-
The script requires no additional parameters. It reads data from
data.csvand sends it to NetCrunch
Additional Information
The script can be modified to include more custom fields. Add more else if statements with the required field name.
Make sure that the custom field is defined in NetCrunch before executing the script.
For additional fields like Display Name, add the parameter name in the first row of the CSV file and add values in the rows.
See Node Property List for available parameters.
This is a minimal CSV example. If field values can contain commas, quotes, or line breaks, use a proper CSV parser instead of splitting lines by comma.
Script files
add-nodes.js
const http = require("http"), fs = require("fs"), readline = require("readline"), nodesFile = (__dirname + "/data.csv"), options = { method: "POST", hostname: "IP or Name of NC server", path: "/api/rest/2/nodes", headers: { "Content-Type": "application/json", "x-api-key": "api-key" } };function sendRequest(payload) { const req = http.request(options, res => { res.setEncoding("utf8");
if (res.statusCode != 200) { console.log("Error: Status code: " + res.statusCode + " Message: " + res.statusMessage); } else { res.on("data", chunk => { let response = JSON.parse(chunk); if (response.info === "Already monitored") { console.log("Warning: ID: " + response.id + " Node is already monitored"); } else { console.log("OK: ID:" + response.id + " Node is added"); } }); } }); req.write(JSON.stringify(payload)); req.end();}
function addNodesFromFile(fileName) { console.log("Reading file and adding nodes...");
const rl = readline.createInterface({ input: fs.createReadStream(fileName), crlfDelay: Infinity }); let header; rl.on("line", line => { if (header == null) { header = line.split(","); } else { const properties = line.split(","), data = { customFields: {} }; header.forEach((name, ix) => { if ((properties[ix] || "") !== "") { if (name === "Location") { data.customFields.Location = properties[ix]; } else if (name === "Info 2") { data.customFields["Info 2"] = properties[ix]; } else { data[name] = properties[ix]; } } }); sendRequest(data); } });}
addNodesFromFile(nodesFile);
Data file
data.csv
name,networkAddress,osMonitorType,Location,Info 2
vm-test-0066.ac.acme,10.20.16.66,Windows,Server-Rack-1,VM-For-Testing
vm-test-0084.ac.acme,10.20.16.84,Windows,Server-Rack-2,VM-For-Testing
cam-0015.ac.acme,10.20.16.15,none,Server-Room,Camera
cam-0057.ac.acme,10.20.16.57,none,Office,Camera
How It Works
The script:
- Opens
data.csv - Reads the first row as the header
- Uses every following row as node data
- Creates a JSON payload for each node
- Sends a POST request to:
/api/rest/2/nodes
- Adds selected fields into
customFields - Prints whether each node was added or was already monitored
Recommended Improvements
For production use, consider adding:
- HTTPS support
- API key from environment variable
- proper CSV parser
- request timeout
- retry handling
- failed-row log
- duplicate detection before sending
- dry-run mode
- rate limit handling
Import Nodes from CSV File and Set Monitoring Provider
This is a modified version of the Import Nodes from CSV File script.
It allows you to add multiple nodes monitored by a remote probe.
The use case includes two files:
- script file:
add-nodes.js - data file:
data.csv
This is useful when adding nodes for:
- branch offices
- remote sites
- isolated networks
- customer networks
- networks monitored by dedicated probes
- segmented address spaces
Pre-requisites
- Node.js
Usage
node add-nodes.js
Setup
-
Add an application in NetCrunch. See Getting Started to learn how to add an application and generate an API key
-
Update these entries in the script:
hostname: "NetCrunch address or DNS name""x-api-key": "application api key"
-
The remote probe node must be added before executing this script. Otherwise, added nodes may be assigned to the Master Server
-
The script requires no additional parameters. It reads data from
data.csvand sends it to NetCrunch
The monitoring provider value must match an existing NetCrunch monitoring provider. Add and verify the remote probe before running the import.
Script files
add-nodes.js
const http = require("http"), fs = require("fs"), readline = require("readline"), nodesFile = (__dirname + "/data.csv"), options = { method: "POST", hostname: "IP Address or DNS name of NC Server", path: "/api/rest/2/nodes", headers: { "Content-Type": "application/json", "x-api-key": "apikey" } };function sendRequest(payload) { const req = http.request(options, res => { res.setEncoding("utf8");
if (res.statusCode != 200) { console.log("Error: Status code: " + res.statusCode + " Message: " + res.statusMessage); } else { res.on("data", chunk => { let response = JSON.parse(chunk); if (response.info === "Already monitored") { console.log("Warning: ID: " + response.payload.id + " Node is already monitored"); } else { console.log("OK: ID:" + response.payload.id + " Node is added"); } }); } }); req.write(JSON.stringify(payload)); req.end();}
function addNodesFromFile(fileName) { console.log("Reading file and adding nodes...");
const rl = readline.createInterface({ input: fs.createReadStream(fileName), crlfDelay: Infinity }); let header; rl.on("line", line => { if (header == null) { header = line.split(","); } else { const properties = line.split(","), data = { name: null, monitoringProvider: null }; header.forEach((name, ix) => { if ((properties[ix] || "") !== "") { if (name === "monitoringProvider") { data.monitoringProvider = properties[ix]; } else { data.name = properties[ix]; } } }); sendRequest(data); } });}
addNodesFromFile(nodesFile);
Data file
data.csv
name,monitoringProvider
vm-test-0066.ac.acme,remoteProbe1
vm-test-0084.ac.acme,remoteProbe1
cam-0015.ac.acme,remoteProbe1
cam-0057.ac.acme,remoteProbe1
How It Works
The script:
- Opens
data.csv - Reads the first row as the header
- Creates a node payload for each row
- Sets the
monitoringProviderproperty - Sends a POST request to:
/api/rest/2/nodes
- Prints whether each node was added or already monitored
When to Use This Pattern
Use this pattern when nodes should immediately be assigned to a specific monitoring provider.
Examples:
- all devices in a branch office should be monitored by the branch probe
- all cameras in a building should be monitored by a local probe
- devices in an isolated network are reachable only from a remote probe
- overlapping private IP ranges require separation by site or address space
Inventory System Integration
A common REST API use case is synchronizing NetCrunch with an external inventory system.
External systems may include:
- CMDB
- IPAM
- asset inventory
- virtualization inventory
- cloud inventory
- provisioning database
- internal configuration portal
A synchronization script can:
- add missing nodes
- update node names
- update network addresses
- update custom fields
- assign device metadata
- set location or owner information
- assign monitoring provider
- disable monitoring for retired assets
- report mismatches between NetCrunch and the source inventory
Recommended synchronization pattern:
- Read source inventory
- Normalize source data
- Query NetCrunch for existing nodes
- Match records by stable identifier
- Prepare a list of changes
- Run in dry-run mode first
- Apply changes through REST API
- Log every changed object
- Report skipped or failed records
Do not blindly overwrite NetCrunch data from an external inventory system unless that system is authoritative for the given field.
Script Design Guidelines
Use deterministic scripts when the workflow is known.
Good candidates for scripts:
- nightly inventory synchronization
- bulk node import
- custom field update
- maintenance mode
- scheduled report extraction
- repeated configuration cleanup
- one-time migration task
Poor candidates for scripts:
- tasks requiring investigation
- ambiguous remediation decisions
- comparing many possible causes
- workflows where the next step depends on interpretation
- workflows requiring operator conversation
For those cases, MCP and AI-assisted agents may be more appropriate.
Handling Rate Limits
NetCrunch applies rate limiting to REST API requests.
Default limit:
100 requests per 60 seconds
The same limit also applies to MCP Server calls.
Rate limiting protects:
- NetCrunch Server responsiveness
- monitoring performance
- API availability for other integrations
- event and configuration database access
- system stability
If a REST script reaches the limit, improve the script before changing the server configuration.
Recommended improvements:
- avoid repeated calls for the same object
- cache already retrieved data
- filter requests by view or group
- batch operations when possible
- add delay between requests
- process large imports in chunks
- avoid full-Atlas scans unless necessary
The limit can be changed in:
server.cfg.yml
Changing the default value is not recommended.
Troubleshooting REST API Scripts
Authentication Fails
Check:
- API key is correct
- API key has not expired
- API key is passed in the x-api-key header
- API key is tied to an active NetCrunch user
- connection restriction allows the script host
- request is sent to the correct NetCrunch Server
Access Is Denied
Check:
- the linked user can access the target object
- the linked user has rights to perform the requested operation
- the API key is not read-only for write operations
- the target object belongs to an accessible view or organization
Node Is Not Added
Check:
- required node fields are present
- network address or name is valid
- node is not already monitored
- monitoring provider exists
- device type or OS monitor type value is correct
- request body is valid JSON
CSV Import Fails
Check:
- CSV header names match expected API property names
- custom fields already exist in NetCrunch
- values do not contain unescaped commas
- empty values are handled correctly
- file encoding is valid
- each row has the expected number of columns
Script Reaches Rate Limit
Check:
- script is not looping unexpectedly
- requests are not repeated for the same node
- bulk import size is reasonable
- retries do not happen too aggressively
- delay or batching is used
Best Practices
- Use REST API for known procedures
- Scripts are ideal when the workflow is predictable and repeatable.
- Use dedicated API users
- Avoid using personal administrator accounts for automation.
- Use separate API keys
- Create one key per script, application, or integration.
- Use read-only keys when possible
- Write access should be limited to scripts that actually modify NetCrunch.
- Prefer IDs for automation
- Names and addresses can change. IDs are more stable.
- Prefer HTTPS
- Use HTTPS when sending API keys over the network.
- Use the x-api-key header
- Avoid passing keys in URLs.
- Add dry-run mode
- For bulk updates, show planned changes before applying them.
- Log changes
- Keep script logs for imports, updates, and failed operations.
- Handle failures explicitly
- Do not ignore non-200 responses.
- Respect rate limits
- Avoid unnecessary polling and repeated full scans.
- Validate source data
- Do not import malformed or incomplete inventory records.
- Review event logs
- NetCrunch logs API usage with application name, user, and source IP.
Related Topics
See also:
MCP and AI-Compatible Automation
Use the NetCrunch MCP Server to connect MCP-compatible tools to selected NetCrunch management operations. MCP is intended for controlled automation and assistant-assisted administration, not for unrestricted data discovery or building external monitoring systems on top of NetCrunch.
NetCrunch includes an MCP Server for integration with tools that support the Model Context Protocol.
MCP provides a standard way for AI-capable clients and automation tools to call NetCrunch management operations. It uses the same API keys, user permissions, access restrictions, and request limits as the NetCrunch REST API.
MCP does not introduce a separate security model or a separate data access layer.
The NetCrunch MCP Server is not a general query API. It does not expose NetCrunch as a database, monitoring data warehouse, topology engine, or dashboard backend. It provides access to defined management operations through an MCP-compatible interface.
When to Use MCP
Use MCP when you want to connect NetCrunch with an MCP-compatible assistant, automation client, or development tool.
Typical use cases include:
- checking selected node properties
- enabling or disabling monitoring for known nodes
- updating custom fields
- adding or removing tags
- adding notes to nodes
- adding or removing nodes from views
- performing controlled maintenance operations
- assisting operators with known administrative tasks
MCP is useful when the external tool already supports MCP and the operation can be expressed as a controlled NetCrunch management action.
Example requests:
Disable monitoring for web-server-01 for two hours.
Set the Location custom field on srv-app-03 to Warsaw Office.
Add a note to firewall-01 saying that firmware was updated.
Add node 10.10.5.20 to the Branch Office Routers view.
These examples refer to known objects and defined actions. They are appropriate for MCP.
When to Use REST API Instead
Use the REST API for deterministic integrations and repeatable automation.
REST API is usually better for:
- scheduled scripts
- CMDB synchronization
- inventory updates
- migration tools
- repeatable maintenance workflows
- bulk operations
- integrations where the client knows exactly which operation to call
Example:
A nightly script updates node ownership and location fields from a CMDB export.
This is better implemented as a script using the REST API because the workflow is fixed and repeatable.
What MCP Is Not Designed For
MCP should not be used as a replacement for NetCrunch dashboards, reports, topology views, or monitoring data access.
Avoid using MCP for:
- high-volume polling
- broad Atlas scans
- unrestricted data discovery
- historical performance data extraction
- rebuilding NetCrunch views in an external system
- creating an external monitoring portal
- querying all monitoring data as if NetCrunch were a database
- replacing NetCrunch UI workflows with a separate product layer
If a workflow requires large-scale data extraction or reporting, use dedicated NetCrunch reports, exports, UI views, or purpose-built integrations.
MCP and AI Assistants
An AI assistant connected through MCP can help with selected administrative tasks.
For read-only use, an assistant can help inspect known objects and explain returned information. For write-capable use, the assistant can prepare or execute controlled changes using the permissions of the API key.
Recommended read-only tasks:
- show selected node properties
- check monitoring state
- review custom field values
- list tags assigned to a node
- check whether a node belongs to a view
- summarize returned information for an operator
Recommended write-capable tasks:
- disable monitoring for approved maintenance
- re-enable monitoring after maintenance
- update selected custom fields
- add or remove tags
- add a node note
- add or remove a node from a view
For write-capable assistants, start with narrow permissions. Use confirmation before applying changes that affect monitoring state, node configuration, view membership, or multiple objects.
Controlled Automation Pattern
For write operations, MCP clients should follow a controlled workflow:
- Identify the target object.
- Read the current state when needed.
- Prepare the requested change.
- Show the planned action to the user.
- Ask for confirmation when the change is not read-only.
- Execute the operation.
- Read back the result when practical.
- Report the final state.
Example:
User:
Disable monitoring for web-server-01 until 18:00 and add a maintenance note.
MCP client:
1. Reads the current monitoring state of web-server-01
2. Prepares the disable-monitoring operation
3. Adds the maintenance note
4. Executes the change after confirmation
5. Reads back the monitoring state
6. Reports the result
This pattern reduces accidental changes and keeps the operator in control.
Synchronization Use Cases
MCP can support synchronization workflows when the external system provides known objects and explicit values.
Examples:
- update node custom fields from a CMDB
- apply tags from an asset inventory
- add known nodes to views based on location or ownership
- add notes from an external ticketing system
- disable monitoring during approved maintenance windows
Synchronization should use stable identifiers whenever possible, such as:
- node ID
- node name
- IP address
- DNS name
- view path
- policy name where applicable
Avoid open-ended synchronization workflows that attempt to discover and reconstruct the whole NetCrunch configuration externally.
Permissions
MCP uses NetCrunch API keys.
The API key determines:
- which NetCrunch user context is used
- which objects are visible
- which operations are allowed
- whether write operations are permitted
- whether the key is restricted by source address
- whether the key has expired
Recommended practices:
- create a dedicated user for MCP access
- grant only the permissions required by the integration
- use read-only API keys for inspection-only scenarios
- avoid using administrator accounts
- restrict API keys by source address where possible
- set an expiration date for temporary integrations
- review activity after enabling MCP access
Do not connect an unrestricted administrator API key to an experimental AI assistant or external automation tool.
Rate Limiting
MCP requests are rate-limited to protect the NetCrunch Server from excessive tool calls.
AI-capable clients may generate several tool calls for a single user request. Rate limiting helps prevent accidental loops, inefficient workflows, and excessive load on the server.
When an MCP client reaches the request limit, reduce the number of calls or add throttling on the client side.
Recommended improvements:
- avoid repeated reads of the same object
- cache known object identifiers
- operate on selected nodes or views
- avoid broad scans
- batch predictable work where possible
- retry with backoff after rate-limit errors
Security Guidelines
Before enabling MCP access:
- decide what the MCP client is allowed to do
- create a dedicated API key
- start with read-only access when possible
- restrict access to required views, nodes, or organizations
- avoid shared administrator credentials
- keep rate limiting enabled
- require confirmation for write operations
- review API activity during initial use
MCP clients should be treated like external API clients. They can simplify work, but they should not receive broader access than the user or workflow requires.
REST API or MCP
Use REST API when:
- the workflow is fixed
- the task is scheduled
- the client is a script or service
- exact repeatability matters
- the integration performs bulk synchronization
- the developer knows which endpoint to call
Use MCP when:
- the client already supports MCP
- the workflow is operator-assisted
- the task is interactive
- the operation uses known NetCrunch objects
- the assistant should help prepare or explain selected actions
- the integration benefits from a standard AI-tool interface
REST API remains the preferred option for deterministic automation.
MCP is an additional compatibility layer for MCP-capable clients and assistant-assisted administration.
Summary
The NetCrunch MCP Server provides AI-compatible access to selected NetCrunch management operations.
It is intended for controlled automation, synchronization, and assistant-assisted administration. It is not intended to expose NetCrunch as a general monitoring engine, database, reporting layer, or external product platform.
Use MCP for practical administrative actions. Use REST API for repeatable integrations. Use NetCrunch UI, dashboards, reports, and future built-in AI features for deeper product-aware analysis and monitoring workflows.
REST API Reference
List below contains all requests currently available in REST API, divided into scopes
Node
Get List of Monitoring Packs of The Node
Set Network Services Parameters
Set Monitoring Engine Parameters
Delete Sensor (deprecated)
View and Folder
Enable IP Network View Monitoring
Disable IP Network View Monitoring
Monitoring Pack and Map Policy
Get Monitoring Pack Properties
Get List of Nodes of the Monitoring Pack
Add Node to the Monitoring Pack
Remove Node From The Monitoring Pack
Credentials
Get Names of Defined credentials
Remove Credentials (deprecated)
Notes
Update or add note using reference ID
NetCrunch MCP Server
NetCrunch exposes its REST API as an MCP (Model Context Protocol) server, allowing AI assistants and LLM-based tools to discover and call the NetCrunch management API programmatically.
The MCP server shares the same API keys, rate limits, and backend handlers as the REST API — every tool maps 1-to-1 to a REST endpoint.
Endpoints
The MCP server supports two transports. Both are available at the /api/mcp path.
| Transport | Method | URL | Description |
|---|---|---|---|
| Streamable HTTP | POST |
/api/mcp |
Modern single-endpoint transport (recommended) |
| SSE | GET |
/api/mcp/sse |
Opens a Server-Sent Events stream |
| SSE messages | POST |
/api/mcp/messages?sessionId=… |
Sends JSON-RPC messages to an SSE session |
Streamable HTTP is stateless — each request creates a fresh MCP session. This is the simplest integration path and works with all MCP clients.
SSE is a stateful fallback for clients that require a persistent connection. The client first opens /api/mcp/sse to get a session ID, then sends requests to /api/mcp/messages?sessionId=<id>.
Authentication
Every request must include a valid NetCrunch API key. The MCP server accepts the key in any of these locations (checked in order):
| Method | Example |
|---|---|
Authorization header |
Authorization: Bearer YOUR_API_KEY |
x-api-key header |
x-api-key: YOUR_API_KEY |
| Query parameter | ?api_key=YOUR_API_KEY |
API keys are created in the NetCrunch Administration Console under User Profiles → API Keys. The key determines which nodes and operations the caller can access — the same security context applies to both MCP and REST.
Requests without a valid API key receive an error response:
{ "error": "No API Key" }
Rate Limiting
MCP requests share the same per-API-key token bucket as the REST API. Default limits (configurable in server.cfg.yml):
| Setting | Default |
|---|---|
| Max requests per window | 100 |
| Window length | 60 seconds |
When the limit is exceeded, tool calls return an error result. Unused tokens refill continuously.
Client Configuration
Claude Desktop
Add to claude_desktop_config.json:
{ "mcpServers": { "netcrunch": { "url": "https://YOUR_SERVER/api/mcp", "headers": { "Authorization": "Bearer YOUR_API_KEY" } } } }
Cursor / VS Code (Copilot)
Add to MCP settings (.cursor/mcp.json or VS Code MCP config):
{ "servers": { "netcrunch": { "url": "https://YOUR_SERVER/api/mcp", "headers": { "Authorization": "Bearer YOUR_API_KEY" } } } }
Python (mcp client library)
from mcp import ClientSession from mcp.client.streamable_http import streamablehttp_clientasync with streamablehttp_client( "https://YOUR_SERVER/api/mcp", headers={"Authorization": "Bearer YOUR_API_KEY"} ) as (read, write, _): async with ClientSession(read, write) as session: await session.initialize()
# List available tools tools = await session.list_tools() # Call a tool result = await session.call_tool("nodes.getProperties", { "node": "10.0.0.1", "properties": "Name,Address,OverallState" }) print(result)
Available Tools
The MCP server exposes 50 tools organized into 8 groups. Each tool corresponds to a REST API endpoint and accepts the same parameters. Required parameters are marked with *.
Nodes (19 tools)
Manage monitored nodes — add, delete, read/write properties, control monitoring, manage tags, network services, sensors, custom fields, and child nodes.
| Tool | Description | Parameters |
|---|---|---|
nodes.add |
Add a new monitored node | networkAddress, name, type |
nodes.delete |
Delete a monitored node | node |
nodes.getProperties |
Get node properties | node, properties |
nodes.getProperty |
Get a single node property | node, property* |
nodes.setProperties |
Set multiple node properties | node |
nodes.setProperty |
Set a single node property | node, property* |
nodes.setMonitoring |
Enable or disable monitoring | node, value* (on/off), disabledFrom, disabledUntil, reset |
nodes.addNetworkService |
Add a network service monitor | node, name*, protocolId, timeout, repeat, additionalRepeat, monitoringTime, overrideSuppressing, param |
nodes.setNetworkServiceParams |
Update service monitor params | node, service*, protocolId, timeout, repeat, additionalRepeat, monitoringTime, overrideSuppressing |
nodes.deleteNetworkService |
Remove a service monitor | node, service* |
nodes.setSensorParams |
Configure sensor monitoring | node, sensor*, enabled, monitoringTime, credentials |
nodes.setMonitoringEngineParams |
Configure monitoring engine | node, engine*, enabled, monitoringTime, credentials |
nodes.setCustomFieldValue |
Set a custom field value | node, field*, value |
nodes.deleteCustomField |
Delete a custom field | node, field* |
nodes.addChild |
Add a child node | node, child* |
nodes.deleteChild |
Remove a child node | node, child* |
nodes.addTag |
Add a tag | node, tag* |
nodes.deleteTag |
Remove a tag | node, tag* |
nodes.removeTags |
Remove all tags | node |
The node parameter accepts a node ID (numeric), name, IP address, or DNS name.
Views (9 tools)
Manage network views and view folders.
| Tool | Description | Parameters |
|---|---|---|
views.add |
Create a new view | name*, parent |
views.addFolder |
Create a new folder | name*, parent |
views.delete |
Delete a view | map |
views.getProperties |
Get view properties | map, properties |
views.getProperty |
Get a single property | map, property* |
views.setProperties |
Set multiple properties | map |
views.setProperty |
Set a single property | map, property* |
views.addNode |
Add a node to a view | map, node* |
views.removeNode |
Remove a node from a view | map, node* |
The map parameter accepts a view ID, name, or path.
Policies (6 tools)
Manage monitoring policies.
| Tool | Description | Parameters |
|---|---|---|
policies.getProperties |
Get policy properties | map, properties |
policies.getProperty |
Get a single property | map, property* |
policies.setProperties |
Set multiple properties | map |
policies.setProperty |
Set a single property | map, property* |
policies.addNode |
Add a node to a policy | map, node* |
policies.removeNode |
Remove a node from a policy | map, node* |
Notes (5 tools)
Manage notes attached to nodes.
| Tool | Description | Parameters |
|---|---|---|
notes.add |
Add a note to a node | node, subject, text, label (red/green/blue/yellow), due, refid, category, archived |
notes.get |
Get a note by reference ID | node, refid* |
notes.getProperty |
Get a single note property | node, refid*, property* |
notes.update |
Update a note | node, refid*, subject, text, label, due, category, archived |
notes.updateProperty |
Update a single note property | node, refid*, property* |
Interface Settings (5 tools)
Manage network interface display settings.
| Tool | Description | Parameters |
|---|---|---|
interfaceSettings.set |
Set interface settings | node, ifIndex*, name, speed, note |
interfaceSettings.get |
Get interface settings | node, ifIndex |
interfaceSettings.getAll |
Get all interfaces | node |
interfaceSettings.delete |
Delete interface settings | node, ifIndex |
interfaceSettings.deleteAll |
Delete all interface settings | node |
Credentials (2 tools)
List credential types and profiles (admin only).
| Tool | Description | Parameters |
|---|---|---|
credentials.getTypes |
List credential types | — |
credentials.get |
Get credentials by type | type* |
IP SLA (2 tools)
| Tool | Description | Parameters |
|---|---|---|
ipsla.get |
List all IP SLA operations | — |
ipsla.getNode |
Get IP SLA for a node | node |
NQA (2 tools)
| Tool | Description | Parameters |
|---|---|---|
nqa.get |
List all NQA operations | — |
nqa.getNode |
Get NQA for a node | node |
Example Conversations
Once connected, an AI assistant can use NetCrunch tools naturally:
User: Show me the properties of the node at 10.0.0.1
Assistant calls
nodes.getPropertieswith{ "node": "10.0.0.1" }and returns the result.User: Disable monitoring on the web server for the next 2 hours
Assistant calls
nodes.setMonitoringwith{ "node": "web-server", "value": "off", "disabledUntil": "2026-04-26T20:00:00Z" }.User: Add a note to node 42 saying the firmware was updated
Assistant calls
notes.addwith{ "node": "42", "subject": "Firmware updated", "text": "Firmware was updated to latest version.", "label": "green" }.
Error Handling
Tool call errors are returned as MCP error results with isError: true and a JSON text content block:
{ "content": [{ "type": "text", "text": "{\"error\":\"Authentication Failed\"}" }], "isError": true }
Common error conditions:
| Error | Cause |
|---|---|
No API Key |
Request missing authentication |
Authentication Failed |
Invalid or expired API key |
Node not Found |
The specified node does not exist |
Access Denied |
API key lacks permission for this operation |
Too Many Requests |
Rate limit exceeded — wait and retry |
Reference
The reference lists of NetCrunch resources, operations and definitions.
Alerting Actions
NetCrunch allows many alerting actions such as notifications, remote execution, creating tickets in help desk systems, sending messages to other systems, and NetCrunch configuration actions.
Actions are executed in response to an alert, and they organized in sequences by Alert Action Lists.
Alerts are grouped to make finding the desired Action easier. Groups refer to their purpose and are gathered into tabs in the Add Action window.
Basic Actions
Desktop
- Play Sound
- The action plays a sound file (in .way format) as the response to an alert.
- Display Desktop Notification Window
- The action shows a small notification window above the Windows Task Bar.
Diagnostics
These actions can extend alert information, so when the next action would be sending an email notification, it will also contain diagnostic action results.
- Add Traceroute to Alert Message
- Executes traceroute to determine the point where the remote connection is broken.
- Add Network Services Status to Alert Message
- Adds the status of all node network services to the alert information.
Notify
- Notify user or group
- This is a recommended notification to be used. It automatically chooses the right users and profiles depending on defined user profiles and groups.
Simple
- SMS via Email
- SMS via GSM
- This is simple, but use it only in case of a single administrator or a straightforward notification scheme. You can directly specify the notification type (email or SMS) and the recipient.
To use the SMS notification via GSM phone, you need to connect and set up the GSM phone or modem to the NetCrunch Server.
add the list of supported modems and phones (reference)
Control Actions
Controlling Computers
NetCrunch can execute various control actions remotely. Event descriptions can be passed to action when needed in XML format. By default, actions can be executed on a node causing an alert or on any other node from the Atlas.
Windows
- Run Windows Program
- The program can be copied to and executed on the desired machine.
- Run Windows Script
- Run the script that can be copied to and executed on the desired machine by a given scripting host.
- Terminate Windows Process
- Terminates the process by its name.
- Start, Stop, Pause Windows Service
- Perform control action on a given service. (Specify service by its name or select from the list of running services).
Unix Family
- Run SSH Script
- Run script using SSH connection can be copied to and executed on the desired machine by a given scripting host.
Any OS
- Shutdown Computer
- Shutdown remote node (it can be executed on every supported OS).
- Restart Computer
- Restart remote node (it can be executed on every supported OS).
Other
- Set SNMP Variable
- Set a given SNMP variable on a remote node (you can use the MIB database or enter OIDs manually).
- Wake on LAN
- Send "Wake on LAN" packet, which can turn the device power on if supported by the device.
NetCrunch Actions
- Change Node Monitoring State
- Enable/disable node monitoring. Action can disable node monitoring indefinitely or only for a specified time.
- Change Node Monitoring Time
- Change node monitoring time.
- Modify Node Issue List
- Turn alerts into issues—set or clear issues on a node.
- Modify Node Custom Field
- Change or clear node custom field.
- Set Issue
- Add the issue upon an alert to the node issue list.
- Clear Issue
- Clear issue related to alert (created by set issue) from the node issue list.
Integrations
This section allows integration with the external service desk, productivity, and notification systems:
Notification
- Amazon SNS
- send notification via Amazon Simple Notification Service,
- Campfire
- send a message into Campfire Chatroom,
- IFTTT
- send a web request to IFTTT service
- Microsoft Teams
- send Microsoft Team Message
- MQTT
- publish a message to MQTT Broker
- Pushover
- send a notification to devices using Pushover,
- Ryver
- send notification via Ryver
- Slack
- send notification via Slack
- send a tweet or direct message
SMS Gateway
- Clickatell
- send SMS/text message via Clickatell service
- MessageBird
- send SMS/text message via MessageBird service
- SMSEagle
- send SMS/text message via SMSEagle Gateway
Service Desk
- AlertOps
- create or close alert in AlertOps source
- Asana
- Create, update or close the Asana task
- Connectwise
- Create or close the ConnectWise Service Desk ticket
- Flowdock
- Create or close the ticket in Flowdock source
- Freshdesk
- Create or close the Freshdesk ticket
- Freshservice
- Create or close the Freshservice ticket
- JIRA
- Create or comment on JIRA Service Desk ticket
- JiTBiT
- Create or close the JitBit ticket
- LiveAgent
- Open or resolve the LiveAgent ticket.
- Mojo Helpdesk
- Create or close the Mojo Helpdesk ticket
- Ops Genie
- Create or close the OpsGenie alert
- PagerDuty
- Create or resolve the PagerDuty incident
- Trello
- Create or update Trello card
- Zendesk
- Create or close ZenDesk ticket
Logging
Local
Actions execute on the NetCrunch Server machine. You can specify the desired message format for the action.
write to file or append?
- Write to File
- Action appends information about the alert at the end of the selected file. The file must be accessible from NetCrunch Server. The file will be created if it does not exist.
- Write to Windows Event Log
- Writes information about the alert into specified Windows Event Log.
- Write to Unique File
- Writes detailed information about the alert to unique per each alert file.
Remote
- Send SNMP Trap
- Sends SNMP trap with given alert information. To understand NetCrunch SNMP traps by the remote SNMP manager, export NetCrunch SNMP MIB and import/compile in that manager. See Integrating NetCrunch with other NMS.
- Send Syslog Message
- Sends syslog message using defined message form to remote syslog server.
- Trigger Webhook
- Sends HTTP POST request to a given URL with event data as payload. Supports XML and JSON data format.
Please note that while selecting the Write to File and Write to Unique File actions on a remote Administration Console, the Filename or Directory fields require providing the path manually. The Select Directory or Open File icons are grayed out.
Scripts
Linux
- Shutdown Linux Machine
- Reboot Linux Machine
- Restart Linux SNMP Daemon
- Mount CD-ROM
- Dismount CD-ROM
Windows
- Start SNMP Service
- Stop SNMP Service
Monitoring Packs
NetCrunch Monitoring Packs allow efficient management of monitoring settings. You can use them to create monitoring policies by setting node filters. They can also be assigned manually to the node (or multiple nodes using multiselection). Currently, the program includes more than 223 ready-to-use Monitoring Packs for monitoring devices, applications, and operating systems.
!! Remove details - nobody can read this. Use Active Directory as an example. You can keep those packs with up to 3 conditions.
!! There is no description that is Automatic, which is not - this is important.
If this is an automatic pack, describe the filtering condition.
for example:
Operating System must be Windows Server.
Monitored network services list contains LDAP.
The monitoring pack can monitor all nodes, a single Atlas view (a group of nodes), or a single node.
A Monitoring Pack consists of two types of elements: alerts (alerting rules) and data collectors (used for reports).
Each alert is defined by the condition describing the event, and the action is taken when the alert occurs. By default, all alerts are written to the NetCrunch event log. Data collectors define performance metrics that should be collected to present data on dashboards and reports. Each data collector entry can have a schedule to generate reports automatically. If a schedule is not set, data are collected, and reports are available on demand.
NetCrunch includes many predefined Monitoring Packs with associated events and reports.
The monitoring pack created by the user (or duplicated from the pre-created monitoring pack) can be freely converted between static and dynamic mode. Use the option in the top right corner in Monitoring Pack settings to covert)
Predefined Monitoring Packs
Operating Systems
Windows
There are several Monitoring Packs that you can use for monitoring different aspects of your Windows environment.
- Active Directory (automatic)
- Observe Replication and Service errors. Watch Active Directory services status. The operating System must be Windows Server. Monitored network services list contains LDAP, LDAPS
- Active Directory Signs of Compromise
- Monitors for security events signaling potential security breach related to security event pattern, replay attack or audit policy change that need to be investigated
- Basic Windows Monitoring (automatic)
- Provides basic workstation monitoring. Observe processor utilization, memory usage, and free disk space.
Operating System must be Windows Workstation.
Simplified Monitoring must be Disabled. - CPU (automatic)
- Observe CPU utilization.
- DHCP Server
- Observe the DHCP Server service, its errors, and warnings.
- Disk (automatic)
- Observe Windows Disk performance.
- Distributed File System (DFS)
- Observe Windows Event Log for specific DFSR warnings and errors.
- Distributed File System Replication (DFSR)
- Monitor the Windows event log for specific DFSR warnings and errors, and collect performance and capacity data of namespaces and replicated folders.
- DNS Server (automatic)
- Observe DNS errors. Watch DNS network service and Windows service status.
The operating System must be Windows Server.
The monitored network services list contains DNS. - End of Life (automatic)
- Observe Windows system End of Life status.
- Hyper-V Hypervisor
- Observe the overall processor utilization of the Hyper-V environment, and watch its Windows services' status and the Hypervisor state.
- Hyper-V/VM
- Track operational status, guest processor usage, guest memory, virtual processor usage, as well as any failure events.
- Memory (automatic)
- Observe system memory utilization.
- Network (automatic)
- Provides network utilization reports. Observes outbound traffic
- Network Services Health (automatic)
- Watch for DHCP, DNS, WINS, Remote Access, or other TCP/IP errors.
- Processes (Windows)
- It allows for collecting information for processes.
- Security Audit
- Watch for Account events, login, and password problems.
- Terminal Services
- Watch the number of Active and Inactive sessions.
- Windows Print Queue
- Monitor any print queue errors reported by the device.
- MSMQ - Window Message Queuing
- Monitors Windows message queue
- NVIDIA Quadro GPU Dedicated to NVIDIA Quadro graphic cards.
- Alerts about high GPU, Memory, and Bus usage. Shows metrics also from the Core Clock, Fan Speed, Temperature, and Power Consumption.
- RDP Services
- Monitors status of Windows Services related to RDP, additionally shows the number of sessions on a given machine.
- Basic Windows Authorization Monitoring
- Generating an alert in case of multiple failed login events happening over a short time, when a login attempt was made with explicit credentials or with special privileges assigned.
In specific cases, you may need to modify Windows security monitoring packs to prevent alert floods in environments with high numbers of privileged users' logons. - Basic Windows GPO Monitoring
- Tracking changes in Group/Domain/Authorization Policies, generating an alert when such an event occurs.
In specific cases, you may need to modify Windows security monitoring packs to prevent alert floods in environments with high numbers of privileged users' logons.
Linux
Monitor the most important Linux performance indicators such as processor and memory utilization, free disk space, and available swap, and create a Linux Server Report.
- Linux Status (automatic)
- Observes connection and authentication errors of Linux monitor.
- CPU (automatic)
- Observe CPU utilization.
- Disk (automatic)
- Observe disk utilization, swap available, and the volumes' free space.
- Memory (automatic)
- Observe Available Memory.
- CPU (SNMP)
- It requires SNMP to be enabled. Observe CPU Load and % CPU Time.
- Disk (SNMP)
- It requires SNMP to be enabled. Observe disk utilization, swap available, volumes' free space, and physical disk I/O operations.
- Memory (SNMP)
- It requires SNMP to be enabled. Observe system memory utilization.
- Network Traffic (Linux)
- It allows for collecting network traffic data.
- Processes (Linux)
- It allows for collecting information for processes.
macOS
Monitor the most important macOS performance indicators. Such as processor and memory utilization, and free disk space, and then create a macOS Report.
- macOS Status (automatic)
- Observes connection and authentication errors of macOS monitor.
- CPU (automatic)
- Observe CPU utilization.
- Disk (automatic)
- Observe disk utilization and volume of free space.
- Memory (automatic)
- Observe Available Memory.
- Processes (macOS)
- It allows for collecting information for processes.
BSD
Monitor the most important BSD performance indicators, such as processor and memory utilization, and free disk space, and create a BSD Report.
- BSD Status (automatic)
- Observes connection and authentication errors of BSD monitor.
- CPU (automatic)
- Observe CPU utilization.
- Disk (automatic)
- Observe disk utilization, and volume free space.
- Memory (automatic)
- Observe Available Memory.
- Network Traffic (BSD)
- It allows for collecting network traffic data.
- Processes (BSD)
- It allows for collecting information for processes.
Solaris
Monitor most important Solaris performance indicators such as processor and memory utilization, and free disk space, and create Solaris Report.
- Solaris Status (automatic)
- Tracks connection and authentication errors of Solaris monitor.
- CPU (automatic)
- Observe CPU utilization.
- Disk (automatic)
- Observe disk utilization, volumes' free space, and swap available
- Memory (automatic)
- Observe Available Memory
- Network Traffic (Solaris)
- It allows for collecting network traffic data.
- Processes (Solaris)
- It allows for collecting information for processes.
- Solaris (SNMP)
- It requires SNMP to be enabled. It monitors CPU Load, Load Check, Minimum Swap Space, and Swap Space.
VMware
- VMware/ESXi Status (automatic)
- Tracks connection and authentication errors of VMware/ESXi monitor.
- CPU (automatic)
- Observe CPU utilization.
- Datastore (automatic)
- Monitor Datastore free space.
- End of Life (auto)
- Monitor End of Life status of the VMware system (automatic)
- ESXi/VM State (automatic)
- It monitors the health state, power state, and configuration issues of the ESXi host
- Hardware Status (automatic)
- Alerts on hardware sensor state.
- Memory (automatic)
- Observe Memory Usage.
Cisco
- CPU (automatic)
- Monitor Processor utilization.
- Memory (automatic)
- Monitor the Memory Used and Buffer Allocation Failures.
Other
- Nutanix Hypervisor
- Monitors cluster state, storage capacity, processor, and memory of the Hypervisor
- Nutanix Storage
- Monitors disk space, container, and storage pool capacity
- Nutanix VM
- Gathers data and alerts about memory and processors related to Nutanix virtual machines
- SNMP Status (automatic)
- Observes connection and authentication errors of SNMP monitor.
Hardware
APC
- APC ATS (SNMP)
- Monitors Input/Output frequency, voltage, current, and power. Alerts when there are problems with the power supply.
- APC Netbotz Rack Monitor (SNMP)
- informs when one of the multiple events occurs, like smoke detection, temperature too high, and others.
- APC PowerChute (SNMP) (automatic)
- Monitor battery status, capacity, and temperature.
SNMP must be Enabled.
The device class must be UPS.
The manufacturer must be APC. - APC UPS Hardware (SNMP) (automatic)
- Shows statistics about frequency, voltage, load, and current. Alerts when the remaining runtime of the battery is low.
Asustor
- Asustor System (SNMP)
- Checks processor and memory utilization. Gathers information about system and CPU temperature, fan, and network.
- Asustor Disk (SNMP)
- Monitors free space and disk temperature.
- Asustor UPS (SNMP)
- Monitor battery status, charge level, and voltage.
Cisco
- Cisco Hardware Health (automatic)
- Checks if the hardware components (eg, fan or power supply) are working properly.
Device Class must be Hardware Router or Switch.
The manufacturer must be Cisco. - Cisco ADSL (SNMP)
- Creates a report about ADSL statistics.
- Cisco Nexus
- Monitor processor and memory usage, and various hardware statuses of the Cisco Nexus 6000 series devices.
- Cisco ASA VPN Tunnels
- Creates reports about VPN traffic and Session Statistics.
- Cisco UCS Unified Computing System (SNMP) (automatic)
- Monitors many useful parameters related to the blade, chassis, and physical discs.
- Cisco Unified Communications Manager
- Monitors the Call Manager status and unregistered devices in the network.
- Cisco Meraki Cloud Controller (SNMP)
- Shows a collection of statistics from interfaces. Detects and informs about many important events like rogue DHCP servers, client IP conflicts, cable errors, and others
- Cisco ADSL (SNMP)
- Creates a report about ADSL statistics.
- Ironport (SNMP)
- Monitors system, disk, and queue utilization of the email security appliance.
CyberPower
- CyberPower Environment(SNMP)
- Shows and informs about values gathered from humidity and temperature sensors
- CyberPower PDU (SNMP)
- Monitors Power Supplies and Rack PDU
- CyberPower UPS (SNMP)
- Monitors information about battery, temperature, and UPS power parameters
- Cisco UCS - PSU and Fan (SNMP)
- Checks fan, fan module, and PSU statuses.
Dell
- Dell EMC Isilon OneFS (SNMP)
- Collects information about overall health, driver, and license. It also monitors network usage, disk usage, and CPU utilization.
- Dell EqualLogic Disk (SNMP)
- Collects information about logical and physical disks, such as availability, read/write latency, or health status
- Dell EqualLogic Health (SNMP)
- Monitors the health of an array member, providing information about components' statuses.
- Dell iDRAC (SNMP)
- Monitors health condition information about particular components of the Dell system.
- Dell OpenManage (SNMP)
- Monitor various statuses and temperatures of particular components of the Dell system.
Eaton
- Eaton ATS (SNMP)
- Shows input/output voltage and frequency values, as well as statuses about e. g—internal failure or overload.
- Eaton UPS (SNMP) (automatic)
- Monitors basic parameters such as battery state, remaining runtime, or temperature. It is dedicated to UPS devices manufactured by Eaton.
Fortinet
- Fortigate VPN
- Monitors VPN traffic and session statistics
- Fortinet Generic (SNMP)
- Monitors fan, power supply, and temperature sensors
- Fortinet FortiSwitch (SNMP)
- Monitors processor, memory, and disks
- Fortinet FortiGate
- Observes CPU utilization, memory usage, and the disk's free space.
Hillstone
- Hillstone Firewall - System (SNMP)
- Alarms when something is wrong with HA, fan, or power supply. Tracks memory, CPU, and active session usage.
- Hillstone Firewall (SNMP)
- Monitors multiple metrics from Hillstone Firewall such as IPSec attack count, online users, and dropped packets.
HP/HPE
- Aruba Access Point (SNMP)
- Monitors processor, memory, Access Point state, and Radio parameters
- HP Blade System Health (SNMP)
- Monitors health status and shows readings from fans, fuses, and temperature sensors.
- HP ProCurve (automatic)
- Monitors CPU utilization, memory, and hardware sensors state. Creates the Performance Report.
- HP ProLiant Disk (SNMP)
- Gathers physical and logical disk statistics, monitoring their statuses.
- HP ProLiant Network Adapter (SNMP)
- Collects network interface statistics such as in/out traffic, errors, and in/out frames.
- HP Systems Insight Manager (SNMP)
- Monitor overall system health condition, hardware sensors status, and interface status.
- HPE Nimble Storage - Disk Array (SNMP)
- Shows and informs about RAID, array, as well as disk parameters and issues
- HPE Nimble Storage - Network (SNMP)
- Monitors links and Fibre Channel links.
- HPE Nimble Storage - System (SNMP)
- Monitors fan, power supply, temperatures, controllers, and SAS links
HW group
- HW group - Damocles (SNMP)
- Shows values gathered from Damocles sensors. It can display information from metrics related to water, gas, electricity, and others.
- HW group - Poseidon (SNMP)
- Shows values gathered from Poseidon sensors. It can show information about e.g., temperature and humidity.
- HW group - PWR (SNMP)
- Designed to monitor external M-Bus meters on HWG-PWR devices
- HW group - STE (SNMP)
- Collects values of temperature and humidity from external sensors
- HW group - STE2 (SNMP)
- Similar to the 'HW group - STE (SNMP)'. This contains a report that allows displaying values from temperature and humidity sensors
- HW group - WLD (SNMP)
- Reports about water leak detections
IBM
- IBM IMM (SNMP)
- Monitors hardware parameters and health condition information related to the components of the system.
- IBM System x Disk (SNMP)
- Shows the status of the physical drive and volume.
- IBM System x System Health (SNMP)
- Monitors the health status of the memory and system. It also shows information about temperature, voltage, and fan speed.
Juniper
- Juniper EX Switches HealthMon (SNMP)
- Monitors important Juniper switches performance indicators such as CPU, memory, and file storage utilization.
- Juniper NetScreen (SNMP)
- Monitor CPU utilization, memory, and session usage. It also checks the temperature and status of hardware components.
- Juniper Sensors (SNMP)
- Monitors control plane CPU utilization and memory.
- Juniper SRX (SNMP)
- Monitors important Juniper SRX performance indicators such as packet forwarding memory, routing engine CPU usage, temperature, session count, etc.
Nasuni
- Nasuni Filer - System Health (SNMP)
- Monitors updates, license usage, temperature, errors from Power Supply, and RAID.
- Nasuni Filer - Statistics (SNMP)
- Monitors transmitted and received bits/second, cache, and the number of connected clients.
- Nasuni Filer - Volume (SNMP)
- Informs about antivirus policy violations and state. Monitors also Volume state.
NetApp
- NetApp Disk Usage
- Monitors disk usage and creates reports for LUN, Free Files, INodes, Deduplication, and Free Disk Space.
- NetApp I/O Operation Reports
- Creates reports about multiple NetApp I/O.
- NetApp System Health
- Monitors overall system health condition and hardware sensors status. Creates Disk and System Health reports.
- NetApp Traps
- Contains SNMP trap events definitions.
Pulse Secure
- Pulse Secure Hardware
- Monitors MAG application blade temperature, RAID, fans, power supplies statuses
- Pulse Secure Network Interfaces
- Alerts if any interface goes down
- Pulse Secure System
- Health Alerts about high usage of CPU, memory, and disk, swap and log file capacity
- Pulse Secure Users
- Monitors counters related to web, cluster, and concurrent meeting users
QNAP
- QNAP Disk (SNMP) (automatic)
- Monitors the status of the physical drive and volume. It also shows information about temperature and free space.
- QNAP System Health (SNMP) (automatic)
- Collects information about CPU usage, available memory, temperature, and fans.
Rittal
- Rittal CMC III (SNMP)
- Monitors the overall condition of the CMC system, CMC unit, and state of sensors connected to it.
- Rittal CMC TC (SNMP)
- Monitors the overall condition of the chassis and all devices connected to CMC PU.
Riverbed
- Riverbed SteelFusion (SNMP)
- Monitors counter related to CPU, Connections, and Bandwidth
- Riverbed SteelHead (SNMP)
- Monitors counter related to CPU, Connections, and Bandwidth
Ruckus
- Ruckus - System Health (SNMP)
- Alerts when memory usage or CPU utilization is high. Informs when services are disabled.
- Ruckus ZoneDirector (SNMP)
- Monitors many performance and security-related events like rogue AP detection, malicious attack detection, and more.
- Ruckus SmartZone (SNMP)
- Monitors multiple performance-related events like CPU, Memory, Disk, and License usage.
Socomec
- Socomec Modulys UPS (SNMP)
- Informs about environmental, battery, and UPS issues. Monitors also Input and Output phases.
- Socomec UPS (SNMP)
- Gathers data about Input/Output Current, Frequency, and Voltage. Informs about battery problems.
SonicWall
- SonicWall System Health (SNMP)
- Shows CPU utilization, RAM utilization, and connection cache entry usage.
- SonicWall VPN Traffic (SNMP)
- Shows the number of encrypted/decrypted packets and bytes per second and incoming/outcoming fragmented packets per second.
Synology
- Synology Disk (SNMP)
- Gathers information about disk temperature and monitors the status of volume/disks.
- Synology System Health (SNMP)
- Monitors the system's health status - temperature, memory, and processor usage.
Tripp Lite
- Tripp Lite - Cooling (SNMP)
- Monitors temperature sensor, compressor pressure, and other parameters
- Tripp Lite - PDU (SNMP)
- Monitors output and input power parameters
- Tripp Lite - UPS (SNMP)
- Monitors temperature, battery, input, and output power parameters
ZyXel
- Generic ZyXEL IES Series (SNMP)
- Includes monitoring of chassis, system parameters, voltage, temperature, and fan status.
- Generic ZyXEL ZyWALL (SNMP)
- Includes monitoring of CPU, Memory utilization, blocked packets, VPN tunnels, and network interfaces.
- ZyXel USG Flex (SNMP)
- Alerts when Memory, Flash, or CPU usage is high. Gathers information from VPN.
Other
- Alcatel OmniSwitch (SNMP)
- Monitors CPU utilization, IO utilization, memory, and switch temperature.
- Allied Telesis AlliedWare Plus (SNMP)
- Shows and informs about memory, processor, PSU, fans, and temperature parameters and issues
- Axis Video (SNMP)
- Alerts about failures and other undesirable events. Monitors also temperature.
- Barracuda Spam and Virus Firewall
- Creates reports about Inbound Messages, Outbound Messages, and other statistics.
- Buffalo Terra Station (SNMP) (automatic)
- Monitors memory usage, CPU utilization, PSU status, and failover status. Shows information about new updates, errors, and warnings on the device.
- Carel (SNMP)
- Monitors multiple metrics (e.g. temperatures, fans, humidity) and alarms when something is wrong.
- Checkpoint VPN
- Shows and informs about the status and state of the VPN tunnel, decryption errors
- Cybernetics iSAN Series Storage (SNMP)
- Alerts when the temperature of the CPU or chassis is high. Informs also about the disk, power supply, and array issues.
- Eltek (SNMP)
- Checks battery, fan, and rectifier. Gathers information about voltage, current, and temperature.
- Emerson Liebert UPS (SNMP)
- Monitors UPS status and the remaining time on the battery
- Extreme Networks (SNMP)
- Monitors basic counter of the switch such as temperature, power supply CPU, and memory
- F5 Local Traffic Manager
- Monitors important SNMP traps and variables of the Traffic Manager. The event will be generated if there is a problem with temperature, fan speed, power supply, CPU and memory usage, DOS or Brute Force attack is detected, or one of many monitored traffic statistics is higher than usual.
- Fujitsu iRMC (SNMP)
- Shows information about hardware, such as fan speed, temperature, power consumption, CPU speed, battery discharging, and errors.
- Generic UPS (SNMP) (automatic)
- Monitors basic parameters, such as battery state, remaining runtime, or temperature. It is intended for all UPS devices which support RFC 1628 Generic UPS MIB.
- GUDE Expert PDU Energy 8341-Series (SNMP)
- Informs about environmental issues like possible condensation or temperature/humidity fluctuations. It also monitors power and energy parameters.
- Huawei (SNMP)
- Monitors CPU, battery, and memory status
- InterSeptor Pro Environment (SNMP)
- Gets and collects temperature and humidity data measured by InterSeptor Pro device.
- Janitza Power Quality Analysers UMG Series
- Monitors measurements of voltage, current, and frequency. Gathers data about active energy and reactive energy, power, real power, and reactive power.
- Lenovo EMC System Health (SNMP)
- Monitors RAID and disk health states of NAS storage.
- Link Aggregation (automatic)
- Monitors changes of switch/router ports.
- Meinberg LANTIME (SNMP)
- Checks NTP and receiver synchronizations, and monitors the health of equipment such as fans, power supply, and more.
- Mikrotik Router (SNMP)
- Gathers information from temperature sensors. It also shows information about voltage, current power, fan speed, network interfaces, and others.
- NetGear ReadyNAS System Health (SNMP)
- Monitors essential parameters such as disk temperature, volumes' free space, and fan speed.
- Palo Alto Networks Firewall (SNMP)
- Monitors useful parameters on Palo Alto Firewalls such as SSL proxy utilization, sessions, processor, power usage, etc.
- Riedo Networks E3METER (SNMP)
- Monitors information about temperature, humidity, and power parameters.
- RMON Traffic (SNMP)
- Shows a collection of statistics per particular Ethernet interface on a device that can provide traffic data via RMON.
- Server Technology Sentry 3 (SNMP)
- Monitors power and environment parameters
- SMSEagle (SNMP)
- Monitors overall condition of the SMSEagle device, signal strength, messages statistics, processor, memory, disk, interfaces, network services, and any other parameters
- Sophos XG Firewall (SNMP)
- Alerts about high usage of CPU, Memory, Disk, and Swap.
- Tycon Systems TPDIN Monitor Web V2
- Monitors voltages and currents on 4 on-board relays, the internal and external temperature of the device
Applications
Anti-Virus Software
-
Below, you can find a list of Monitoring Packs that you can add to check if the following Anti-Virus application is running on the monitored node. Antivirus status monitoring is one of the key aspects to check on Windows workstations and laptops.
-
- Adaware Antivirus
- Adaware Total Security
- Avast Premium Security
- AVG AntiVirus
- AVG Internet Security
- Avira
- BitDefender
- BitDefender Parental Control
- BullGuard Antivirus
- BullGuard Internet Security
- BullGuard Premium Protection
- Comodo Antivirus and Internet Security
- Comodo Endpoint Protection
- eScan
- ESET
- F-Secure
- G Data Antivirus
- G Data Internet Security
- G Data Total Security
- K7 AntiVirus Premium
- K7 TotalSecurity
- Kaspersky Home Products
- Kaspersky Security Center
- Kaspersky Endpoint Security
- Kaspersky Small Office Security
- Malwarebytes
- McAfee Total Protection
- Norton
- Panda Dome
- Sophos Home
- Sophos Endpoint Protection
- Symantec Endpoint Protection Client
- Symantec Endpoint Protection Server
- Trend Micro
- VIPRE
- Webroot SecureAnywhere
- Windows Defender
- Windows Defender (2016-2019)
- ZoneAlarm
Microsoft
- Exchange 2007-2010 Mailbox Access Server
- Monitor key Windows services and performance counters of the Mailbox Access Server.
- Exchange 2007 - 2010 Transport Access Server
- Monitor key Windows services and performance counters of the Transport Access Server, it contains SMTP availability report.
- Exchange 2013 Client Access Role
- Monitor key Windows services and performance counters of the Client Access Server. It contains reports about IMAP4, SMTP, UMCallRouter, and POP3.
- Exchange 2013 Mailbox Role
- Monitor key Windows services and performance counters of the Mailbox Access Server.
- Exchange 2016-2019
- Monitor key Windows services and performance counters of Exchange servers and related services
- IIS
- Monitor key IIS performance metrics such as ASP requests, IIS Private Bytes, and monitor the Windows event log for ASP, SMTP, and WWW errors.
- MS Dynamics NAV Server
- Monitor key Windows Services of the MS Dynamics NAV Server.
- MS Project Server 2013
- Monitor key Windows Services of the MS Project Server 2013.
- MS Project Server 2016
- Monitor key Windows Services of the MS Project Server 2016.
- MS SQL Server 2012-2019
- Monitor key performance metrics, Windows and Network Services, MS SQL event log warnings, and errors. It contains several reports such as:
Processor Bottleneck Analysis, Disk Usage and Performance, Memory Usage Analysis, MS SQL Server 2012-2017 CPU Performance, MS SQL Server 2012-2017 Memory, MS SQL Server 2012-2017 I/O Report - SharePoint 2010
- Watch the status of SharePoint Windows Services, the number of rejected requests, cache size, and the number of queued requests.
- SharePoint 2013
- Watch the status of SharePoint Windows Services, the number of rejected requests, cache size, and the number of queued requests.
- SharePoint 2016
- Watch the status of SharePoint Windows Services, the number of rejected requests, cache size, and the number of queued requests.
Other
- AdRem NetCrunch Server
- Monitor Windows Services of the NetCrunch Server.
- Apache Server (automatic)
- Reports: Detailed Report of Apache servers.
Apache Monitoring Engine must be enabled. - APC Windows Events
- Monitor specific APC Windows event log events.
- ARCserve
- Monitor specific ARCserve Windows event log events.
- Atlantis ILIO (SNMP)
- Alerts when defined thresholds for CPU, Disk, Load, or Memory usage are exceeded.
- Avaya Modular Messaging Server
- Monitor key Messaging Server Windows Services.
- CiscoWorks Lan Management
- Monitor key Lan Management Windows Services.
- Citrix Netscaler (SNMP)
- Alerts if CPU/Memory usage is too high or there is too many server/client connections
- Citrix Xen App 6.0 Server
- Monitor key Citrix Xen App Server Windows Services.
- Java Application Server (SNMP)
- Generate a report about memory, threads, and classes usage.
- Kentix AlarmManager - Environment (SNMP)
- Monitors environmental parameters like temperature, humidity, and dew point. Alerts about exceeding the threshold.
- Oracle 11.2.0
- Monitor key performance metrics such as buffer cache miss ratio, log buffer, Windows Services, and others.
- pfSense (SNMP)
- Collect statistics about firewall packet rates, alerting if pfSense is not running or the number of dropped packets is worrying
- Squid 3 (SNMP)
- Monitor cache hit ratio and CPU utilization.
- Stormshield (SNMP)
- Monitors the status of the firewall.
- Veeam Backup and Replication Server
- Monitor key Veeam Backup and Replication Server Windows Services.
- Veritas Backup Exec Server
- Monitors key Veritas Backup Exec Server Windows Services
- Veritas Backup Exec Agent
- Monitors key Veritas Backup Exec Agent Windows Services
- Veritas Backup Exec Events
- Monitors specific Veritas Backup Exec Windows Event Log events
- Veritas NetBackup Exec Server
- Monitors key Veritas Backup Exec Agent Windows Services
- Veritas NetBackup Exec Client
- Monitors key Veritas NetBackup Exec Client Windows Services
Global
Settings for all nodes in the Atlas.
- Bandwidth (automatic)
- Monitor node bandwidth usage from the node's perspective
- Correlations
- Allows defining alerts correlating multiple alerts from multiple nodes.
- Global Flows
- Here you can specify NetFlow thresholds for your entire network.
- NetCrunch
- Generates an event when a node was added or deleted from Atlas.
- NetCrunch Audit
- Enables tracking user access to NetCrunch Console and failed login attempts to the Console.
- NetCrunch Self Monitor
- Tracks various NetCrunch Server parameters and triggers notifications to administrators if any problems occur.
- NetCrunch Server
- Tracks various NetCrunch Server services and triggers notifications to administrators if any problems occur.
- Network Traffic (SNMP) (automatic)
- Collects data for traffic statistics and Top Charts.
- Node Status (automatic)
- Generates an event when the node state changes to up or down.
This monitoring pack is automatically assigned to all nodes in the Atlas. - Physical Connections (automatic)
- Monitors change of node linkage.
- Port Status
- Track status of all monitored ports
- Service Status (automatic)
- Monitors connection reliability and network services status.
This monitoring pack is automatically assigned to all nodes in the Atlas.
Glossary of Terms
Alert
Alert - the condition being watched for action to react to potential danger or get attention.
Site (previously Address Space)
Site is a group of private networks usually behind NAT. When two locations use the same private network address, they create two distinct address spaces.
Atlas Node View
Atlas Node View shows various aspects of the group of nodes in the Network Atlas and consists of multiple pages such as nodes, maps, dashboards, and others.
Cloud Service
Cloud Service represents a single cloud service status and metrics.
Composite Status
Composite Status is an atlas node representing an aggregated state of the group of other status objects. The status depends on group type, which can be critical, redundant, or influential.
Event
Event is a thing that happens or takes place, especially one of importance.
Event Suppression
Event Suppression is the technique of preventing false alarms caused by network intermediate connection failure.
Leading Service
Leading Service is a network service designed to be checked as the only service when the Node is DOWN.
Network Atlas
Network Atlas is a central database containing all your network data. It's organized by the hierarchy of the Atlas Node Views.
Node
Node is a single address network endpoint (interface).
Node Monitoring Template
Node Monitoring Template is a settings node. Its sole purpose is to provide settings to other nodes. When parameters change, they propagate automatically to associated nodes.
Monitoring Provider
Monitoring Provider is a software component responsible for monitoring a part of the Atlas. NetCrunch Server and Monitoring Probe are examples of monitoring providers.
Monitoring Dependencies
Monitoring Dependencies reflect network connections and allow for preventing false alarms and disabling monitoring of unreachable network components.
Monitoring Engine
Monitoring Engine is a software component responsible for the specific type of monitoring.
Monitoring Issues
Monitoring Issue is a problem related to the monitoring process, like missing credentials or improper response from the device.
Monitoring Pack
Monitoring Pack is a group of performance parameters and events monitored and collected for the reports.
Monitoring Sensor
Monitoring Sensor is a software module focused on monitoring a single object, service, or device (web page, file, folder, query, etc.).
Remote Probe
Remote Probe is Monitoring Probe now.
Monitoring Probe
Monitoring Probe is a monitoring agent software installed on a separate machine to increase the monitoring capabilities of the server or monitor a remote location within isolated networks otherwise not accessible by the primary monitoring system. It connects to the parent system.
REST Receiver
REST Receiver is a passive monitored node that only waits for data to be received for it. It doesn't need to know the sender's IP address so that data can come from nodes directly connected to the Internet, such as mobile devices, kiosks, cameras, or hardware sensors.
Threshold
Threshold is the limit or a boundary point that must be exceeded or dropped below to trigger some response action.
Performance Triggers
Performance Trigger generates an event upon the condition set on the performance counter value.
Response Processing Time
Response Processing Time is the estimate of the service's time spent generating the response. It's calculated by subtracting an average PING RTT from the service response time.
Sensors
AD Replication
Checks a Windows Domain Controller (DC) for replication errors
Apache Web Server
Monitors Apache Server connections and internal performance metrics
Basic HTTP
Sends basic HTTP requests (GET, HEAD, or POST) and validates response code or content.
Basic IPMI
This sensor monitors system temperatures, voltages, and fan rpm using IPMI.
Basic SIP
This sensor monitors the connectivity to the SIP server and can test the session initiation.
Cloud Email Services (Gmail, Outlook, OAuth2)
NetCrunch includes dedicated sensors for monitoring cloud-hosted email services such as Gmail and Outlook. These sensors offer the same diagnostic functionality as traditional email sensors but use OAuth 2.0 authentication instead of basic credentials.
Cloud Drives
Monitor Cloud Drive and Google Drive
Data Email
This advanced sensor can trigger alerts by filtering emails and parsing email's subject and body for metrics and statuses.
Data File
Loads data from a file using one of the predefined file formats or by using Data Parsers. It also Alerts on retrieved metrics and status values.
Data Receiver
This sensor allows receiving data from an external source - a remote agent using REST API.
Dell EMC
Monitors the overall health status and power consumption and the filesystem, LUN, and pool parameters of a Dell EMC storage device using the Unisphere® Management REST API.
DELL iDRAC IPMI
This sensor is preconfigured to monitor a Dell iDRAC device over IPMI.
Device Config
Tracks changes to device configurations and stores multiple backups of device configurations using the telnet or SSH protocol.
DICOM C-Echo
The sensor monitors the availability of DICOM-capable devices by sending C-ECHO requests.
DNS Query
Sends a query to the DNS to check the name or address and validates the response. It allows checking any DNS record response.
Docker Container
Monitors CPU, Memory, Interface utilization, and status of a Docker container, using REST.
Email Round-Trip
Tests email server by sending an email to the mailbox and reading it back. It can measure the time to send and receive the message, availability, and authentication.
File
Checks remote file presence, size, and modification.
File Shares
Monitors Windows file share state.
Folder
Checks folder content, authentication settings, and other conditions.
Generic IPMI
This sensor monitors system temperatures, voltages, fan rpm, current, altitude, etc. using IPMI.
GitLab Cloud Sensor
This sensor monitors the latest build/job status on a specific project in the GitLab cloud repository.
HP iLO IPMI
This sensor is preconfigured to monitor an HP iLO device over IPMI.
HPE 3PAR StoreServ
Allows monitoring of the performance of HPE 3PAR StoreServ storage using Web Services API.
IBM IMM IPMI
This sensor is preconfigured to monitor an IBM IMM device over IPMI.
ICMP Jitter
The sensor sends a series of ICMP packets and calculates Jitter based on responses.
INodes
This sensor monitors free inodes on Unix/Linux-based systems.
IP Camera
The sensor gets a snapshot image from the camera and checks the connectivity.
IPMI Log
This sensor monitors the IPMI System Event Log(SEL)
LDAP Authentication
Checks the user authentication process via LDAP which is used by directory services such as MS Active Directory.
Mailbox
The sensor monitors the email mailbox. It checks the authentication process and mailbox usage. It can track counters such as 'Number of Messages', 'Size of Largest Message', and 'Size of Messages'.
MS SQL Server Instance
Allows monitoring of a specific SQL server instance without duplicating the monitoring pack. You can add a sensor for each SQL server instance with a single click.
NAKIVO Backup and Replication
The sensor integrates with NAKIVO Backup & Replication by polling its REST API. It collects repository state, backup storage usage, and job/task statistics to monitor system health and performance.
NetApp ONTAP
Allows monitoring of NetApp storage components' health and performance using ONTAP REST API.
NetApp SANtricity
Allows monitoring of NetApp storage components' health and performance using SANtricity REST API.
Palo Alto Firewall
monitors IPSec site-to-site VPN tunnels configured on the Palo Alto device. By default, the sensor alarms when the state of any tunnel becomes non-active. It also allows for the monitoring of specific tunnels.
Pending Reboot Sensors
This sensor checks a Windows machine for pending reboots using WMI.
Pingdom Sensor
This sensor monitors the status of the selected Pingdom check and response time of a monitored webpage
Printer
The sensor monitors printer status, alarms, and properties using SNMP. The device must support the Printer MIB.
Process
Monitors process instances.
Process Group Summary
Monitors the summary values of multiple processes (process group).
RADIUS
The sensor checks the user authentication process and validates the response from the RADIUS server.
Registry
This sensor uses WMI to monitor Windows Registry objects specified by path. It alerts you when a subkey or value list is changed.
Registry Counters Sensor
This sensor uses WMI to get and monitor numeric values from the Windows Registry. It can utilize thresholds in NetCrunch to monitor various scenarios
Remote Ping
Checks connectivity from a remote system by running Ping remotely.
Remote SSH Script
The sensor executes the script on the remote system and processes the output through the selected Data Parser to get alerts, metrics, or status objects.
REST HTTP
Sends HTTP request and validates response code or response content.
Script
The sensor executes the script locally on the NetCrunch Server machine and processes the output through the selected Data Parser to get alerts, metrics, or status objects.
SQL Query:Data
Allows executing a query returning multiple rows. Columns can be used as a source for metrics. These metrics enable the triggering of various threshold alerts.
SQL Query:Object
Allows executing a query returning a single row. It can also be used with an empty query for checking database authentication and connectivity. The row can represent an object, and columns represent object properties. The sensor allows setting an alert on object properties status.
SSH Remote Ping
Checks connectivity from a remote system by running Ping remotely.
SSL Certificate
Checks the SSL certificate expiration date and the certificate properties.
Static Status
This sensor has a customizable status.
System Uptime
Checks the device's uptime.
TACACS+
Checks the server connectivity and tries to authenticate a specified user. Sensor requires - TACACS server shared secret - used for data encryption and user (with password) to authenticate
Text File
Checks file content, authentication parameters, file size, change time, file presence, and more.
Text Log
Monitors text log entries. For FTP or HTTP, the whole file is downloaded. Otherwise, it will be analyzed remotely and incrementally.
Time Difference
Checks the time difference between a remote machine and the reference machine (NetCrunch Server or NTP server).
Traceroute
The sensor traces the route to the node's IP address and measures the number of hops.
Veeam Backup and Replication
This sensor allows monitoring of the state of all Veeam jobs and the capacity of backup repositories.
vSphere vCenter Server
The sensor will automatically switch detected ESXi machines to vCenter mode. Features such as active alarms and configuration issues are available in vCenter mode only.
WBEM Data
The sensor allows selecting the WBEM class and instance key to retrieve object properties. It allows setting alerts on performance counters only.
WBEM Object
The sensor monitors a specific WBEM object without writing a WQL query. In addition to the WBEM Data sensor, it requires you to set an instance value. The sensor also allows setting alerts on performance counters and treats each object's numeric property as a counter. Additionally, it allows for tracking status properties.
WBEM WQL Query: Object
It allows retrieving data of specific CIM Class instances by writing a WQL query. The query must point to only a single instance.
Web Page
Checks web page contents and page loading process. The sensor loads the page just like a regular browser, with all resources (images and scripts)—the sensor alerts on-page content, authentication errors, or resource load errors.
WMI Battery
Monitors the internal battery or UPS connected to the computer system. Alerts when AC power is lost, the battery level is low or discharged, and on battery hardware error.
WMI Perfmon
Provides Perfmon interface through WMI. Allows selecting objects and counters like in regular Perfmon - no cryptic WMI classes needed
Windows Configuration - Hardware, Software, Hotfixes
NetCrunch can collect information about Windows machines' hardware, installed software, and hotfixes.
Windows Task Scheduler
Monitors the status of Windows Task Scheduler tasks. It allows triggering an alert if task configuration has changed or if a task has not run as scheduled.
Windows Update
The sensor monitors the status of Windows updates on a computer and triggers alerts when updates have not been installed.
WMI Data
Allows selecting WMI class and instance key to retrieve object properties (no query).
WMI HDD Health
Monitors HDD Health with S.M.A.R.T technology.
WMI Object
Monitors specific WMI objects without the need to write a WQL query.
WQL Query:Object
It allows querying WMI for an object and triggering alerts on the object state.
NetCrunch Privacy Policy
This policy explains how NetCrunch interacts with monitored systems and data within the end user’s environment, as well as optional internet-dependent features
Last Updated: April 11, 2025
1. Scope of This Policy
This privacy policy applies to NetCrunch, an on-premises or self-hosted network monitoring platform deployed and managed by end users (businesses or organizations) to monitor their infrastructure.
AdRem Software does not access, store, or process data monitored by NetCrunch.
2. Data Monitoring and Access
NetCrunch accesses data solely for operational monitoring purposes, as configured by the end user (Art. 6 Sec. 1 Letter b GDPR).
Monitored Data Includes:
- Infrastructure Metrics: Server health, network latency, device performance, and application logs (Art. 6 Sec. 1 Letter b GDPR).
- Email Services: Metadata (e.g., timestamps, headers) from test or real user mailboxes via IMAP4/SMTP (Art. 6 Sec. 1 Letter b GDPR). This metadata is processed locally within the end user’s NetCrunch deployment and is not transmitted to AdRem Software or used by AI features.
- Cloud/On-Prem Resources: VM status, API metrics, and security group configurations (Art. 6 Sec. 1 Letter b GDPR).
No personal user data or sensitive content from the monitored environment is stored by NetCrunch or AdRem Software. The only exception is voluntarily transferred data files for technical support or program diagnostics, which constitute consent for processing such data (Art. 6 Sec. 1 Letters a and b GDPR).
3. Data Residency and Control
- On-Prem/Self-Hosted Deployment: All monitored data resides within the end user’s infrastructure. NetCrunch can operate in air-gapped networks with no external connectivity.
-
Optional Internet Connectivity:
- License Management: Periodic license validation communicates with adremsoft.com; air-gapped deployments use offline license activation.
- Version Updates: Checks for software updates via adremsoft.com (optional). The update installation is initiated by the end user. It is not initiated automatically by NetCrunch.
4. Optional Services
The following services are disabled by default, except for bug reports:
a. NetCrunch Connection Cloud (NCC)
- Purpose: Securely relay encrypted data streams between NetCrunch Server, consoles, probes, or shared dashboards.
- Data Flow: Uses TLS 1.3 encryption via netcrunch.io.
- No monitored data is stored or processed in the cloud. AI Explain operates on abstracted alert context only and does not receive raw monitoring telemetry or full performance datasets.
b. AI-Enhanced Alert Explanation and Diagnostics Recommendations
- Purpose: Provides anonymized alert analysis via AI.
- Data Flow: Sends anonymized alert context to netcrunch.io, including the metric deviation relevant to the triggered alert condition.
- No node names, IP addresses, topology information, time-series history, credentials, or identifiers that could reveal the customer’s infrastructure are transmitted.
- AI processing is governed by AdRem Software’s data processing agreements and does not permit model training on customer alert data.
- The transmitted alert context is limited to technical metric deviation data and does not include identifiers of natural persons.
- The AI functionality provides contextual explanation and recommendations only and does not perform automated decision-making that produces legal or similarly significant effects.
c. Bug Report Data Push
- Purpose: Improve NetCrunch’s reliability and resilience by analyzing system performance.
-
Data Included:
- Anonymized performance data related to NetCrunch program health (e.g., error codes, resource usage).
- Name of the server where NetCrunch is installed (e.g., Server01).
- No data from the monitored environment (e.g., customer applications, network traffic).
- Default Setting: Enabled; users can opt out via NetCrunch settings.
- Local Storage: If disabled, logs remain on the end user’s NetCrunch Server.
5. Data Protection
NetCrunch employs several measures to safeguard data:
- Anonymization: Bug reports exclude identifiable details about monitored environments.
-
Encryption:
- External connections (license checks, NCC, AI alerts, bug reports) use TLS 1.3.
- Internal communication between NetCrunch components is encrypted.
-
Access Controls:
- Integrates with Active Directory for authentication.
- Configurable user permissions within NetCrunch.
- Air-Gapped Deployments: Full operation without internet connectivity.
6. Secure Configuration
NetCrunch supports compliance with enterprise security standards through:
- Isolated Environments: Deployable in air-gapped networks.
- APIs and Protocols: REST API, SNMP, and syslog integration for secure data exchange.
- Documentation:
7. Data Retention
-
Monitored Data: Retained temporarily within the end user’s deployment; retention periods are user-configurable.
-
Bug Reports at AdRem Software: Retained temporarily for diagnostics and software improvement.
- Local Bug Reports: Governed by the end user’s policies.
- Technical Support/Diagnostics Data: Retained only for necessary diagnostic purposes.
8. Roles and Responsibilities
End User (Organization):
Acts as the data controller, determining what is monitored and managing retention/deletion policies.
AdRem Software:
Provides the NetCrunch software and optional services (NCC, AI alerts). Acts as a data processor only when optional services are enabled and uses bug reports solely to improve functionality.
9. Updates to This Policy
AdRem Software may update this policy to reflect changes in NetCrunch functionality. End users will be notified via release notes or direct communication.
10. Contact Information
For questions about NetCrunch’s data handling, contact AdRem Software at sales@adremsoft.com.
Program Reference
Additional Programs
IP Tools - Remote Network Diagnostic
Overview of NetCrunch IP Tools as remote-capable diagnostic utilities available in both Desktop and Web Console, with flexible execution backends including server, probes, and NCC.

NetCrunch IP Tools is a collection of network diagnostic, subnet, and scanning tools designed to work consistently across Desktop Console and Web Console.
The key concept behind IP Tools in NetCrunch is execution context. These are not just local utilities. Each tool can be executed from different network perspectives, making them safe and extremely powerful in distributed environments.
Execution Modes and Backends
IP Tools can run in multiple modes depending on the console and backend selection:
-
Desktop Console
- Run locally on the administrator workstation
- Run remotely using NetCrunch Server
- Run remotely using any connected Probe
-
Web Console
- Run remotely using NetCrunch Server
- Run remotely using any connected Probe
When using NetCrunch Connection Cloud (NCC), IP Tools can be executed securely from anywhere in the world using only a web browser. No inbound firewall rules are required, and execution always happens inside your infrastructure, never on the client machine.
This model allows administrators to: - Test connectivity from the same network segment as monitored devices - Compare results from different probes or locations - Safely diagnose remote networks without VPN access - Avoid running diagnostic traffic from untrusted endpoints
Basic IP Tools
Ping
Tests the reachability of a host and measures round-trip time between the selected execution backend and the destination.
Options
- Timeout
- Time to wait for a reply before the packet is considered lost.
- Packet Delay
- Delay in seconds between consecutive packets.
- Data Size
- Size of the packet sent to the destination host.
Traceroute
Displays the network path and measures transit delays between the execution backend and the destination.
Options
- Max Hops
- Maximum number of intermediate hops.
- Timeout
- Time to wait for a reply before considering the packet lost.
- Refresh
- Interval in seconds for refreshing traceroute results.
- Resolve Names
- Resolves DNS names for discovered hops.
Wake on LAN
Sends a Wake-on-LAN magic packet to remotely power on a device.
The target device must have Wake-on-LAN enabled in BIOS or firmware.
The only required parameter is the MAC address of the target machine.
DNS Info
Queries a selected DNS server for detailed information about a domain name or IP address.
Options
- DNS Server
- DNS server used for the query.
- Port
- DNS server port. Default is 53.
Whois
Retrieves registration and ownership information for a domain or IP address. The tool automatically discovers the appropriate WHOIS servers and follows referrals if enabled.
Options
- Select Appropriate Server Automatically
- Allows manual WHOIS server selection when disabled.
- Follow Referrals
- Controls whether WHOIS referrals are followed.
Subnet Tools
DNS Audit
Scans a range of IP addresses and performs reverse DNS lookups, followed by forward verification to ensure address-to-name consistency.
Options
- Use Default System Server
- If disabled, a custom DNS server can be specified.
MAC Resolver
Scans an IP range to resolve MAC addresses and identifies network card vendors based on known prefixes.
Options
- Show Only Resolved Addresses
- Filters out unresolved IP addresses.
Subnet Calculator
Calculates subnet ranges, masks, usable address ranges, and broadcast addresses based on IP address and netmask input.
Scanners
Ping Scanner
Periodically scans a range of IP addresses to detect active hosts and performs reverse DNS lookups.
Options
- Timeout
- Time to wait for ping replies.
- Refresh
- Interval in seconds for repeating the scan.
Network Service Scanner
Detects well-known TCP and UDP services running on hosts within a given IP range.
Options
- UDP Timeout
- Timeout for UDP service detection.
- TCP Timeout
- Timeout for TCP service detection.
- Resolve DNS Names
- Resolves hostnames for detected services.
- List of Services
- Selects which services are included in the scan.
Open TCP Port Scanner
Scans IP ranges for open TCP ports without attempting protocol-level service detection.
Options
- Port Range
- Well-known ports, extended ranges, trojan ports, or custom ranges.
- Timeout
- Time to wait for TCP responses.
- Resolve Names
- Resolves DNS names for scanned hosts.
SNMP Scanner
Queries devices using SNMP to retrieve basic system information.
Options
- Port
- SNMP port. Default is 161.
- SNMP Protocol
- Supported versions are V1, V2c, and V3.
- Community (V1 and V2c)
- Community string used for authentication.
- User (V3)
- SNMPv3 user name.
- Authentication Protocol
- HMAC-MD5-96 or HMAC-SHA-96.
- Authentication Password
- Password for authentication.
- Encryption Type
- DES, 3DES, AES128, AES192, AES256.
- Encryption Password
- Password for encryption.
- Resolve Names
- Resolves DNS names for scanned hosts.
Performance Trend Viewer
NetCrunch Trend Viewer is a tool for analyzing historical monitoring data, comparing metrics, and identifying performance patterns over time.

NetCrunch Performance Trend Viewer provides a focused environment for exploring historical performance data collected by NetCrunch. It is intended for analysis and investigation rather than real-time monitoring, allowing administrators to understand how metrics behave over time and across different scopes.
The viewer works exclusively on stored data and does not influence live polling, alerts, or monitoring load.
Purpose and typical use cases
Trend Viewer is used to:
- Analyze historical behavior of monitored counters
- Compare the same metric across multiple nodes
- Identify peaks, averages, and anomalies
- Detect daily and weekly usage patterns
- Support capacity planning decisions
- Investigate incidents after they occur
It complements dashboards and alerts by answering what happened over time rather than what is happening now.
Data scopes
Trend Viewer supports multiple data scopes, depending on what is being analyzed.
Node metrics
This mode displays performance metrics collected for a single node.
Typical examples include:
- CPU and memory utilization
- Disk usage
- Interface traffic
- Service availability
- Application or process-level counters
Users select a node and one or more monitored metrics, which are rendered as time-based charts.
Compare metric for multiple nodes
This mode is used to compare the same metric across multiple nodes.
Typical scenarios:
- CPU usage across servers
- Bandwidth usage across network devices
- Availability of the same service across endpoints
All nodes are visualized consistently, making it easy to identify deviations and outliers.
Server data
This scope is used for unbound or global data that is not associated with a specific monitored node.
Examples include:
- NetCrunch Server performance metrics
- NetFlow summaries
- Internal processing and workload statistics
This data is primarily used to assess the health and load of the monitoring system itself.
Visualization modes
Trend Viewer automatically selects the most suitable visualization based on data type and context, with manual overrides available.
Time-based trends
Standard line or area charts showing metric values over time.
Supported features:
- Adjustable time ranges
- Min, max, and average aggregation
- Optional percentile display
- Custom Y-axis scaling
- Reference and threshold lines
This is the primary mode for performance investigation.
Distribution and heatmaps

Distribution views visualize how values are spread across time, typically grouped by day of week and time of day.
This mode is useful for:
- Identifying recurring load patterns
- Detecting peak usage windows
- Comparing business and off-hour behavior
Each cell represents an aggregated value for a specific time slice.
SNMP MIB Compiler
Manage, extend, and explore SNMP MIB definitions used by NetCrunch for SNMP-based monitoring.

Settings Monitoring SNMP SNMP MIB Data & Compiler
NetCrunch includes a large, pre-compiled SNMP MIB library with more than 9,500 vendor and standard MIB modules.
This library covers most common network and infrastructure devices out of the box, including Cisco, Nortel, 3Com, Alcatel, AudioCodes, and many others.
The SNMP MIB Compiler allows you to extend and maintain this library by compiling additional MIB files and inspecting their internal structure.
It is a server-side tool and should be launched from the Administration Console.
Why the MIB Compiler matters
SNMP monitoring depends on correct MIB definitions.
The compiler is not just a file importer, it is a diagnostic and inspection tool that lets you:
- Validate vendor MIBs before using them in production
- Inspect tables, variables, and traps in a structured form
- Understand how device-specific counters are organized
- Verify OIDs, access levels, data types, and valid ranges
This is especially useful when working with non-standard, deprecated, or poorly documented vendor MIBs.
Main capabilities
The SNMP MIB Compiler provides the following functionality:
- Compile and add new MIB modules to the NetCrunch MIB database
- Edit MIB source files before compilation
- Browse MIB contents using a hierarchical tree view
- Inspect variables, tables, table columns, and traps
- Display full object details, including OID, syntax, access, and description
- Create aliases for selected MIB objects
- Remove obsolete or unused MIB modules
- Search for objects across all loaded MIBs
- Sort and filter the full MIB module list
Browsing MIB objects
Once a MIB is compiled, you can browse its structure using the integrated MIB Browser:
- The left panel shows the MIB tree based on OID hierarchy
- Tables and table entries are clearly distinguished from scalar variables
-
Selecting an object displays its full definition, including:
- Object type (scalar, table, table column)
- Numeric OID
- Syntax and valid value range
- Access rights (read-only, read-write)
- Status (current, deprecated, obsolete)
- Original vendor description
This view is particularly helpful for understanding complex table-based MIBs and mapping indices to real-world device components.
Finding newly added MIBs and objects
After compiling a new MIB module:
- Use Ctrl+F to search for variables, tables, or traps by name
- Search works across the entire MIB database, not just the current module
- This makes it easy to verify that new definitions are available for sensors, SNMP views, or custom monitoring logic
Practical usage notes
- Compiling a MIB does not automatically create sensors or views
It makes the definitions available to NetCrunch - Deprecated objects are still shown for compatibility and analysis
- The compiler is intended for administrators and advanced users working with SNMP internals
Device Type Editor
I have added the topic, recognizing that Device List Editor is actually the Device Types List Editor, but there is still a question about what else should be added/changed here? What about the "Match String" field in the description? Should I change it to "Matching String"?
Settings Resources Device Type Manager
NetCrunch Device List Editor displays the list of all currently defined network device types recognized by the device group.
NOT implemented You can update the device types list directly from the AdRem Software Website:
- A new version of this list is periodically updated by AdRem based on information provided by NetCrunch clients.
- You can also send definitions that you have created to AdRem so that other NetCrunch users can update their device lists.
To update the device list, click the Update icon and follow the directions specified in the Device Update wizard.
Each device definition contains the following information:
- Icon
- Specifies the icon to be used by the device type in NetCrunch. The icon with this name and corresponding image must directly relate to one of the defined in the list in the Properties window of Node Settings (Node SettingsTypeDefault icon).
During network scanning, when NetCrunch recognizes a device based on its sysObjectID value, it uses the icon specified here to display it in the Network View window. - Name
- Specifies the name associated with the device in NetCrunch.
- sysObjectID
- Specifies the MIB object identifier of the device (based on the unique sysObjectID value).
If an incorrect value is entered, NetCrunch cannot discover or distinguish the device during the scanning process. - Description
- Specifies short information related to the device based on the sysDescr value.
Some devices may be recognized by NetCrunch solely based on their sysDescr value rather than their SysObjectID.
- Configuring Notification Services
Read to configure emails and text messages (SMS) with NetCrunch notifications.
- Device Config Sensor
The sensor enables tracking changes to device configurations and stores multiple backups of device configurations using the
telnetorsshprotocol. - Managing Device Type Definitions
- - Options: Notification
Operations Manual
Adding to NetCrunch
Adding Nodes to Monitoring
This topic describes how to add nodes to the NetCrunch monitoring setup. It covers accessing the Add Node popup and adding nodes via the Networking and Logical sections. Networking options include adding IP devices, scanning IPv4 subnets, searching AD containers, and importing from a file. Logical options include adding cloud services, composite status nodes, REST receivers, and monitoring probes.
NetCrunch allows you to efficiently add nodes to your monitoring setup through a straightforward interface. Here’s how to add a node to your monitoring:
Accessing the Add Node Popup
-
Locate the Add Button: You will find a blue plus button at the top of the NetCrunch application window. Click on this button to open a pop-up window.
-
Popup Overview: The pop-up window contains several icons, each representing elements you can add to your monitoring setup. To add nodes, focus on the first sections labeled "Device" and "Monitoring"
Device Section
The Device section provides four options for adding nodes:
Add IP Device
- Purpose: Add a single IP device to your monitoring setup.
-
How to Use:
- Click on the Add IP Device icon.
- A new window will open, prompting you to enter the device's DNS name or IP address.
- Select the appropriate probe that will monitor the node.
- Confirm and add the device to your monitoring.
Scan IPv4 Subnets
- Purpose: Scan and add multiple devices within specified IPv4 subnets.
-
How to Use:
- Click on the Scan IPv4 Subnets icon.
- A wizard will guide you through the process.
- Specify the subnets you want to scan.
- Optionally, enable SNMP to filter devices by type.
- Complete the wizard to add the detected devices to your monitoring.
Search AD Containers
- Purpose: Scan Active Directory (AD) containers for servers.
-
How to Use:
- Click on the Search AD Containers icon.
- Enter the AD container details as prompted.
- The scan will identify servers within the specified container.
- Add the found servers to your monitoring setup.
Import from File
- Purpose: Bulk import nodes from a CSV file.
-
How to Use:
- Click on the Import from File icon.
- Upload a CSV file containing a list of nodes.
- The server will process the file and add the listed nodes to your monitoring.
Monitoring Section
Monitoring Target
- Purpose: Add an element to monitor a new or existing network device. This element can be a service, sensor, monitoring device, or anything else.
-
How to Use:
- Click on the Monitoring Target icon.
- Search for the desired monitoring target
- Follow the wizard steps and add the new device if necessary
Cloud Service
- Purpose: Add a node representing a particular cloud service.
-
How to Use:
- Click on the Cloud Service icon.
- Enter the details of the cloud service you wish to monitor.
- Confirm and add the cloud service node to your monitoring.
Telemetry Node
- Purpose: Represent an external service or device for receiving counters and statuses.
-
How to Use:
- Click on the REST Receiver icon.
- Enter the details for the external service or device.
- Add the REST receiver node to your monitoring.
Monitoring Probe
- Purpose: Represent a monitoring probe service, typically remote, possibly behind a NAT and firewall, connected through the NetCrunch connection cloud.
-
How to Use:
- Click on the Monitoring Probe icon.
- Enter the probe details and configuration settings.
- Add the monitoring probe node to your monitoring setup.
Other
Network Atlas View
- Purpose: Add new atlas views such as node group, dashboard, diagram, or map.
-
How to Use:
- Click on the Network Atlas View icon.
- The wizard window will open
- Follow the wizard steps to add the desired type of view
Composite Status
- Purpose: Create a node that calculates the status of various elements (other nodes, services, sensors).
-
How to Use:
- Click on the Composite Status icon.
- Configure the elements and the logic for status calculation.
- Add the composite status node to your monitoring.
#### Monitoring Template
- Purpose: Create a template for monitoring specific types of devices.
-
How to Use:
- Click on the Monitoring Template icon.
- Create a new node or select the existing node to create a template from
- In monitoring settings, add desired elements and configure them accordingly
By following these steps, you can efficiently add various types of nodes to your NetCrunch monitoring setup, ensuring comprehensive network and service oversight.
Adding Targets to Monitoring
This topic provides instructions for adding monitoring targets to NetCrunch, including nodes, sensors, and data collectors. It covers configuring network services, operating systems, SNMP, virtualization platforms, and setting up alerting rules and dependencies. Additionally, it guides users on adding new nodes and using monitoring templates for efficient management.
In NetCrunch, various elements that can be monitored are called monitoring targets. Monitoring involves setting up alerts or data collectors regarding these targets, which may require adding sensors or enabling monitors such as SNMP or operating system monitors.
Adding Monitoring Elements to NetCrunch
Basic Elements of Monitoring
- Node: The fundamental monitoring element representing a device, server, or network element.
- Node Variants: Nodes can also represent probes, composite statuses, cloud services, or REST receivers.
- Sensors and Monitors: Nodes can have multiple sensors or monitors, such as SNMP, Apache, or operating system monitors (Windows, Linux, BSD, Solaris, macOS).
- Virtualization: Nodes can monitor ESXi, ESXi-VM, Hyper-V, and Hyper-V/VM.
- Monitoring Packs: These are sets of predefined alerting rules and data collection settings, similar to sensors but with shared settings.
- Alerting Rules: The smallest monitoring target used to trigger alerts based on conditions.
Data Collectors
Data collectors in NetCrunch are sets of performance counters that gather specific data from monitored targets. These collected metrics can be utilized in reports or for troubleshooting purposes. Data collectors are often added automatically when a specific report is enabled.
- Performance Counters: Data collectors gather performance counters from the target nodes. These counters include various metrics related to CPU, memory, disk usage, network activity, and other performance indicators.
- Automatic Addition: When a report is enabled, relevant data collectors are automatically added to the node. This ensures that all necessary performance data is gathered without requiring manual configuration.
- Usage: The collected data is used to generate detailed reports, which can be invaluable for troubleshooting issues within the network. Administrators can identify potential problems and take corrective actions by analyzing the performance metrics.
Adding an Element to an Existing Node
- Locate the Node: Find the node and open the
Node Settingswindow. You can find the node using the search button at the top right of the console window. - Navigate to Monitoring Tab: Go to the
Monitoringtab. -
Configure Monitoring Elements:
- The
Monitoringtab contains sections with small tiles. Each tile represents a monitoring element. - Header Section: Contains a plus button to add new elements, monitoring time, weekly monitoring schedule dropdown, dependency dropdown, and a menu button.
- Node Section: Includes tiles like Status Monitor, Bandwidth Sensor, Flows Sensor, SNMP Trap Sensor, Syslog Sensor, Web Messages, Node Status, Service Status, and Custom Alerts.
- Network Services Section: This section contains protocol checks for HTTP, HTTPS, FTP, SMTP, and more. Use the plus button to add services or the gear button to edit common settings.
- Operating Systems Section: Configure specific operating system monitors, including Custom Alerts.
- SNMP Section: Enable and configure SNMP monitoring packs like Interfaces and Custom Alerts.
- IPSLA/NQA Section: Add monitored operations if supported by the device.
- Monitoring Sensors Section: Add various sensors described on the NetCrunch website.
- The
Monitoring Dependency Dropdown
Dependencies ensure accurate and efficient monitoring by specifying relationships between nodes, avoiding false alerts, and understanding the impact of a node's failure.
- Monitoring Probe: Collect data from monitored nodes and communicate with NetCrunch directly or through NetCrunch Connection Cloud.
- Dependency Node: An intermediate node essential for monitoring other nodes, typically including routers, switches, or monitoring probes.
Specific Monitoring Sensors
- Bandwidth Sensor: This monitors the bandwidth usage of a given IP operating system, providing relevant information from the connected switch.
- Status Monitor: Determines the status of nodes and manages monitoring dependencies to reduce false alerts.
Status Monitor Features
Status Policy Selection
Determines criteria for when a node is considered DOWN or Critical. - Customize based on specific monitored elements. - Default policy marks a node as DOWN if no network service is responding.
Reducing False Alerts
- Suppresses 'Node DOWN' alerts when the parent dependency node is already DOWN.
- Ensures 'Service DOWN' alerts are accurate by verifying node response.
Windows-specific Sensors
These are tiles in the section called Windows. To configure the section, click on a specific tile or use the tile dropdown indicated by the vertical ellipsis button on the right side of the sensor tile.
Always present, but can be grayed out as not configured:
- Event Log: Monitors and collects entries from Windows Event Log.
- Services: Monitors and alerts on the state of Windows Services.
You need to add the following sensor using + on the right side of the section header:
- Hardware: Monitors hardware components like CPU, Memory, Disk, and Network.
- Software: Monitors installed software and alerts on changes.
- Hotfixes: Monitors installed hotfixes and alerts on changes.
Adding a New Node
To add a new node, click the plus button at the top right corner of the NetCrunch console. The interface is divided into three sections: Networking, Logical, and Monitoring.
Device
- Add IP Device: Add a node using a TCP/IP address or DNS name.
- Scan IPv4 Subnets: Scan the network for devices within specified IPv4 subnets.
- Search AD Containers: Search Active Directory containers.
- Import from File: Import devices from a file.
Monitoring
- Cloud Service: Add a cloud-based service without an IP address.
- Composite Status: Combine multiple statuses into one.
- REST Receiver: Add a service or node receiving data via REST API.
- Monitoring Probe: Add a node representing a monitoring probe.
Other
- Monitoring Target: Open a wizard to add a new monitoring target, such as a network service, monitoring pack, or sensor. The wizard can also create a new node if needed.
- Monitoring Template: Create a template node to configure and apply to other nodes later.
Available Network Services for Monitoring
NetCrunch supports monitoring network services, including PING, SNMP, SSH, HTTP, HTTPS, FTP, SMTP, DNS, and many more.
Following these guidelines, you can efficiently add and configure monitoring targets in NetCrunch, ensuring comprehensive network monitoring and alerting.
Adding Atlas Views
NetCrunch's Network Atlas offers four main view types: Graphical Data Views, Node Group Views, IP Network Views, and Folders. These views provide intuitive network visualization, dynamic node categorization, and automatic IP grouping. Adding new views is easy with a wizard or keyboard shortcut, enhancing efficient network monitoring and management.
NetCrunch offers a comprehensive Network Atlas, a complete database of monitored elements. The Network Atlas consists of various types of views organized into several sections, providing a detailed overview of the monitored elements. These views can be categorized into four main groups:
- Graphical Data Views
- Node Group Views
- IP Network Views
- Folders
Graphical Data Views
Graphical Data Views are designed to present live diagrams, free-form dashboards, image-based maps, and geographical maps. These views can include region contour maps with the ability to geo-locate elements. They visually represent the network's current state, offering an intuitive and immediate understanding of network performance and issues.
- Live Diagrams: Real-time graphical representations of network elements and their statuses.
- Free Form Dashboards: Customizable dashboards allow you to arrange network data in a format that best suits your monitoring needs.
- Image-Based Maps: Visual maps created from images where network elements can be positioned and monitored. Geographical Maps are maps based on geographical data, showing the locations of network elements and regions.
- Geographical Maps: Predefined region-based maps with geo-location support. Over 100 maps are available (e.g., countries, states, regions). Unlike embedded browser maps (e.g., Google Maps), these are vector-based contour maps.
Node Group Views
Node Group Views help organize nodes into categories based on location, criteria, or other classification. These views can be manually created or dynamically updated based on filtering expressions.
- Manual Node Group Views: Created and organized manually, allowing customized categorization.
- Filtered Node Group Views: Automatically refreshed based on given filtering expressions, ensuring the views remain up-to-date with the latest network data.
IP Network Views
IP Network Views automatically group nodes by the network they belong to. This includes a separate automatic view for public nodes, providing a structured overview of the network's IP layout.
- Automatic Grouping: Nodes are grouped by the networks they belong to without manual intervention.
- Public Nodes View: Public nodes are automatically placed in a separate view for easier monitoring and management.
Folders
Folders are primarily used for management purposes. They help organize various views and extend the capabilities of filtered dynamic views by creating multiple sub-views. For example, a folder dedicated to servers can contain views categorized by the operating system.
- Static Folders: Used for manually organizing views and elements.
- Dynamic Folders: These extend the filtered dynamic view capabilities, automatically creating multiple views based on defined criteria. For instance, a dynamic server folder can generate sub-views for different operating systems, providing a structured and detailed overview.
How to Add Views in NetCrunch
To add a new view in NetCrunch, follow these steps:
Using the Wizard
- At the top of the Atlas Tree on the left side of the program window, locate the blue plus + button.
- Click the plus button to open a wizard to select the type of view you want to create: Graphical Data View, Node Group View, IP Network View, or Folder.
Using Shortcut
- Alternatively, you can click the plus button while holding the Ctr key.
- This will present you with a flat list of 9 options to create the given view type, allowing for quicker access to the desired view creation.
Following these steps, you can efficiently add and manage various views in your Network Atlas, ensuring a well-organized and comprehensive monitoring setup.
Adding Alerts
Configure alerting by attaching conditions to monitored data on nodes, sensors, or services. Alerts define when NetCrunch should react to changes in state or thresholds.
Alerts are configured within node monitoring settings by attaching conditions to existing monitoring sources such as services, OS metrics, or custom sensors.
Where Alerts Come From
Alerts in NetCrunch are not standalone objects. They are always tied to:
- Node status
- Network services (e.g. PING, HTTP)
- Operating system monitoring (Windows, Linux)
- SNMP data
- Custom sensors
- Data pushed via native formats (JSON, XML, CSV)
- Syslog, SNMP traps, Web Messages
This means:
- No data → no alert
- Alerts are conditions on monitored values or states
Basic Flow
1. Select or Create a Node
- Locate an existing node in Atlas
- Or add a new node
2. Open Node Settings
- Open Node Settings
- Go to the Monitoring tab
3. Choose Monitoring Source
In the Monitoring tab, identify where the alert should be attached:
-
Existing tiles (recommended):
- Status Monitor
- Node Status
- Service Status
- CPU, Memory, Disk
- Network
-
Or add a new sensor:
- Custom sensor
- Web request
- Script
- External data
4. Add Alert Condition
- Open the selected monitoring tile
-
Define alert conditions:
- Thresholds
- State changes
- Availability
- Custom logic
OS-Based Monitoring Alerts
If OS monitoring is enabled (e.g. Windows):
Alerts can be added directly to: - CPU - Memory - Disk - Services - Event Log
These are:
- Pre-structured
- Optimized for common scenarios
- Extendable via custom alerts
Custom Alerts
Custom alerts allow:
- Defining thresholds on any metric
- Combining multiple conditions
- Creating domain-specific logic
They are available in:
- OS monitoring sections
- Sensors
- Custom data ingestion
Scaling Alert Configuration
Multi-Node Configuration
Alerts can be added to multiple nodes by:
- Multi-selecting nodes
- Applying changes once
Monitoring Packs
Monitoring Packs are the primary scaling mechanism.
Automatic Assignment
- Assigned using expressions
- Example: all Windows servers, all routers
- Applied dynamically
Manual Assignment
- Applied directly to selected nodes
- Supports multi-selection
Benefits:
- Consistency
- Reusability
- Reduced manual work
Sensors and External Data
Alerts can also be based on:
- Script results
- Web checks
- API queries
- Imported data
NetCrunch supports ingesting structured monitoring data using:
- JSON
- XML
- CSV :contentReference[oaicite:1]{index=1}
This enables:
- Alerting on external systems
- Integration with other tools
- Custom telemetry pipelines
Key Principles
- Alerts are always attached to monitoring data
- Monitoring must exist before alerting
- Use packs for scale, not manual configuration
- Prefer built-in monitors before creating custom ones
UI Context
The Monitoring tab in Node Settings is the central place for:
- Adding monitoring sources
- Attaching alerts
- Managing sensors
It provides:
- Tile-based structure
- Quick access to common monitors
- Expandable architecture for custom monitoring
Pitfalls
- Adding alerts without proper monitoring setup
- Duplicating alerts across nodes instead of using packs
- Overusing custom alerts instead of built-in logic
- Ignoring data source quality (alerts depend on it)
Summary
Alerting in NetCrunch is tightly integrated with monitoring. Instead of creating alerts separately, users attach alert logic directly to monitored data sources, ensuring consistency, scalability, and real-time responsiveness.
Managing
Effective Strategies for Managing Notifications
Effective notification management is essential for maintaining a well-functioning network monitoring system. By implementing the strategies and best practices outlined in this documentation, you can optimize your notification processes, ensure timely responses to alerts, and continuously refine your approach to meet evolving needs.
Notification management is a critical component of effective network monitoring and incident response. Properly configured notifications ensure that the right people are informed at the right time, which helps swiftly address issues and minimize downtime. This documentation provides an in-depth look at effective notification management strategies within NetCrunch, common pitfalls to avoid, and practical steps to optimize your notification settings.
Understanding Notification Management
Notifications serve as alerts to inform users about important events and incidents within the network. Effective notification management ensures timely and relevant information delivery, enhancing team efficiency and response times. Poor management, however, can lead to missed alerts, overwhelming noise, and ultimately reduced operational effectiveness.
Common Mistakes in Notification Management
- Over-reliance on Email Notifications: Dependence on a single notification channel like email can result in missed alerts due to spam filters or inbox overload.
- Lack of Role-Based Notification Structuring: Critical alerts might not reach the appropriate personnel without role-specific notifications.
- Inconsistent Notification Delivery Methods: Varying notification delivery methods can confuse and miss alerts.
Notification Groups
Notification groups streamline alerting multiple users based on their roles and responsibilities.
Steps to Create Role-Based Notification Groups in NetCrunch
- Navigate to Notification Settings: Go to NetCrunchNetCrunch SystemUser & Access Rights Management and select
Notification Groupstab. - Add New Group: Using + at the bottom of the list, and set the name according to the role
- Add Members: Add users to the group, ensuring each user receives the relevant notifications to their role.
User Notification Profiles
Each user has a notification profile and a list of definitions allowing customized notification settings. These definitions include:
- Type of Notification: Users can select the notification type, such as email or SMS.
- Message Format: Define the format of the notification message.
- Address or Phone Number: Specify the recipient's address or phone number. Multiple items can be included, separated by semicolons.
- Time Restrictions: Set weekly schedules to determine when the notification profile is active. This allows for selecting time ranges for each weekday.
Managing User Notification Profiles
The administrator manages User notification profiles in the User & Access Rights window. Each user can also manage their profile in the console. The Notification Profile section within the user profile window allows for adding, editing, or removing specific profiles.
Steps to Manage Notification Profiles
-
Access User Profile:
- Navigate to the
User & Access Rightswindow. - Select the user whose profile you want to manage.
- Navigate to the
-
Notification Profile Section:
- In the user profile window, locate the
Notification Profilesection.
- In the user profile window, locate the
-
Add a Profile:
- Click on the + option to add a new profile.
- Define the type of notification, message format, addresses or phone numbers, and time restrictions.
-
Edit a Profile:
- Select an existing profile from the list.
- Modify the settings, including notification type, message format, recipient information, and time restrictions.
-
Remove a Profile:
- Select the profile you wish to remove.
- Confirm the removal of the profile from the user's notification settings.
Administrators and users can effectively manage notification profiles and ensure that notifications are received in the preferred format, at the right time, and through the appropriate channels.
Best Practices for Notification Management
- Avoid Direct Email Notifications: Use notification groups and profiles to manage alert delivery.
- Regular Review: Review and update notification groups and profiles periodically.
- Balance Notification Volume: Avoid overwhelming users with too many alerts.
- Training: Ensure team members are trained on effective notification use.
Advanced Notification Strategies
NetCrunch manages alerting actions through action scripts, defined as an escalation list of actions to be executed after a specified time from when an alert occurs. These actions can include notifications and automation tasks such as executing remote programs, running scripts, or integrating with external systems. Actions are categorized into:
- Basic
- Control
- Logging
- Integrations
Integration Actions
Integration actions include:
- Notifications
- Service Desk
- Text Message (SMS Gateways)
Users can also add actions to be executed at the end of the alert after the alert has been closed.
Action Execution Criteria
In addition to setting the time after an action is executed, NetCrunch allows setting filters so actions are executed only if all conditions are met. The filter criteria include:
- Severity: The severity level of the alert.
- Weekly Schedule: Specific times when actions should be executed during the week.
- Node Importance: The importance level of the affected node.
- Node Group Membership: The group to which the affected node belongs.
- Organization Membership: The organization to which the affected node belongs.
Hierarchical Script Definitions
Scripts can be defined hierarchically, allowing them to inherit actions and extend the base script. Additionally, scripts can enable the repetition of the last action at a given interval.
Example Script
A simple example script might include the following steps:
-
Immediately
- Notify the administrator's group immediately upon the occurrence of the alert.
-
After 15 minutes
- After 15 minutes, notify the supervisors' group only if the severity and node importance are critical.
-
On Closure
- Only notify the supervisors' group upon alert closure if the severity and node importance are critical.
By utilizing these advanced notification strategies, NetCrunch ensures that critical alerts are addressed promptly and appropriately while providing flexibility for complex notification and automation requirements.
Add link create/edit new views