Bandwidth cost of monitoring across a WAN
Many IT professional are confronted with a cost/benefit dilemma when considering monitoring of gateway/WAN or remote switch traffic across a bandwidth constrained lines. See how NetCrunch helps you track it.
Bandwidth consumption by the monitoring traffic
While monitoring devices across the WAN does impose a ‘house-keeping’ consumption, SNMP is a wonderfully efficient monitoring protocol that employs UDP, so none of the hand-shaking as we would see in a TCP based protocol…. just simple request/response.
Not to worry. With NetCrunch’s default settings, you can expect to only consume 1-5% of available bandwidth when remotely monitoring SNMP traffic remotely. Obvious contributors to bandwidth consumption are polling interval, total number of devices monitored and monitoring protocol, all of which are unique to your environment.
Let’s use science.
You have two simple ways to get an overview of the current Bandwidth used in your environment: Physical Segments map and on the Node itself.
-
Physical Segments can be found in your Network atlas under the IP Networks segment and needs to be enabled manually.
-
Make sure that you added all layer 2 devices with the correct SNMP Profile to your Atlas. NetCrunch creates the map manually using information from ARP Tables and data will be refreshed at a sane interval of 15 min by default.

-
You will have a quick overview which devices communicate with each other. Just click on the connection line to get more details about the current Traffic, Status and Graphs including traffic history.
Tracking communication between NetCrunch Server and other nodes
To see the communication between NetCrunch Server, NetFlow or SFlow needs to be enabled on your switches:
-
Allow NetCrunch’s built-in Flow collector to collect flows by providing the IP Address
-
Open the Flow standard ports: NetFlow Server works on UDP 9996 and sFlow Server on UDP 6343
-
Make sure that the Firewall is not blocking the ports
Setup on switches differs between vendors, so please check that your device is able to collect/forward flows and how to correctly set it up.
In NetCrunch you can enable/disable the Flow collector and change default ports under:
Tools >Options >Monitoring >Flow Collector
Go to Node Status>Network Traffic and you get a quick overview, what happens in your network.
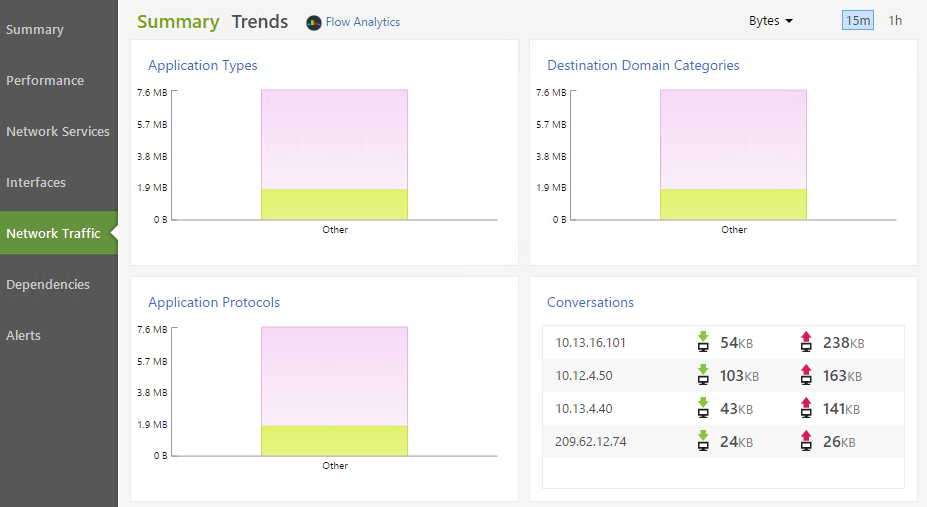
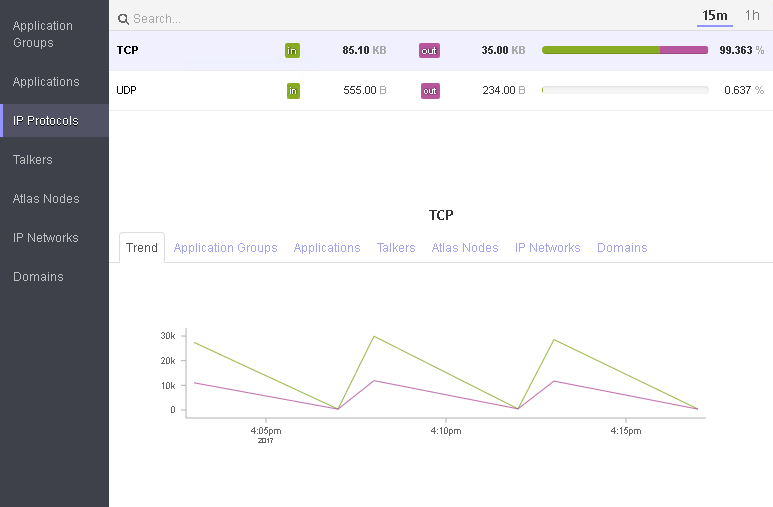
Hit the “Flow Analytics” tab and NetCrunch visualize a complete overview, to which Atlas Nodes, IP Networks and Domains your Node is talking to - Flows are separated in Applications and IP Protocols.
You will find more information about Flow monitoring with NetCrunch in our Documentation, Network Traffic Monitoring chapter.