Using hardware sensors for environmental monitoring
Environmental sensors are part of the business process that ensures the safety of the production, storage, or other facilities facing various environmental hazards that can be natural or man-made. Learn how you can make the most of the environmental sensors' implementation.
Employing multiple environmental sensors is essential when monitoring a large or more complex environment, but even smaller installations can benefit from comprehensive monitoring of the sensors' measurements.
With the example of various hardware sensors from the HW group monitored by NetCrunch, this article will show how you can start collecting data from sensors, display it on the graphical map, and be notified when detected values are outside of the expected values (as defined in the monitoring packs available for these devices in NetCrunch). The goal of environmental monitoring is not only a faster reaction to situations detected by the sensors. It also includes tracking the sensors hardware' health and being notified in case of sensor suspected malfunction.
Configuring SNMP Community to be used by the devices
Hardware sensors in our example support SNMP, so we will use it to collect environmental metric values from them.
- Go to Top Menu Monitoring SNMP Communities and Password...
- Click Add button
- Enter the profile name
- Select version of SNMP
- Enter the Community that will be used by the sensors.
- Save Settings
Configuring Alerting Script actions
This step is not obligatory. The default alerting script in NetCrunch simply saves an event into the event database, displays console notification, and alerts the administrator. However, it may be useful if you would like, for example, to receive an SMS or perform other actions when a problem related to HW Group sensors is detected.
Read more about alerting types and actions available in NetCrunch
Adding Devices to NetCrunch
Now you can add HW Group devices (nodes) to the Atlas in NetCrunch. If you have a large number of nodes to add, you can use Import Nodes from File option (Top Menu Atlas Import Nodes from File) or even NetCrunch's REST API.
- Go to Top Menu Atlas Add Node IP Node
- Enter the IP Address or DNS Name of HW Group Node and click the OK button
- In the Wizard select
Other SNMP Device - Set an icon. You can add your own image to represent the sensor devices if preferred.
- Select the SNMP profile that you created in the 'Configure SNMP Community' section
- Save Settings
Assigning Monitoring Pack
Once a node is added to the Atlas, you can add it to the appropriate Monitoring Pack. In this step, you can also assign your custom Alerting Script.
- Go to Top Menu Monitoring Monitoring Packs & Policies
- Find and open selected HW Group Monitoring Packs (there are several of them for various sensors)
- Open the
Assigned totab - Click the Add Nodes button
- Add appropriate Nodes of the hardware sensors that you added to Atlas
- Save Settings
You can further tweak your alerting script to your needs, for example, set SMS alerting outside of business hours while email alerting during business hours. You can also add escalation or conditional alert, for example, be alerted only after some value persists for longer than a predefined period of time.
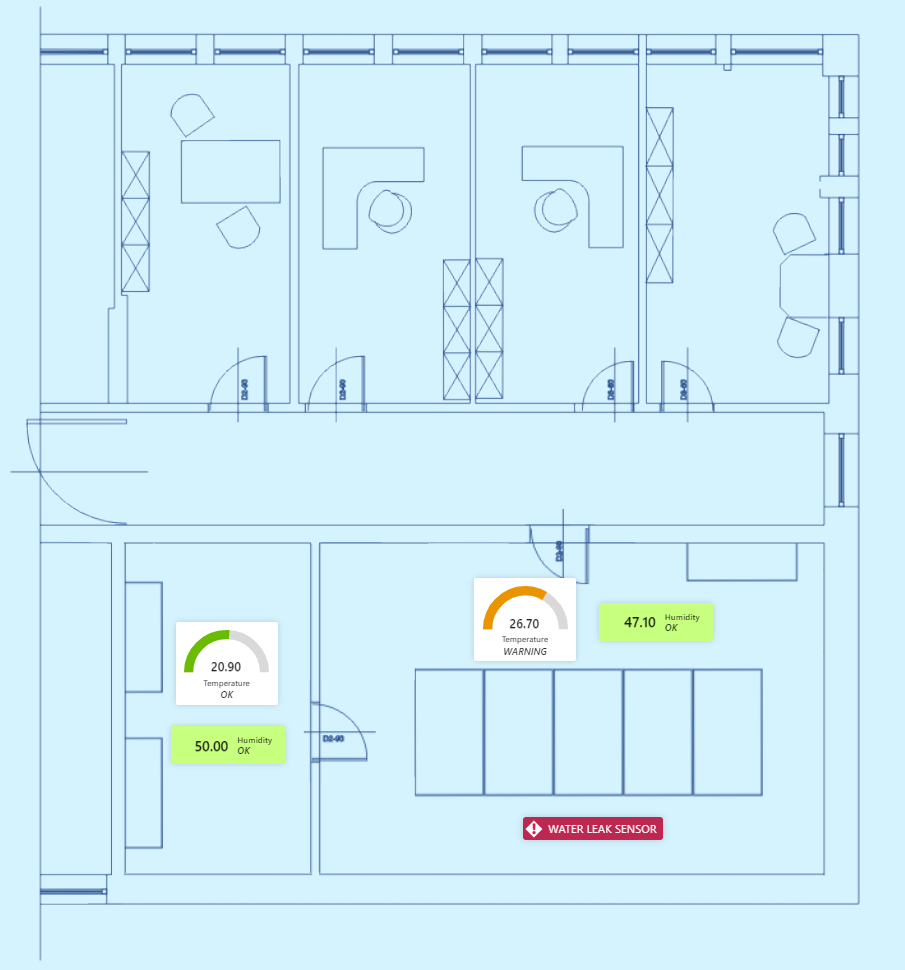
Creating View to display metrics collected by the hardware sensors
Now, you can see collected monitoring values in the Node Status Performance tab. However this is not the end, you can create a View and visualize your facility area or specific floor with sensors arranged on the view. Later on, you can use it e.g. in the Automatic Full-Screen feature of NetCrunch, and display it on a large screen in your teams' room for a fast overview of their status.
- In the Atlas Tree click the + button
- Select View Blank View
- You can enter the name of the View, for example, Server Room Building C
- Click on Pencil button, and next + (Add) button
From this menu, you can add multiple objects to your Atlas. For example, you can create View with floor plan and widgets with counters from HW Group devices. For this tutorial purposes, we will use sensors with counters measuring Humidity and Temperature.
Adding a background picture with e.g. floor plan:
- From the menu select
Picture - Select File
- Mark
Stretchoption - Enlarge/Reduce the image if needed
Adding Data Widgets to visualize humidity and temperature values:
- From the menu select
Data Widget - In the Widget tab, select the widget you are interested in (we use Gauge)
- In the Data tab select
NodeandCounter - (Optional) You can adjust the look and size of your widget in the Appearance tab
- (Optional, but recommended) In the State tab, enter value ranges for which the widget will be OK, Warning, and Error. Enter also Caption if you want to include the name of the metric
- Close the Properties window
Adding Status Widget to be visually informed if there is a water leak in the server room
- From the menu select
Object Status Widget - In the Widget tab, select the widget you are interested in (we use Mini Status Icons)
- In the Data tab select
Node - In Object Type choose
Alertand find alertWater leak detected - (Optional) You can adjust the look and size of your widget in the Appearance tab
- Close the Properties window
If you want, you can move your widgets/pictures using Drag and Drop to arrange it in the location in your View reflecting its physical location in your server room. If something is displayed on top of another element and should be underneath, you can use Bring to Front orSend to Back options.
Remember to click the Save button to keep all your changes to the view.
You can also monitor the status of the device hardware to be alerted if its health status changes or an error is detected.
- [11.08.2020]How to configure SNMP traps for ESXi/ESX 3.5, 4.x, and ESXi 5.x hosts
Monitoring the health of older ESX/ESXi systems can be implemented by enabling SNMP and setting up SNMP traps to track performance events. Learn how to set it up.
- [26.03.2020]Enabling SNMP on a Windows machine
Despite the fact, that Microsoft depreciated SNMP for the Windows Server 2012 onwards, it is sometimes necessary to enable SNMP in this system. Below you will find a simple walkthrough how to do it.
- [05.04.2017] Using NetCrunch to track Port Security status of Cisco switches.
Cisco port security is a great feature to make your network safer. Learn how to configure NetCrunch to display the status of Cisco Port Security on the switch interfaces.
- [15.12.2019] How To Monitor Any Device With SNMP
Here's an SNMP primer for any junior person on your IT team - they may actually be younger than the protocol itself. After all these years, for most devices that you need to monitor, starting with SNMP before you try anything else is a safe bet.
- [08.02.2019]SNMP monitoring features in NetCrunch
There is a lot of the ways of how we can monitor the condition, performance and availability of the devices with available SNMP service running on them. Learn how to gather the counters and states from various devices with the tools available in the NetCrunch.
- [24.01.2019]Monitoring complex instances of the SNMP counters
Sometimes the SNMP counter identifier is placed in a different table than a counter. NetCrunch 10.5 introduced a new way of monitoring such complex instances.
- [17.08.2018]Printer monitoring in NetCrunch
Use NetCrunch printer sensor to get information about the status of the printer and the ink level.
- [25.06.2018]How to start monitoring of new SNMP device with NetCrunch
Is your device monitorable? Read the article to learn how to approach configuring monitoring for a new device.
- [07.04.2016] Optimizing SNMP Monitoring in NetCrunch
This article will explain reasons for most common SNMP monitoring problems, describing ways to fine-tune SNMP monitoring settings in NetCrunch. Learn how to monitor without stressing your SNMP device.
- [21.04.2016] Monitoring External Events in NetCrunch
Using multiple tools to catch every SNMP trap or SYSLOG message might be hard. NetCrunch simplifies this task with the External Events window and lets you fine-tune your log and SNMP monitoring: