Diagnosing switch port capacity issues to optimize network efficiency
How do throughput and bandwidth affect network operational health? Learn what to check when looking for the root cause of your network bottlenecks or performance degradation.
What's the difference between throughput and bandwidth?
In short, throughput is used to denote how much data can be sent from source to destination in a given time frame, while bandwidth is the term used to indicate maximum network bandwidth. Bandwidth and throughput seem to be similar. We can understand the difference between them by taking the analogy that bandwidth is a pipe and throughput is water. The larger the pipe (bandwidth) diameter, the more water (throughput), i.e., data, can simultaneously flow through it.
Should I increase bandwidth?
We must remember that having a lot of bandwidth does not ensure high network performance. Packet loss, latency, and jitter can all degrade network services' performance even when you have high bandwidth. In practice, this means that the bandwidth determines the maximal volume of packets that can be sent between devices, and throughput gives a picture of the actual volume of transmitted packets. As a result, throughput is more important than bandwidth as a measure of network performance.
Bandwidth and latency
Latency and bandwidth are often mentioned in one sentence, but each concept has its own meaning. The term bandwidth was explained earlier, and latency is the time needed to transfer data from the sender to the recipient. There is a convergence between these network parameters, however, because while the bandwidth determines how much data we can theoretically transfer, the latency determines how quickly the data packets will reach their destination. Thus, minimizing latency is essential in terms of network speed.
Thus network performance monitoring should always include tracking throughput, and not forgetting latency and packet loss.
Most common sources of bottlenecks, their symptoms, and how to track them
The most common causes of the bottleneck are switches that are too slow or too overloaded to efficiently manage traffic. The symptom indicating the poor performance of network devices is high CPU load.
CPU Load
NetCrunch has predefined counters to monitor CPU on many network devices of various vendors through SNMP. To start monitoring them, it is enough to add nodes to the appropriate monitoring packs. In addition to the fact that the counters will be gathered, an alert will also be generated if the CPU usage is high.
If there are no predefined monitoring packs for your device, don't worry. It is possible in NetCrunch to use other MiBs and define your own Data Collectors/Alerts. You should also take trends into account because temporary increases in the load on active devices may be the result of everyday activities (e.g., planned backup).
Bandwidth utilization
When monitoring switch bandwidth utilization, its high values on some or multiple ports are a red flag to attend to. You can observe throughout in NetCrunch in Physical Segments. Automatic switch port maps in NetCrunch help you immediately see what device or user is connected to each port, so you can easily understand what may be the reason for increased traffic there.
It may happen that particular users are transferring high volumes of data, for example, video streaming or moving video files across the network. If this is part of their job, you need to detect such situations and make sure that sufficient network capacity is available for them. If this is not a business-related activity, how you stop it depends on your company policy, but monitoring such situations is essential so that you can escalate it to the proper person in your organization.
Monitoring traffic volume and speed
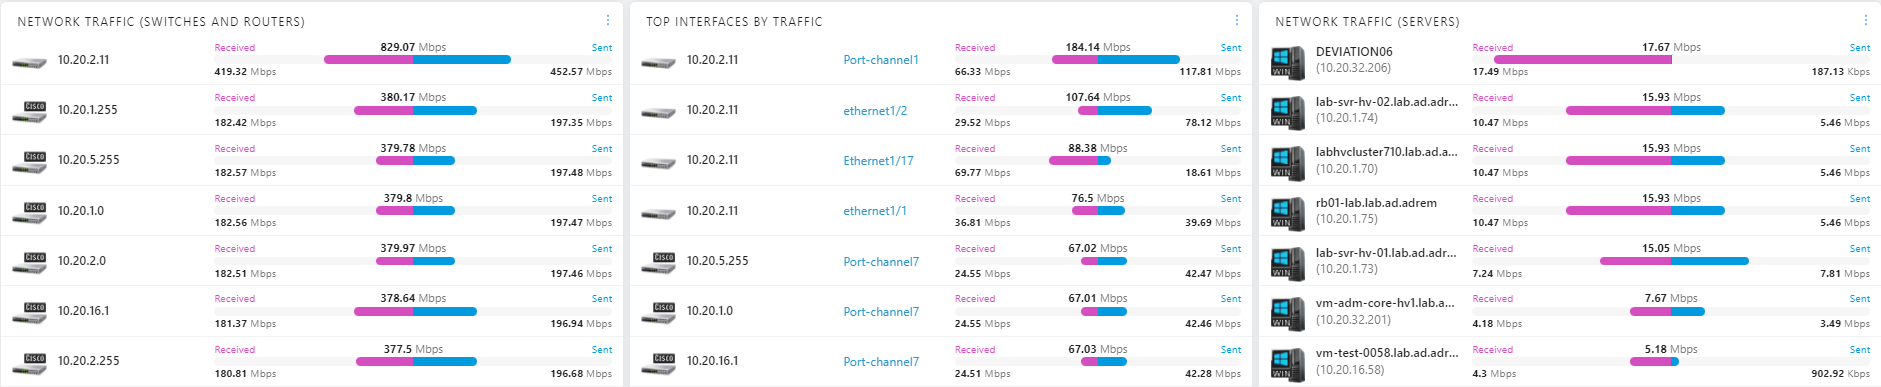
Some open-source monitoring systems allow tracking the speed of links via SNMP. In NetCrunch traffic volume and speed on each link are tracked automatically when you enable layer 2 maps for your network. Traffic volume and speed views are created automatically and can be referred to at any time. You can also set a threshold for metrics to track and be notified when they are crossed. You can always refer to top charts in NetCrunch to check top traffic hoggers in real-time.
Applications that generate most of the traffic
You can also detect what applications consume most of the bandwidth by using the flow monitor in NetCrunch. If the trends of devices indicate their constant high load, start the analysis of layer 4 TCP/IP. You can identify applications contributing to network bandwidth reduction with the NetCrunch flow monitor.
If you have a device on your network that supports flows, especially Cisco NBAR, NetCrunch can easily check which Domain Categories, IP Protocols, Applications Protocols, or Application Protocol Groups are responsible for generating the most traffic on the network. Again - you can set up alerts to notify you if, for example, heavy traffic is detected for Application Protocol Groups of the type 'Streaming'. Remember, NetCrunch must be set as the recipient of the flows.
Analysing network settings for possible physical faults
You should verify the physical part of your network connectors, patch panels, and network cards. Symptoms of a physical failure are packet loss, delays, connection breaks, changes in connection speed, and jitter. Verification of the physical part of the network can be done with a hardware analyzer.
Most relevant for detecting these types of problems are values read from such metrics as RTT, % Failure Rate, and the Check Time of network services. You can be alerted if any of these parameters increase above values that are normal for your network, for example by more than 50%.
Of course, you will also be informed, if any node (for whatever reason) loses connection with the NetCrunch completely (Node is DOWN alert). To monitor jitter you can use an ICMP Jitter sensor. If you have a device that supports IP SLA, and Jitter operation is set on it, NetCrunch can grab information from it.
Other factors that can negatively affect network speed
Sometimes the reason can be harder to find, for example, a faulty configuration of DNS, system clock, or even poorly written custom application that is generating excessive traffic in your network. Last but not least, you should also verify the IP configuration on your network.
Long-time trend monitoring to detect deviations from 'normal'
In general, for relevant LAN diagnostics, you require data from different time periods. If you monitor your network health for an extended period of time, you can always refer to this data to spot long-time trends and patterns that are specific to your network.
Based on these findings, you can establish a normal performance pattern per time of day, per week, and month, allowing you to spot deviations from your network's 'normal'. For this purpose, NetCrunch and its Trend Viewer are perfect. With its help, you can display and compare metrics for one or for several nodes.
- [28.08.2017] Network interface monitoring in NetCrunch
There is more to Interface monitoring than just IN/OUT traffic examination. This article describes how NetCrunch handles monitoring of High Speed interfaces using 64-bit counters, and how to understand the speed of the interfaces.
- [25.04.2017] Bandwidth cost of monitoring across a WAN
Many IT professional are confronted with a cost/benefit dilemma when considering monitoring of gateway/WAN or remote switch traffic across a bandwidth constrained lines. See how NetCrunch helps you track it.
- [31.05.2016] Application monitoring - adding custom applications to NetCrunch flow monitoring
NetCrunch recognizes flow traffic from thousands of applications out of the box. See how you can easily add your own definitions to correctly monitor less common or custom applications that are used in your network.