Getting Started with GrafCrunch 12
Updated GrafCrunch, a fork of the open-source project Grafana, is an interesting option for teams that use data from multiple open source projects and wish to combine it with NetCrunch sourced data. Learn how to install GrafCrunch and connect it to NetCrunch Server.
The goal of GrafCrunch is to simplify the way it connects to NetCrunch to get the data for the presentation dashboards. In the following example, we will describe how you can display the data related to the monitoring of free disk space and free memory.
Login
Navigate to the address you defined in the GrafCrunch installation (e.g. http://localhost:3000). Login (default settings are User: admin Password: admin).
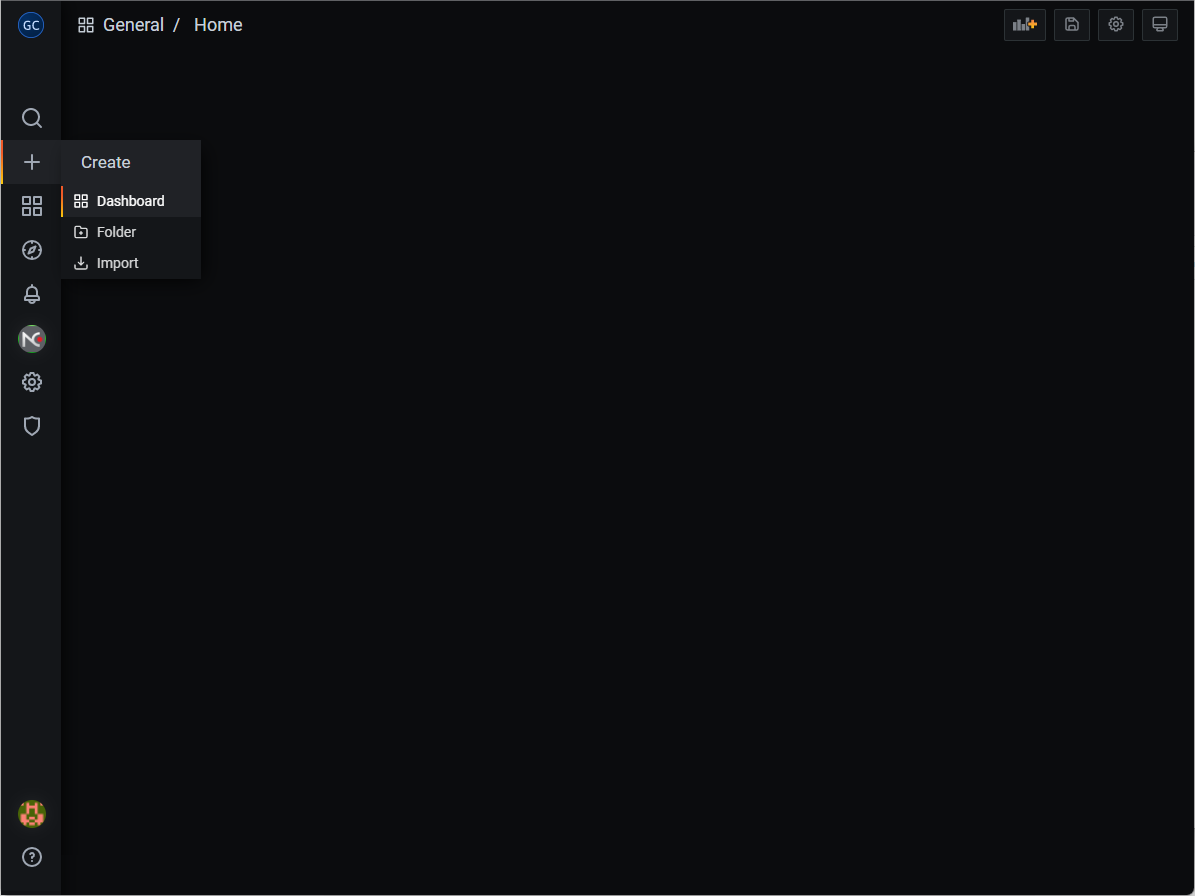
Add a new Dashboard
Hover over the + button located in the left panel and click on the Dashboard option. Choose Add an empty panel option.
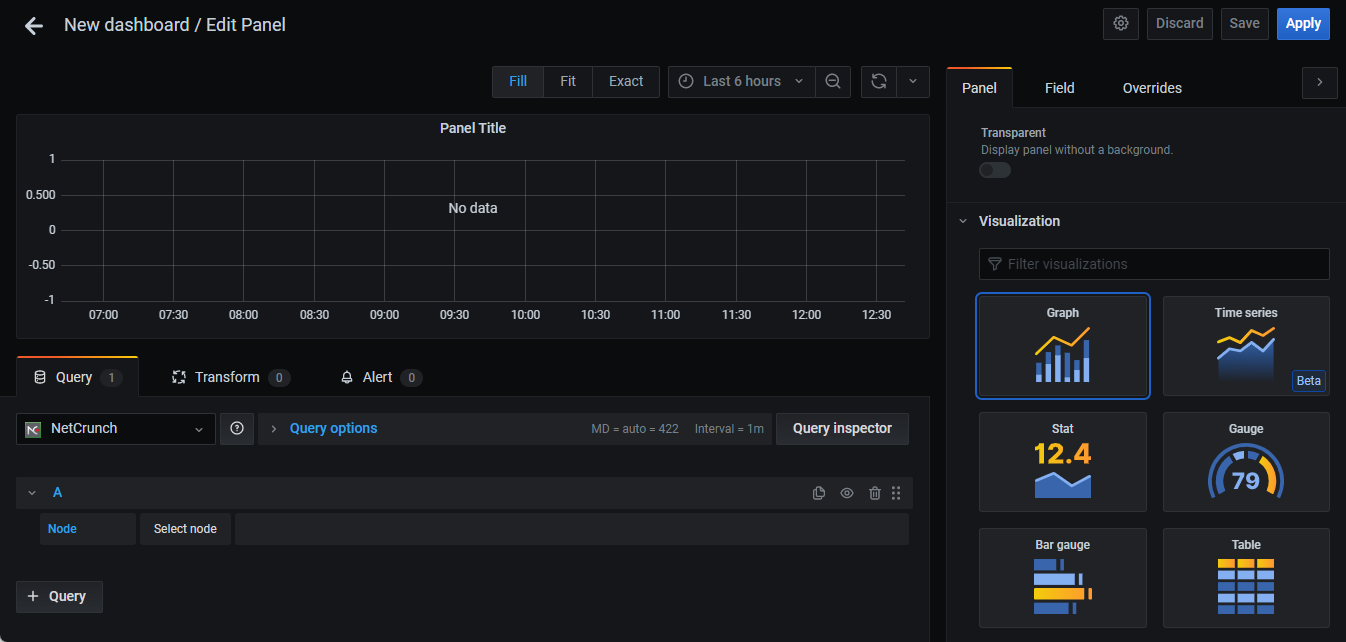
In order to set a title for the panel, type it in the Panel Title field located in the panel on the right.
Add a new Graph panel
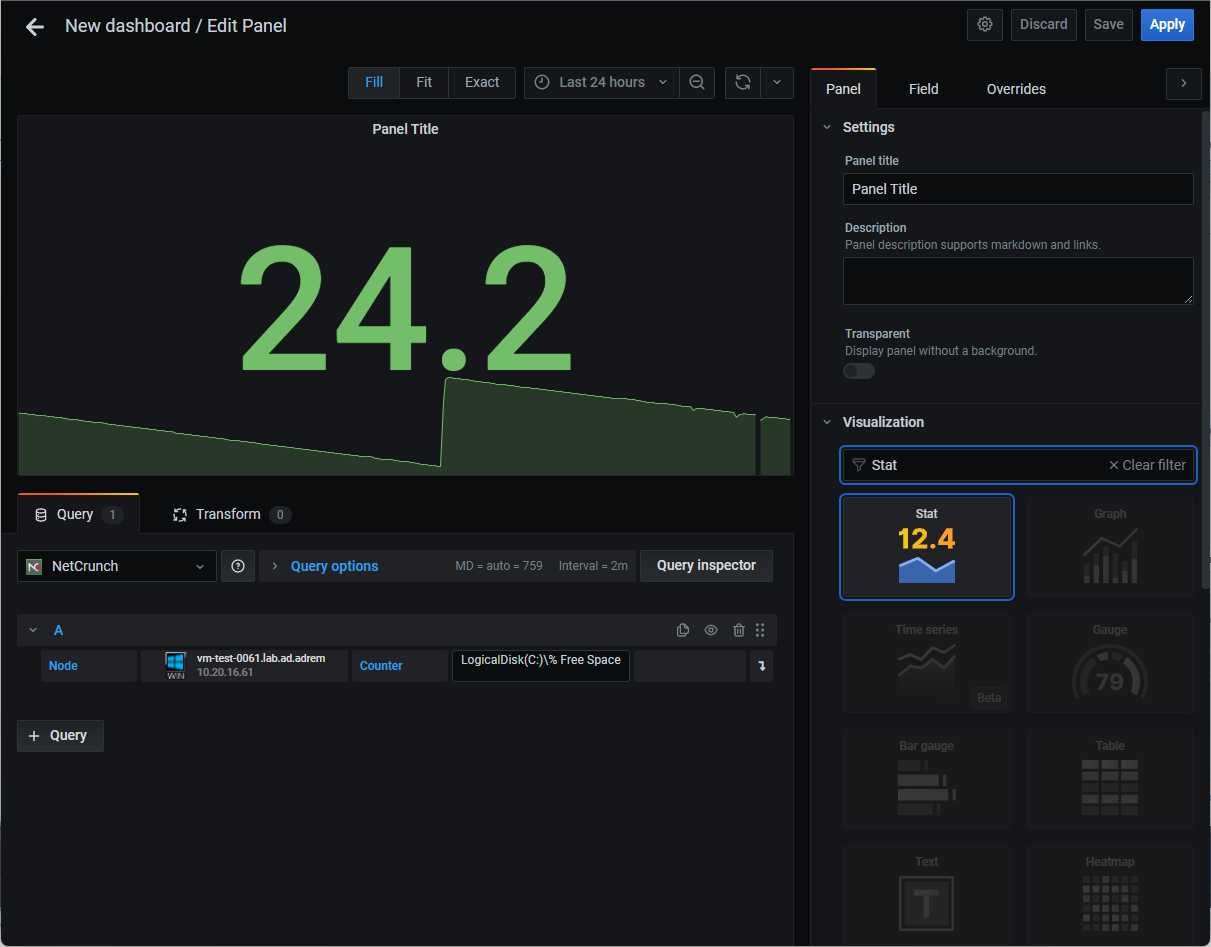
In the right panel, in the Visualization section there are a variety of possibilities for how the data could be displayed in the program. By default, the Graph panel visualization is selected. In the further part, we will guide you through using Stat panel visualization as well.
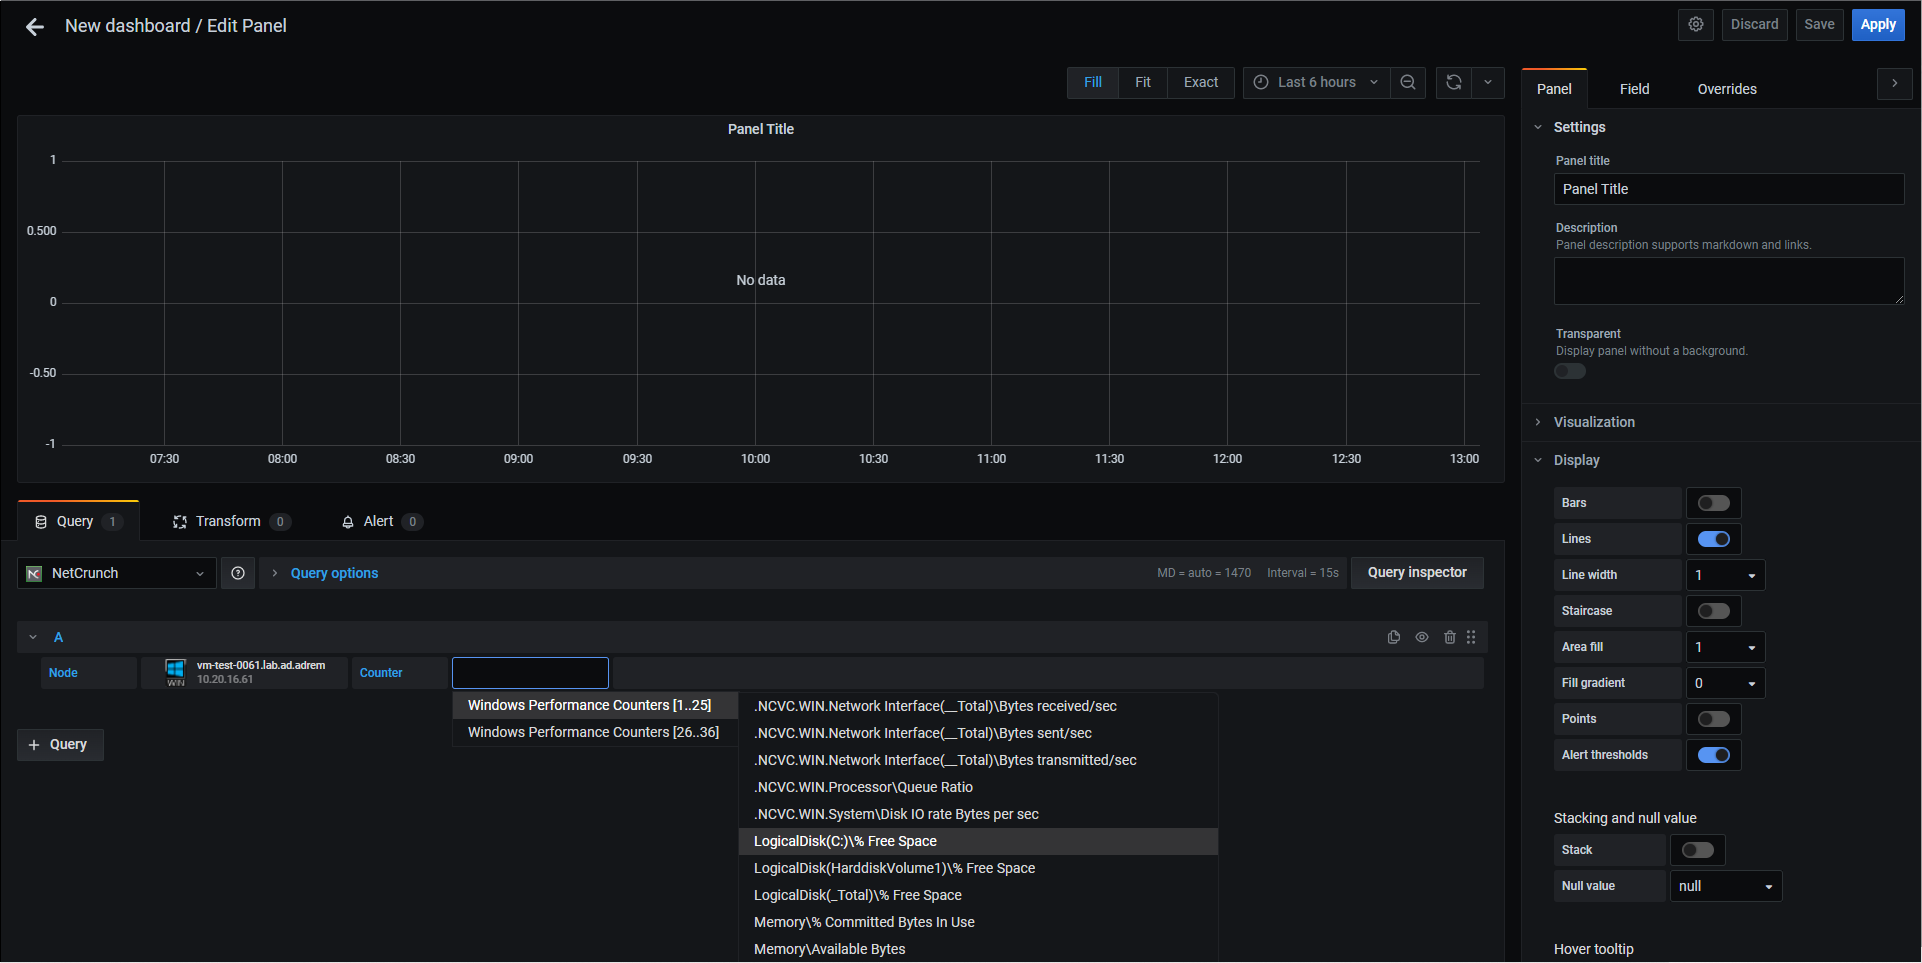
Now you need to select the machine and the counter which should be monitored.
In the Field tab in the right section of the windows, the Display name of the Panel can be edited/changed to C: Free Space for example. Of course, more than one node and its relevant counter can be added to be displayed on the panel.
By clicking on the + Query button more nodes can be selected.
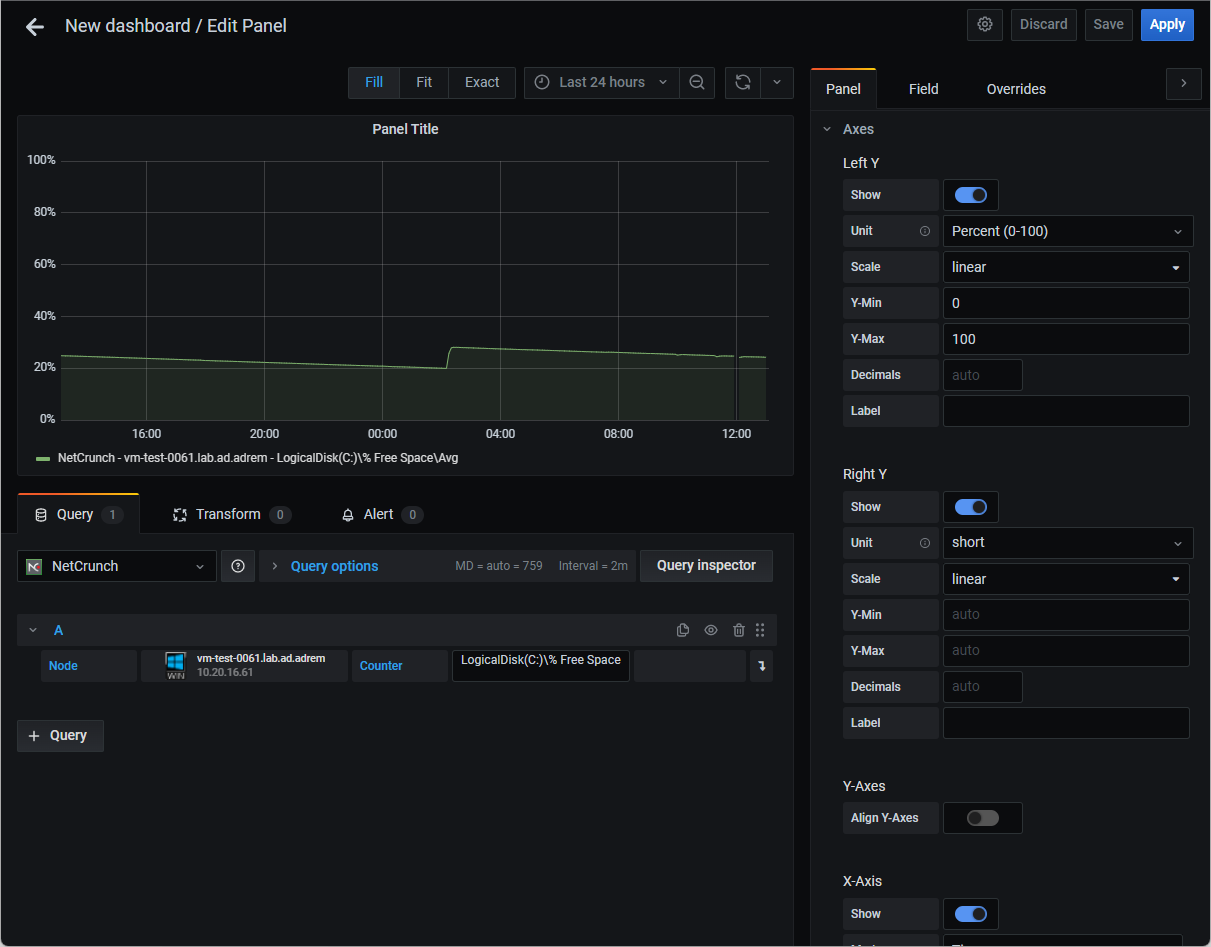
To adjust the Axes expand the Axes section in the right panel. You can change your axes' names to the custom ones by typing in the new phrases in the Label field. The same goes with setting the minimum and maximum values to be displayed on the graph. The relevant fields are available under the Axes section as well.
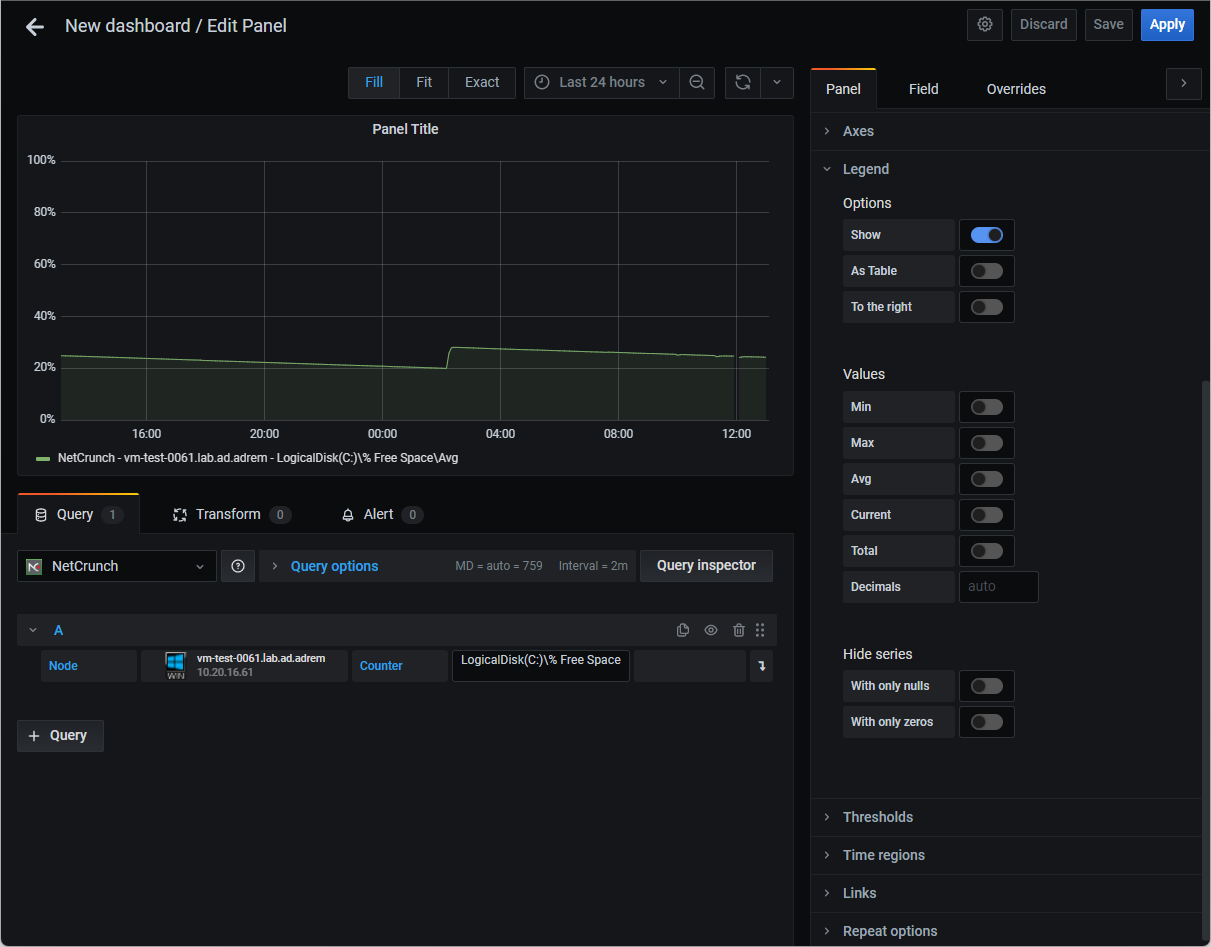
Also if wanted the Legend can be changed/disabled. It could be done in the Legend section.
In the Display section the appearance of the graph panel can be modified if you wish so.
A time shift and overwrite for the time range can be added in Time range dropdown.
For more details see Grafana documentation on visualization panels.
Add a new Stat panel
To add a new stat visualization, choose "Stat" from the 'Vizualisation' section in the right panel. You can select a node and counter as described in the previous section.
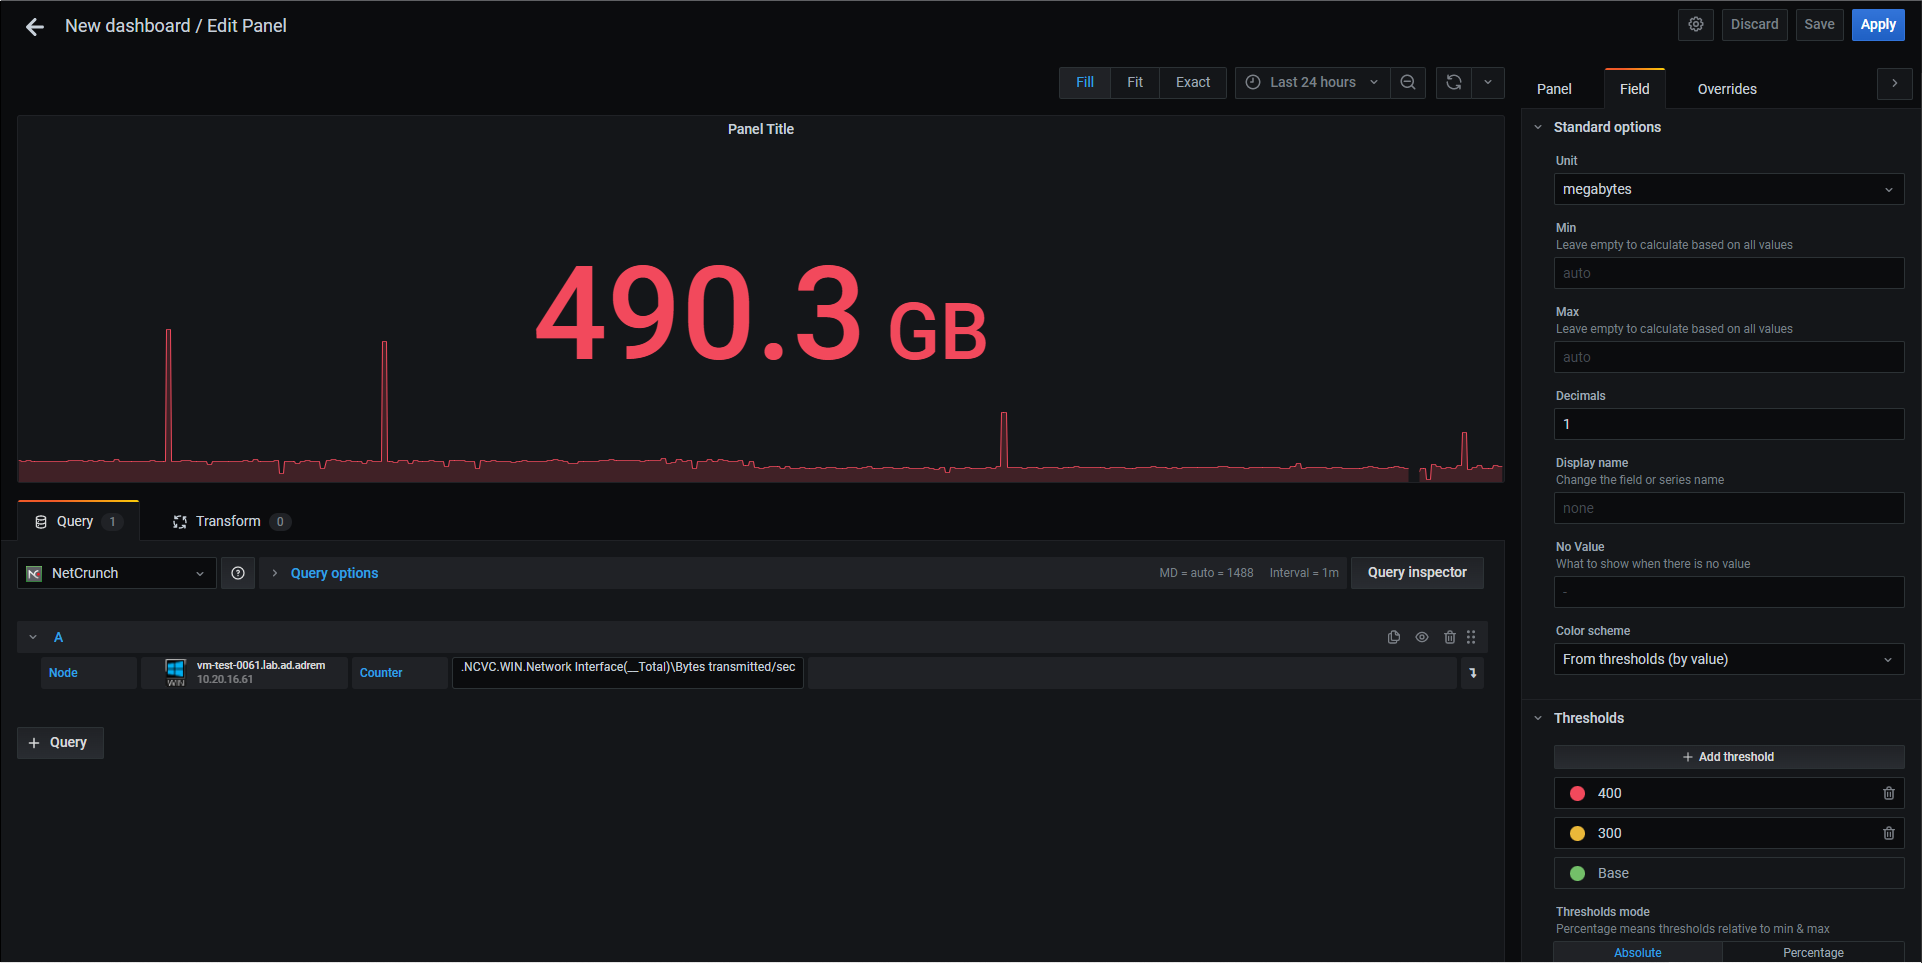
Edit and change the name of the stat in the Panel Settings section (for example to 'Free Mem'). In the Field tab, you can set the Unit (e.g. megabytes) and Decimals (e.g. 1) if needed.
It is also possible to add a coloring code depending on the thresholds value range in the Field Tresholds section. You can set customized colors as well.
In this example, if the free memory is lower than 300 MB the color of the value changes to orange and if it is less than 200 MB it will be displayed in red. It is furthermore possible to map a number to text in the option Value to text mapping. For example, the number 1 can be displayed as On there 0 is mapped to Off.
For more details see Grafana documentation Stat Panel.
Saving the new Dashboard
Enter the settings (gear icon at the top) and name the dashboard. It is also possible to add tags to each dashboard.
After finishing the settings the dashboard can be saved by clicking the Save button.
