Advanced traffic analysis in NetCrunch with Cisco NBAR and NetFlow
If you want to know how various applications and users influence the structure of your traffic, NetCrunch gives you predefined views to do just that. It supports Cisco NBAR protocol to recognize most popular applications, but you can also add your own application definition so that its traffic is properly recognized and reflected in the traffic analysis of your network.
This article will give you an insight how NetCrunch can utilize Cisco Network Based Application Recognition (NBAR) and Netflow technologies.
Netflow and NBAR technologies are supported by CISCO routers. They are implemented to recognize, classify and analyze the traffic components in your network in the real time, including source and destination IP, application name, source and destination ports, the protocol, as well as traffic volume.
For more information about Cisco technologies visit links below:
To see NetFlow analytics in NetCrunch, you need to enable Netflow and NBAR on your router, and then set destination to NetCrunch server. NetCrunch is configured to receive flows on on default ports, so please make sure that ports on your device match the ports set in NetCrunch.
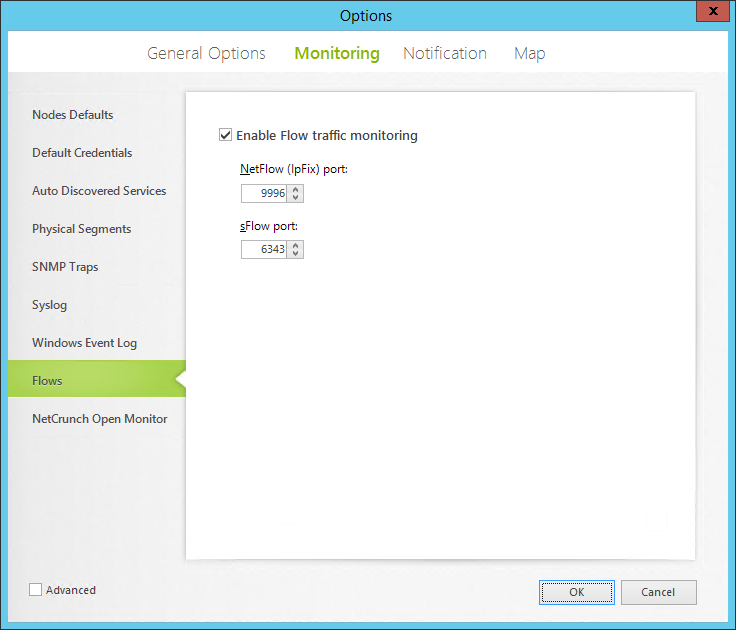
After a while (for some routers it can be a few minutes) NetCrunch will receive first datagrams with data. Everything can be seen in the Flows Tab in the Network Atlas View
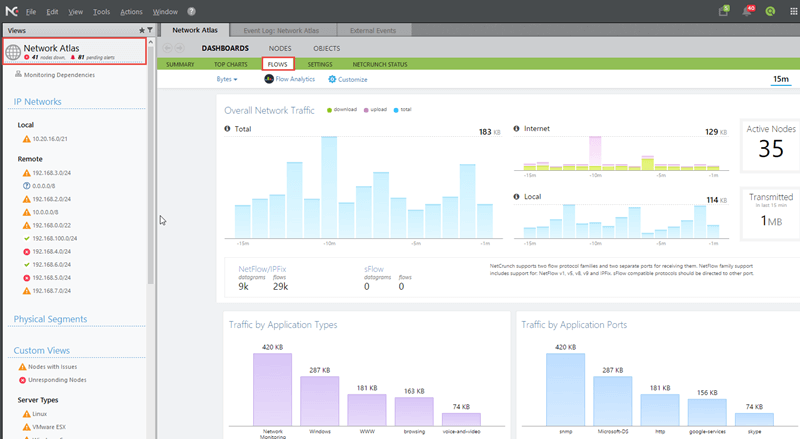
Flows visualization in NetCrunch
Overall Network Traffic:
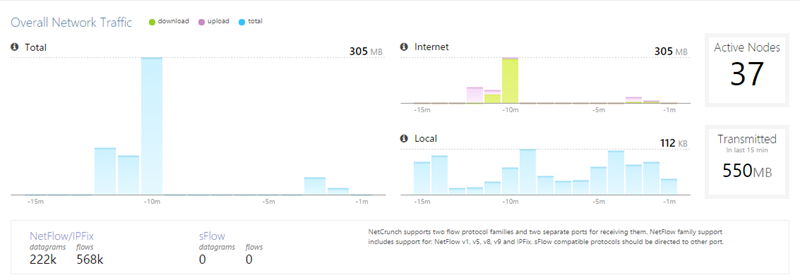
Here you can view traffic generated by all nodes that are monitored by NetCrunch, it shows how many bytes were transmitted in the Local Network and between your network and the internet.
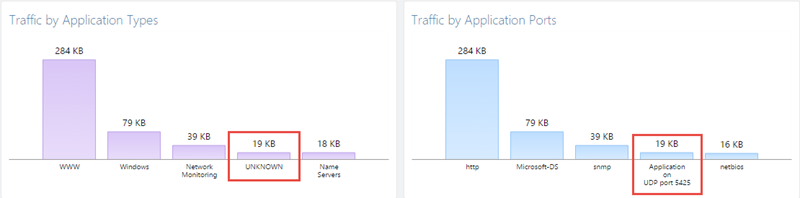
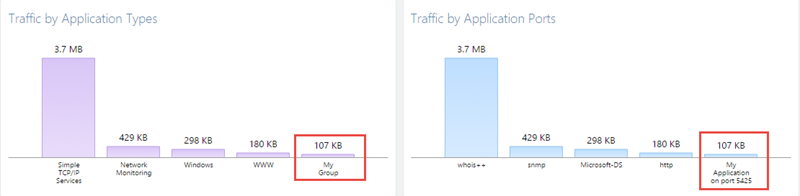
Traffic by Application Types and Application Ports:
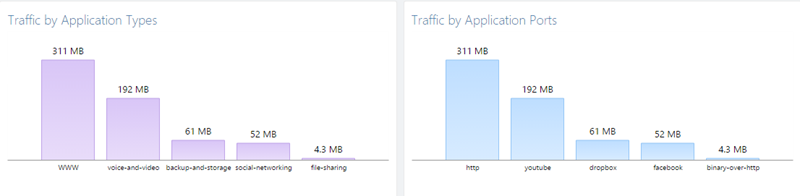
Here you can view traffic by application types on traffic and by ports to which they belong to. NetCrunch uses both its own and NBAR definitions to recognize and classify traffic into groups and ports.
Top Talkers and Traffic by Domain Categories:
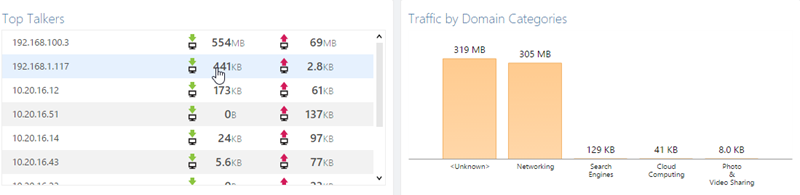
Here you can view the list of most active nodes in your network, sections include divided into Download and Upload. It's especially useful if you want to know which node utilizes most bandwidth of your network. It is also a good way to see if a node that shouldn't generate any traffic is generaitng it.
Traffic by Domain Categories section is another way of classifying the transferred data.
All data represented on these views can be shown for the Last 15 minutes or Last Hour by using switch in the top right corner.
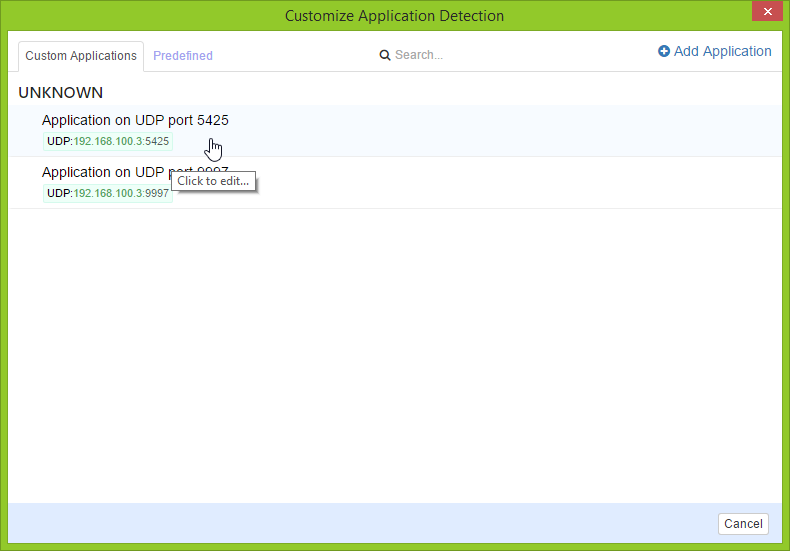
Applications on custom ports.
NetCrunch can also monitor custom applications that are using custom ports - if any application generates traffic on the port which is not known by NetCrunch, it will be saved as an "application on port xxx" where xxx is the port of this application. This feature may be especially useful if a suspicious traffic is detected in your network on an unknown port, it will be recognized by NetCrunch so you can learn about it really fast.
If any custom application used by your company is working on an unknown port (like some small internal use app for example), you can add its definiton to NetCrunch so that it is included in the overall traffic analysis.
After clicking on the selected Application, Custom Application Definition window appears.
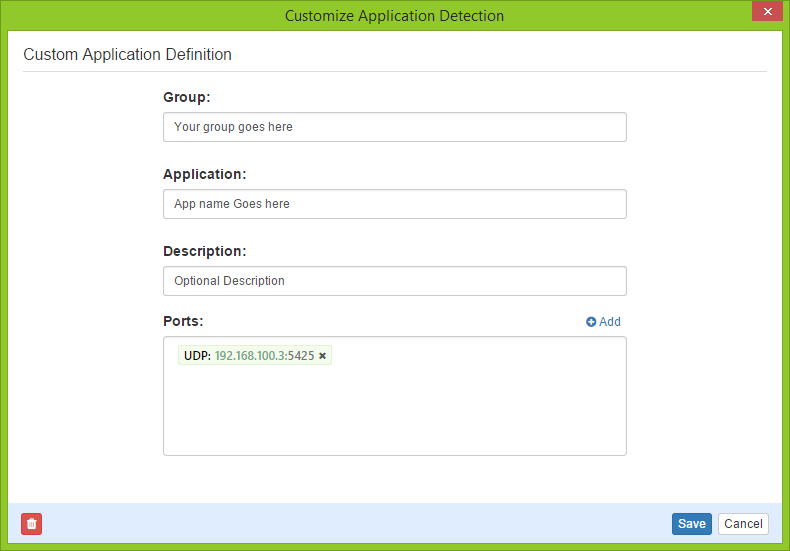
After Application is added, it will be recognized by NetCrunch from now on.
Flow Analitycs:
Flow Analitycs is an additional application which allows you to drill down into more detailed traffic data, it may be used to see exact connection between nodes, groups, protocols, domains, etc...
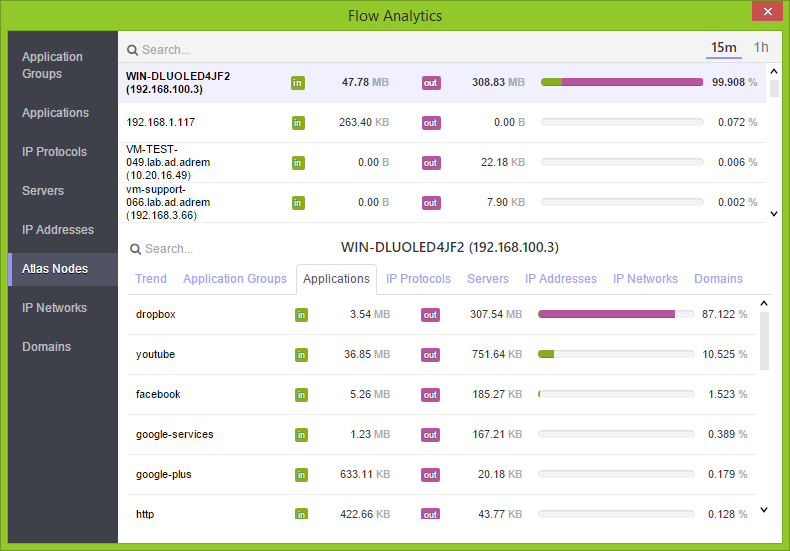
The screen shows activity of a node and how much bandwidth was used by various applications for this node.