Monitoring Cisco IP SLA operations
Learn how NetCrunch visualizes IP SLA operations and how to monitor it.
IP SLA (Internet protocol service level agreement) is a Cisco mechanism to test the network performance in the real time.
Test's are called Operations, examples are listed below.
-
UDP jitter – tests the quality of the link (delay, loss, jitter)
-
ICMP echo – checks if the IP address is reachable
-
TCP connect – tests TCP connections
NetCrunch is able to display information from IP SLA operations and to monitor it. Devices that support IP SLA are automatically recognized by NetCrunch.
To see IP SLA devices:
-
Go to
NODES>DETAILSview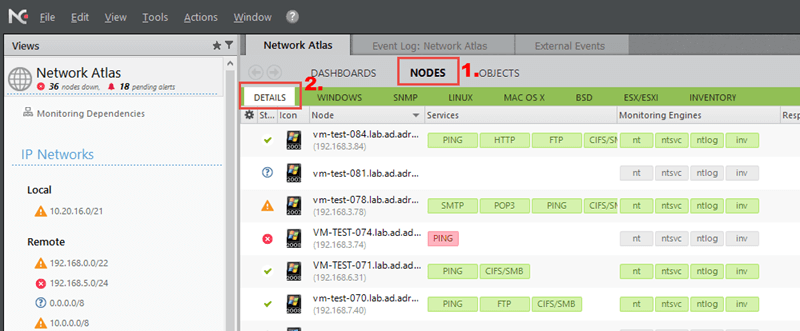
-
In Search current view field (top-right corner), type 'IPSLA'
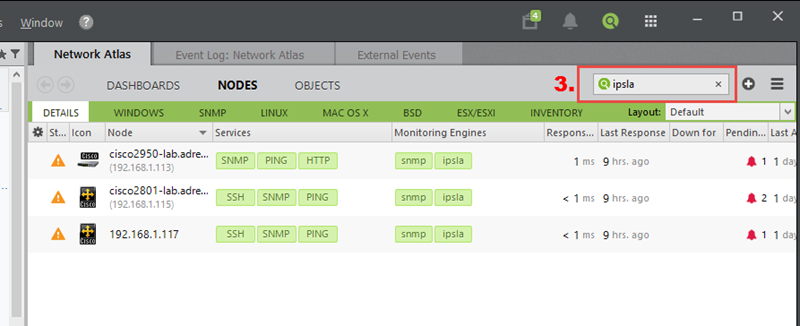
After completing these steps you will get a filtered view, where only IP SLA devices are visible (as you can see on the screen above).
Remember that you need to properly configure SNMP on the nodes with IP SLA.
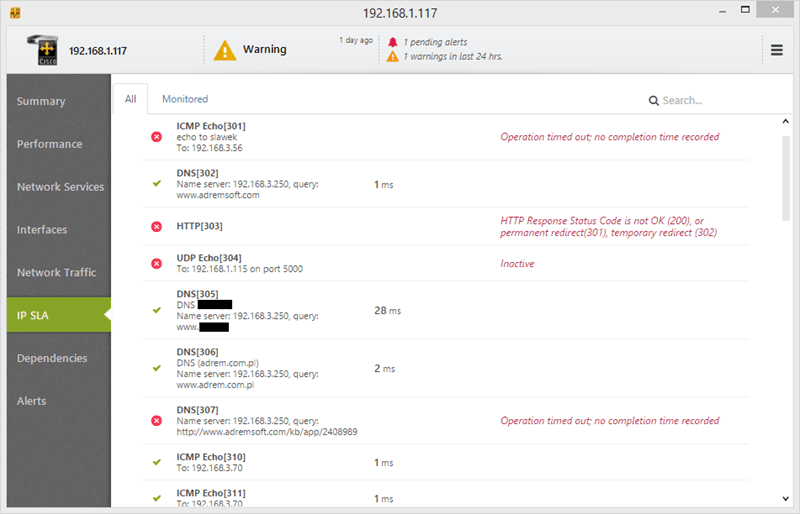
You can see the IP SLA operations defined on the device in the Node Status > IP SLA tab (remember that this tab is visible only on devices that support IP SLA).
Please note that NetCrunch does not monitor IP SLA operations automatically. NetCrunch only displays their state.
You can add IP SLA operations to be monitored so that various alerts and reports related to them are visible.
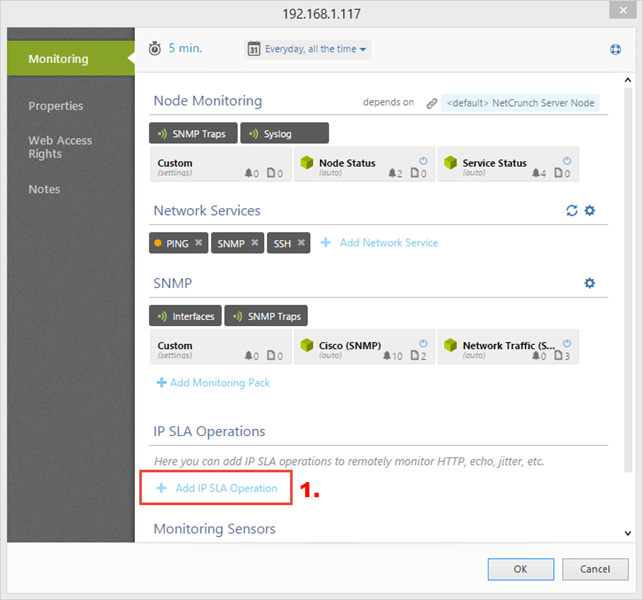
Adding IP SLA operations to monitor:
-
Go to the Node Settings > IP SLA Operations section
-
Click on the 'Add IP SLA Operation'
-
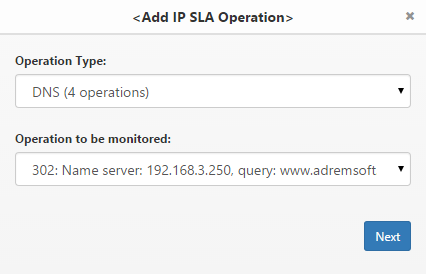
Select the Operation Type and Operation to be monitored, and click Next button
-
Click OK to save changes.
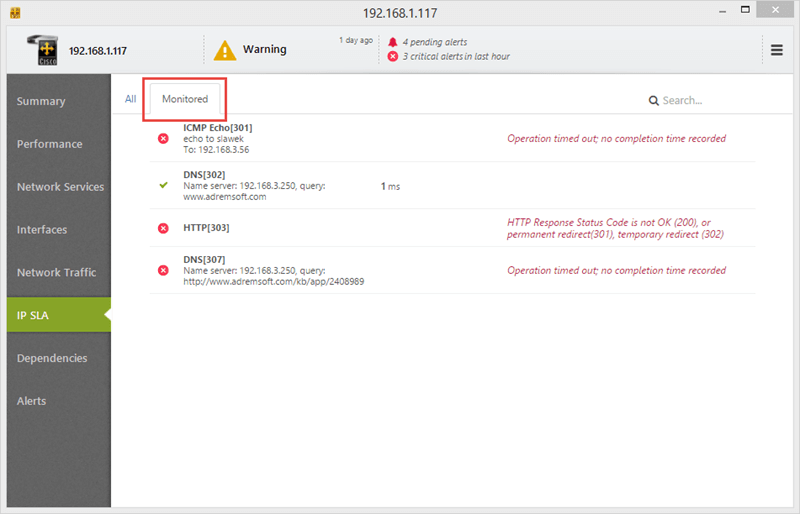
Monitored operations are visible in the Node Status > IP SLA tab > Monitored tab.
If Operation is "Monitored" it means that the counters are collected and alerts are generated. You can also define a trigger for them.
It is possible to change the configuration of the selected operations after they are added to monitoring. Proper Write community profile is required.
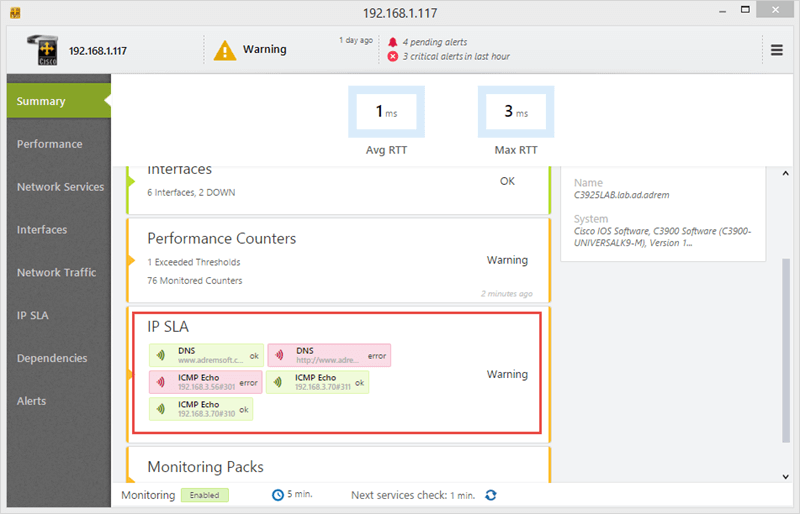
Statuses of the operations are displayed in two places:
-
In the Node Status > Summary tab (for operations added to monitor on this node)
-
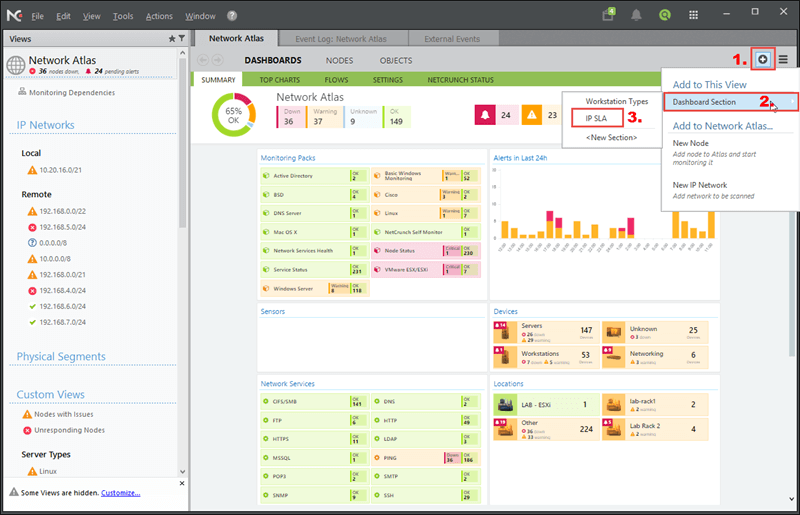
In the Dashboard > Summary tab (for all monitored IP SLA operations). To see IP SLA operation status summary, please remember to add IP SLA section to Dashboard.