Monitoring printer ink level
Learn how you can define new device type (in our case - printer), browse through its MIBs and create new monitoring pack to alert you when the ink level is too low.
In NetCrunch, you do not have to add multiple devices one by one. You do it once and then you can apply its setting to all devices of the same type. This saves time and ensures that you monitor the same devices in the same way, thus allowing for the performance comparison and fast detection of any performance anomaly.
The recommended way of adding new devices to monitoring is to create new device type first. Then, you can browse the device's MIB structure (as this is an SNMP aware device). We wanted to find the parameter responsible for the ink level monitoring. After finding it, we can create an alert related to the ink level. Finally, we'll show you how to graphically present printer and its ink levels in NetCrunch.
Adding printer to monitoring in NetCrunch and defining new device type:
-
Add your printer to monitoring in NetCrunch (You can simply use the '+' sign in the top right corner -> New Node).
-
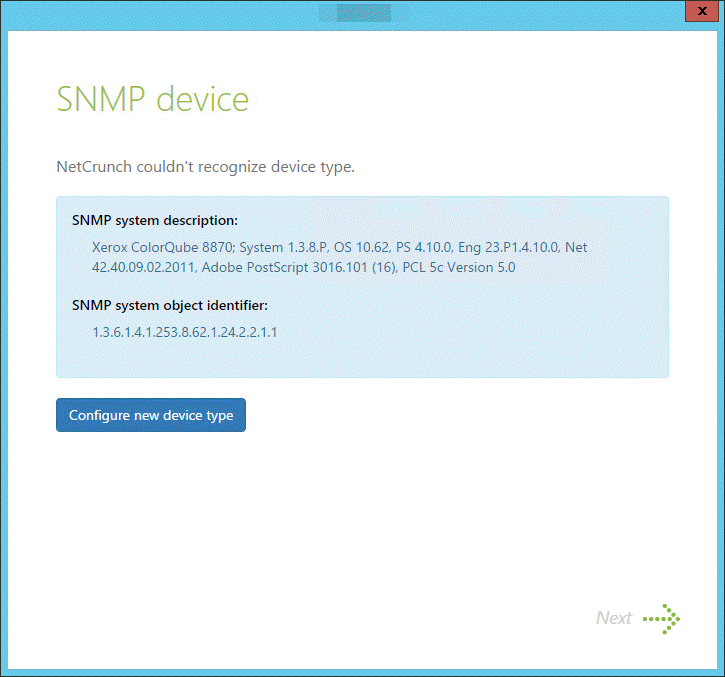
In the New Device Window, select SNMP device, use valid SNMP profile - if you don't have one, use "Add new profile" button and enter credentials.
- If the new window shows the message that NetCrunch couldn't recognize the device type (as is our case on the screen below), use Configure new device type button.
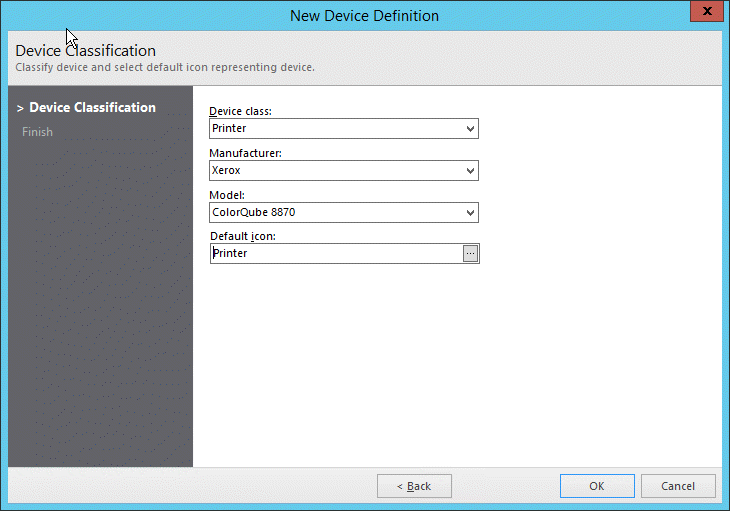
- New Device Definition Window will appear. Select proper Device class and Manufacturer, type your Model and select Default Icon.
After those steps are finished, press on OK and click Done.
Using IP&SNMP Tools
To properly identify what we want to monitor on this device, we need to find proper OID (Object Identifier) which represents the ink status.
To accomplish this, use appropriate tools which you can run from the NetCrunch top menu.
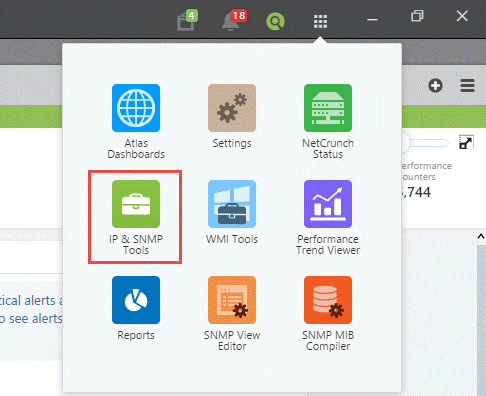
- Select SNMP in tools and switch to "MIB Browser"
- Select the SNMP profile that you have used when adding Printer device type.
- Put the IP address of the printer in the box and select MIB Browser in SNMP Tool section.
-
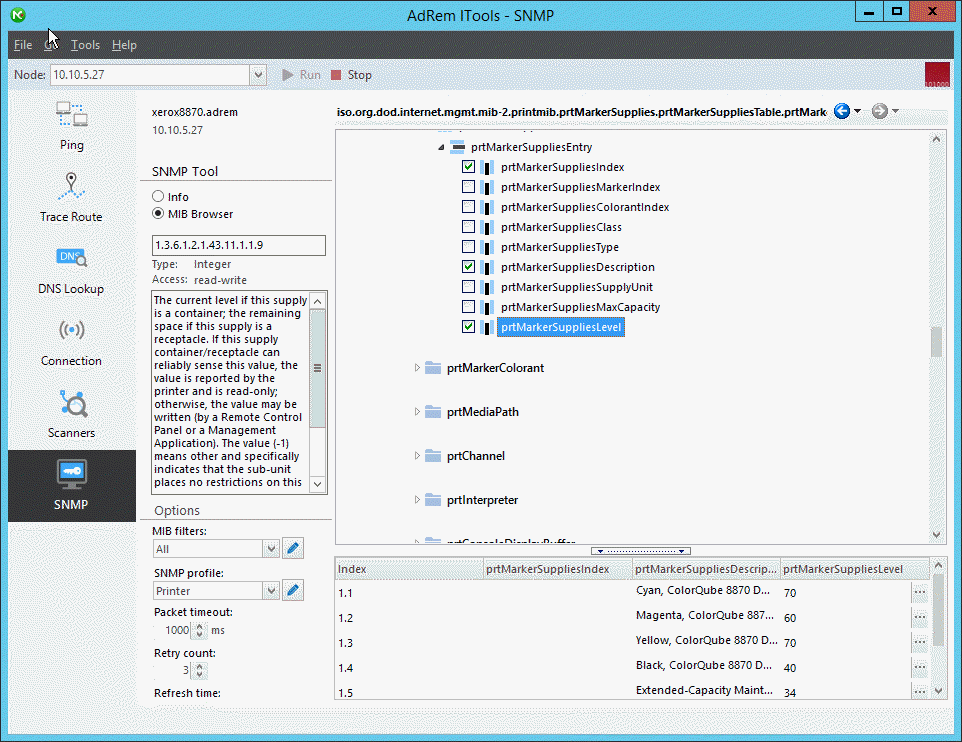
Standard OID that represents ink status is located in: org->dod->internet->mgmt->mib-2->printmib->prtMarkerSupplies
-
Extend this folder, you will be able to see prtMarkerSuppliesTable, extend it again to see prtMarkerSuppliesEntry.
- Select prtMarkerSuppliesDescription and prtMarkerSuppliesLevel Tip: When you click on the key name, you can see OID number and description of this key in the SNMP Tool section.
-
Run SNMP tools using "Run" icon in the top menu SNMP will read variables and load values to columns - you will be able to see the name of the color and the corresponding ink level.
-
As you can see on the screen, colors match the index, based on this information you can create monitoring pack.
Creating an alerting rule based on SNMP variables.
- Enter to Alerting Settings (Tools->Alerting&Reporting->Settings)
- Create a new Monitoring Pack.
- Switch to Alerting&Reporting and Add alert.
- Select SNMP from the left menu, and use
- Click on "Select Counter and then on "Select from MIB" button.
- Type "supplieslevel" in the search box.
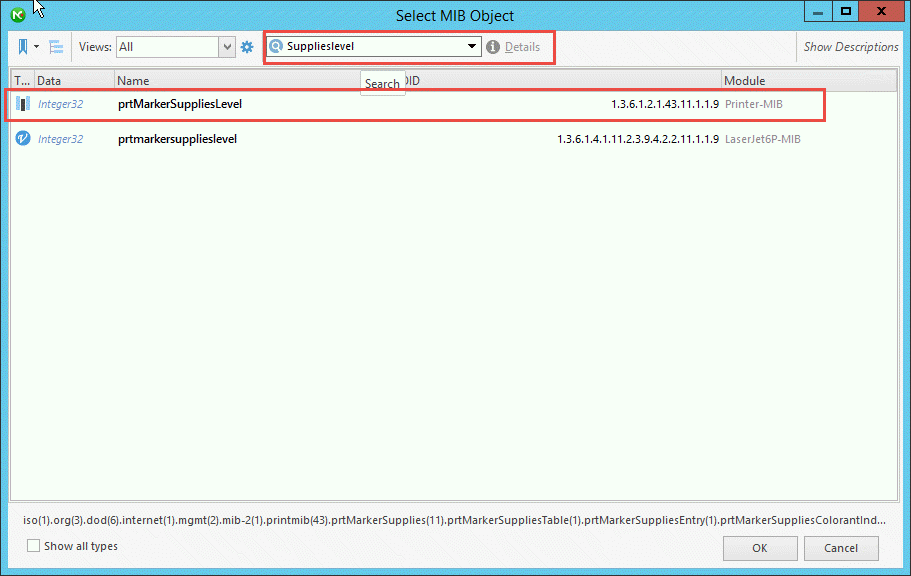
- Select prtMarkerSuppliesLevel from Printer-MIB module and press OK
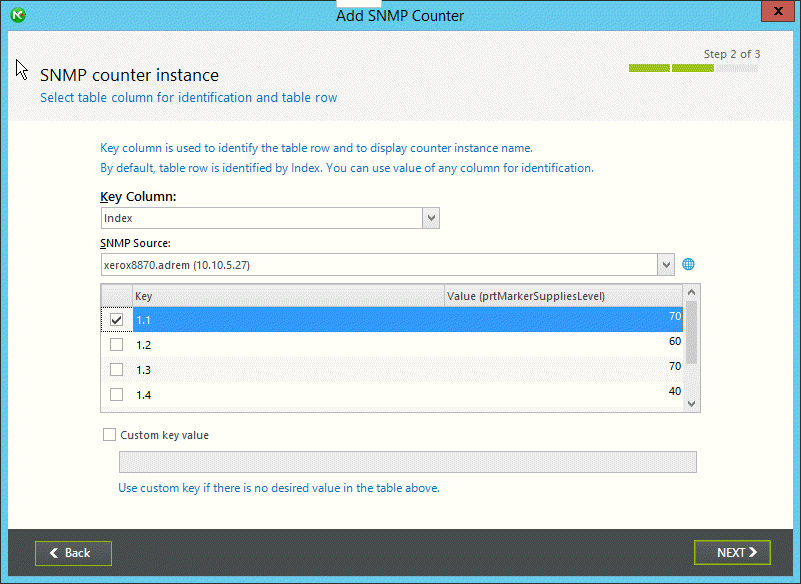
- Make sure that the "Value from single row" is selected, and press Next
- Select your printer as SNMP Source and select firs Key (1.1) - according to the index which is loaded to IP&SNMP Tools, the first key (1.1) is Cyan
- Press Next, and then press "ADD"
- Change description to "Cyan ink level < 10%, change facing of ">" to "<", set "10" as threshold and press on the "OK"
- Repeat steps from 3 to 11 for other ink colors. (If you are not sure which index represents which color, use IP&SNMP Tools)
- After all monitoring rules are added, select "Assigned to" from the left menu, and add your printer to the list.
Creating View with a visual representation of ink level.
- Create custom view (Click on File->New->View->Blank Map)
- Right-Click on the map view, hover over "insert" and then "node", add your printer.
-
Again Right-Click on the map view, hover over "Insert", then select "Data Widget" and choose your desirable widget type (e.g. Value with bar)
-
In Widget Properties:
- Widget menu: Select Value with bar
-
Data menu:
- Add Printer as the selected node
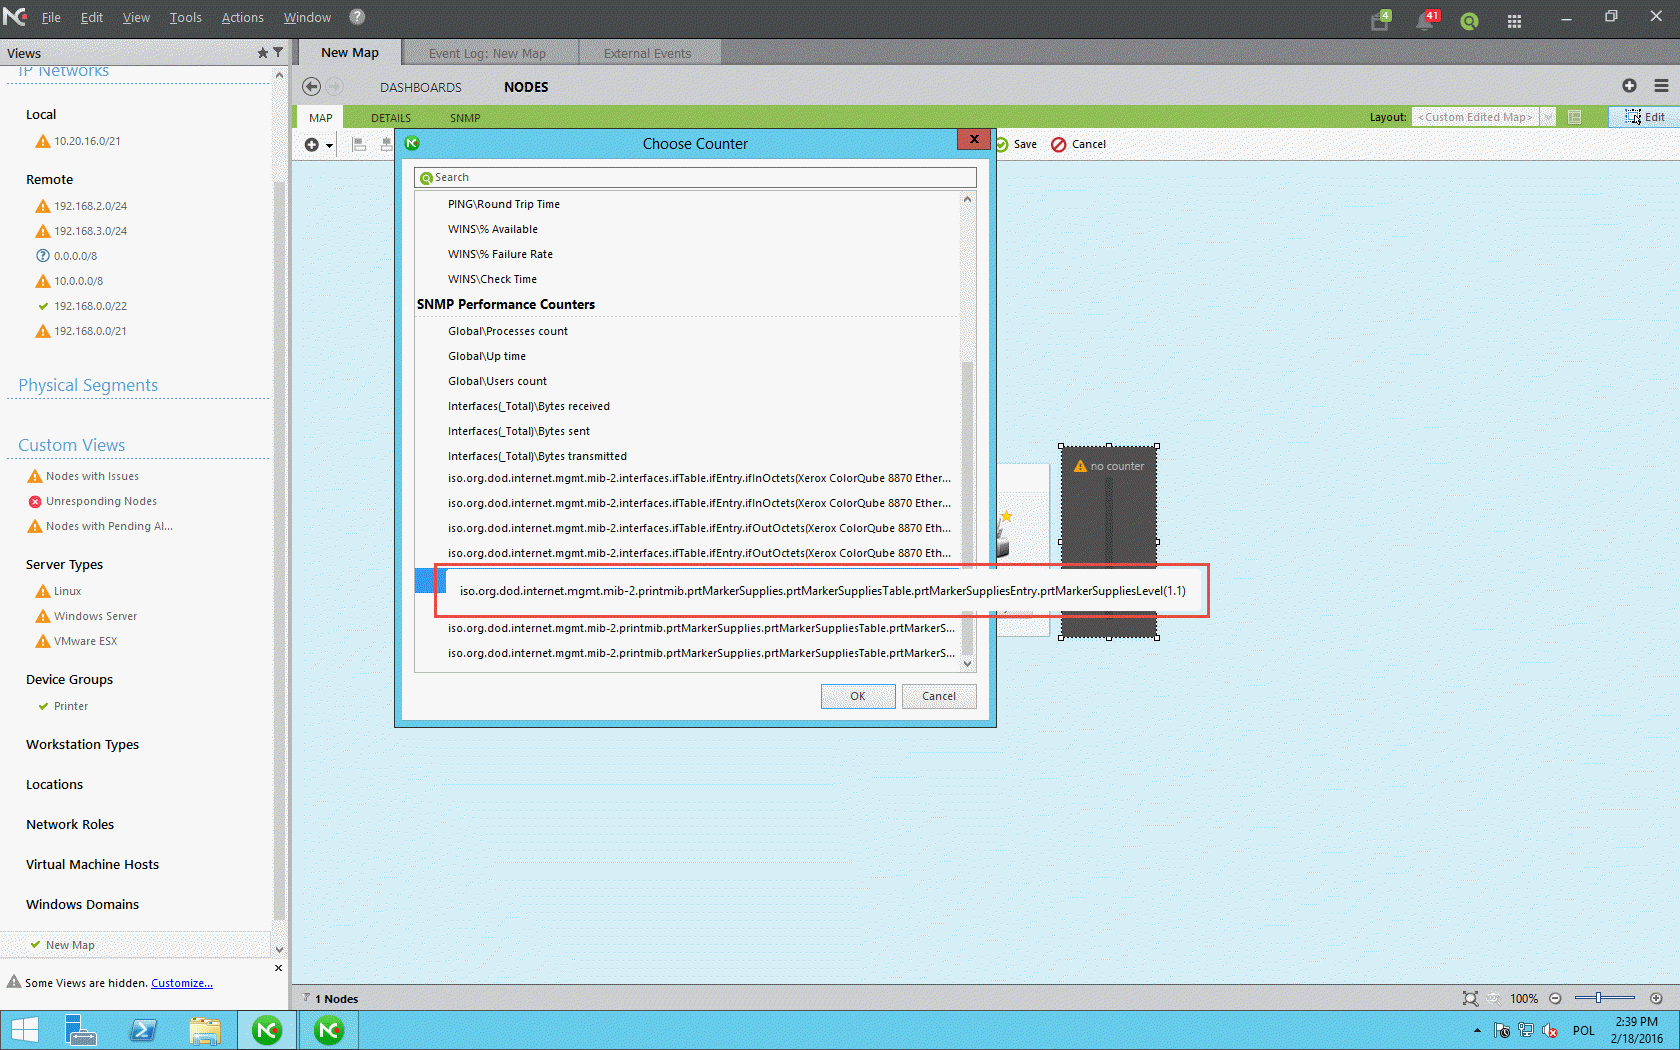
- Counter: Currently Monitored on Selected Node: Select one which represents Cyan (1.1)
- Display units: Percentage.
-
Appearance Menu:
- Vertical Layout.
-
State menu:
- Caption: "Cyan level"
- OK: from 100 to 70
- Warning: From 70 to 40
- Critical: From 40 to 0
(You can select your own thresholds)
Close Widget properties and redo step 3 and 4 for remain colors.
Finally, your view should look like this:
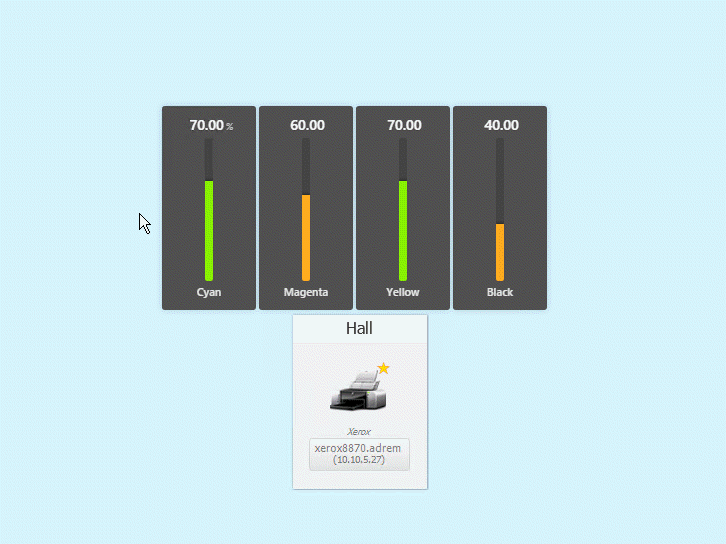
Please note that you can add other SNMP counters to monitor various things like processor utilization etc.