Adding new counters to Top Charts
Sometimes you'd like to add a specific chart to the Top Chart view, but the required counter is not monitored yet. This article will show you how to do it.
Top Charts is a powerful view that gives you insight into counters' values across multiple nodes. For instance, you can check which node's processor is most utilized, or which node has the lowest free disk space.
This article will show you how to add a new counter that is not monitored yet to Top Charts. In this example we will use a Windows performance counter.
Adding new counter to Top Charts view.
The simplest and shortest way to configure a new counter to be monitored in NetCrunch is to use the Performance Views.
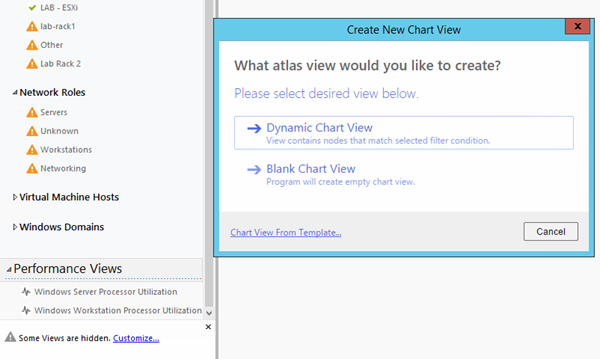
To do that, scroll down in the Network Atlas Tree, right click on the Performance Views and select NewChart View, then choose Dynamic Chart View.
Set the name of the map in the top left corner, then click on the " [...] " button on the far right of the screen under the performance counter.
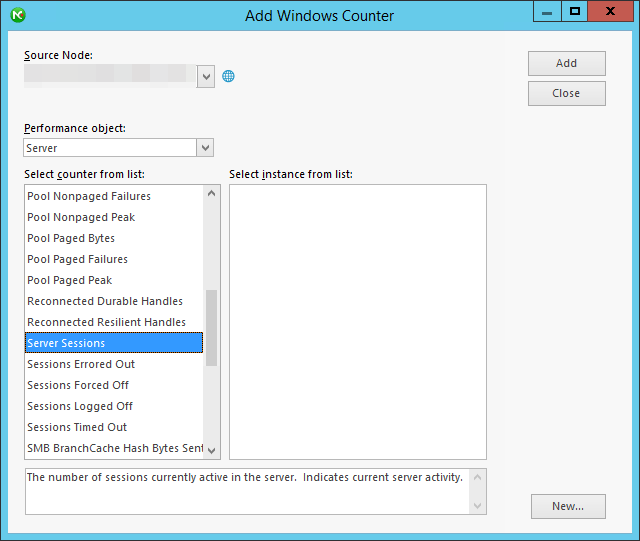
This window allows you to create views of already monitored counters, but for the purpose of this article, we will create a new counter. To do this, select Add a new counter to be monitored, then select Windows Performance Counters.
This step requires three things to be done:
-
Select the Source Node. This is the node where the new counter will be monitored.
-
Select Performance Object. If you are familiar with Windows Perfmon, this is a group of objects to choose from, for the purpose of this article please select Server here.
-
Choose the counter to be monitored. In our example, we will go for the Server Sessions counter.
After everything is set, it should look like this:
The next step is to set the Filtering Condition for the atlas view that we are creating. It describes what types of nodes will be added to this view. Switch to the Node Filtering tab, where you can add as many conditions as you wish.
For the purpose of this article, the simplest condition that we will add to all of our Windows Server nodes is:
Operating System is equal to Windows Server
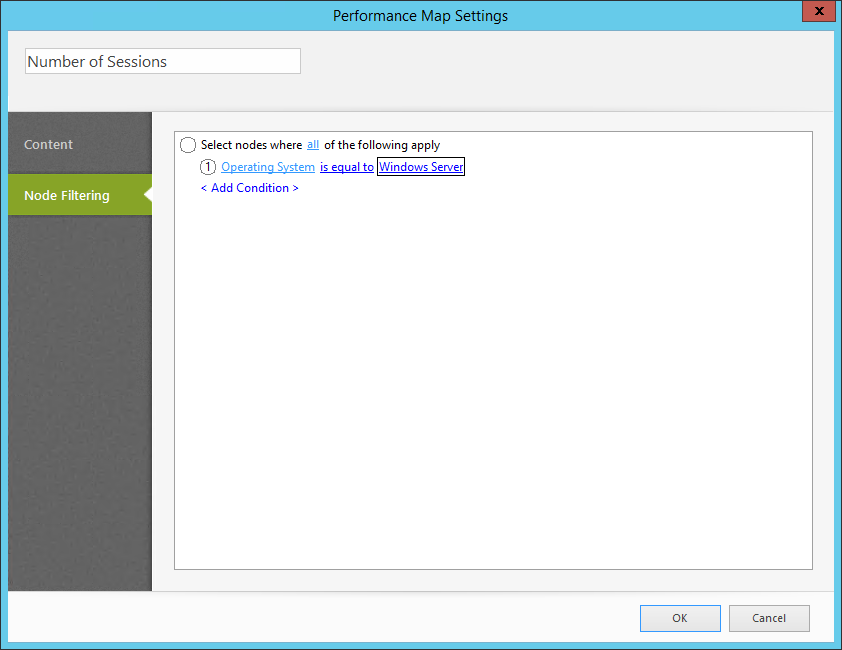
When you click OK, the chosen counter will be added to every Windows Server in your Network Atlas, and NetCrunch will monitoring it right away.
Creating a Top Charts panel
As soon as NetCrunch is monitoring a newly added counter, it is possible to use it and create a new Top Charts panel.
- Click Network Atlas in the atlas tree, then select Dashboards and click Top Charts.
- Click the + icon in the far right section of the screen, hover over Top Chart and select
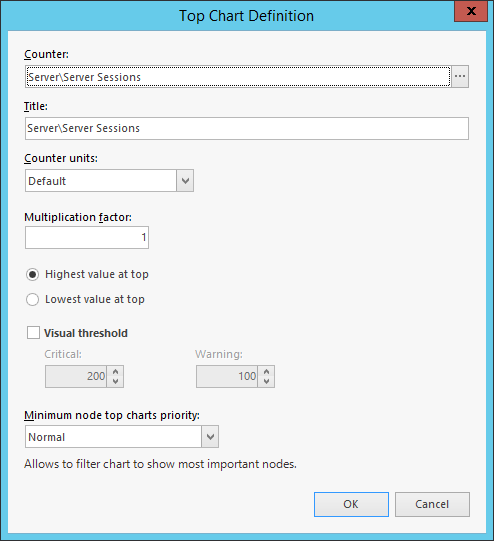
. - Click on the [...] icon in the Top Charts Definition window next to the counter, use search to look for the "Sessions" phrase, then expand Server and select Server Sessions
Now NetCrunch will start showing these values in the new "Top Charts" panel. Click OK to save.
Please note that the default monitoring time in NetCrunch is 5 minutes, so it might take a few minutes for NetCrunch to collect data and start displaying it in the Top Charts view.
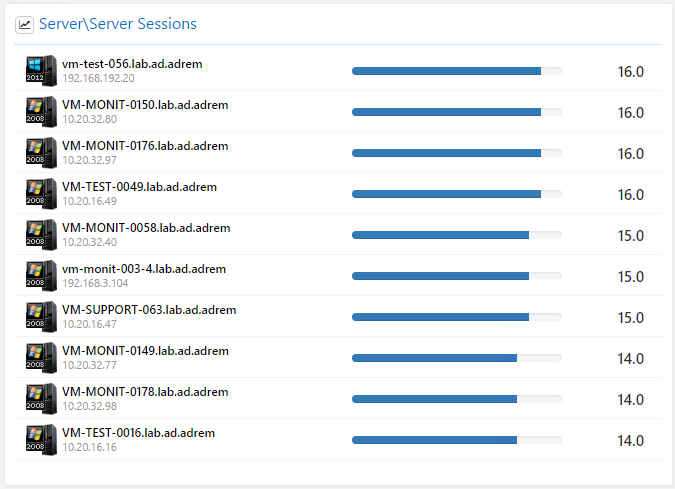
The Result
The Top Charts tab will now include the new counter of your choice. When looking at this view from the Network Atlas level, you can see which Windows Servers have the highest number of concurrent sessions.
This is the fastest way of adding a new counter to be monitored in NetCrunch. If you want to be alerted about specific counter values, you need to create an alert condition for this counter, for example setting a threshold value for it.