How to start monitoring of new SNMP device with NetCrunch
Is your device monitorable? Read the article to learn how to approach configuring monitoring for a new device.
SNMP is a mature, foundation monitoring protocol commonly supported across most IT infrastructure and devices: Servers, Operating Systems, Networking, Storage. It's been around forever (1988), it's efficient and light on networks (UDP), and there's broad support for most hardware platforms and IP-based devices. Where's the catch?
SNMP Support and Brand
While venerable and capable, the value of SNMP should be evaluated on a per-device level. Manufacturers have, at their discretion, either embraced or abandoned it as part of their product strategy. It is safe to say that if a manufacturer of a device does not provide open monitoring access via SNMP or API, then you will using their product-exclusive tools or primitive/event-based integrations (trap, syslog, email) for managing and monitoring. This practice is mostly seen among the storage vendors, and it forces the cascading alerts between management and monitoring systems. Unavoidable you say... take precaution I recommend.
Monitoring protocol support by the manufacturer should be a primary concern and addressed as part of your Datacenter's Product Life Cycle. More simply put, your monitoring standards should have a say in which products should be considered. SNMP support is a clear indicator that a manufacturer has a 'play-nice-with-others' approach. Brands that support open monitoring standards integrate easily into your monitoring strategy, and as a result, represent a lower cost of maintenance and ownership.
Importing MIBs to expand SNMP Monitoring
ToolsSNMP MIB Database & Compiler
Import, update, discover and build custom SNMP monitoring strategies within NetCrunch
With a pre-compiled MIB library containing 8500+ MIBs, from 200+ device manufacturers, NetCrunch provides a streamlined utility and an easy path to extending our 'out-of-the-box' SNMP support.
Browse
Knowing what to monitor on a device often starts with understanding what metrics are available, especially if the device or device brand is new to you. Discover and identify new metrics and counters by using the MIB Browser feature. Navigate by the tree, defined variables or defined traps. Having trouble finding a particular MIB module? Use CTRL+F to search the library.
BrowseRMB on mib objectDetails
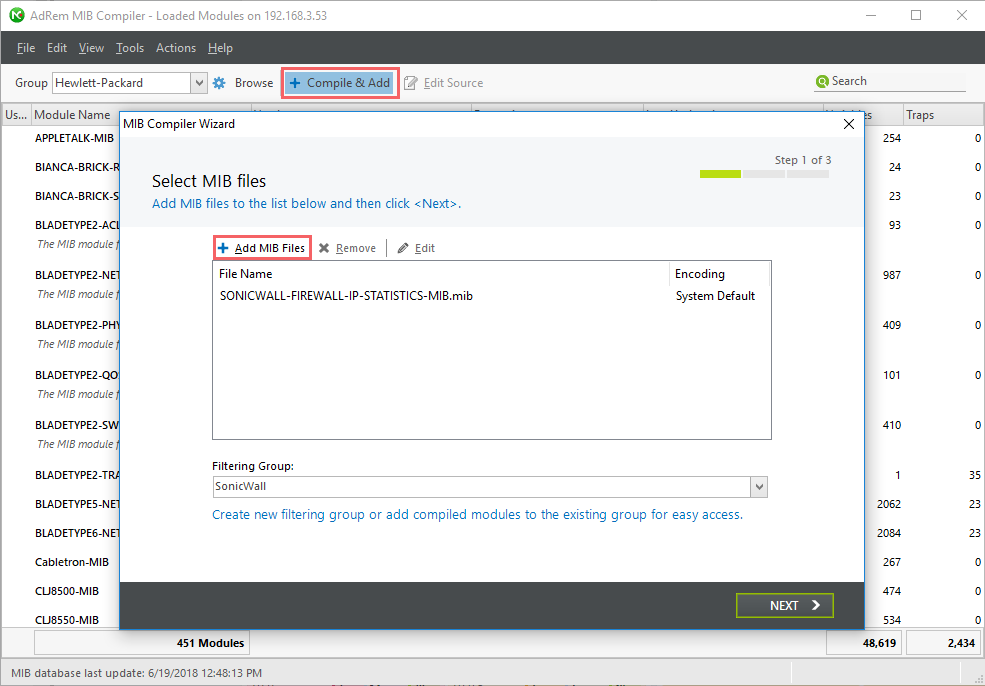
Compile & Add
MIB files are matched to the device firmware/OS and will reflect the latest available metrics that match the device's feature set. Simply download the device MIBs and navigate to your target files. Be sure to designate, or add, an appropriate filter so you can find your imported elements later.
Compile & AddAdd MIB Files
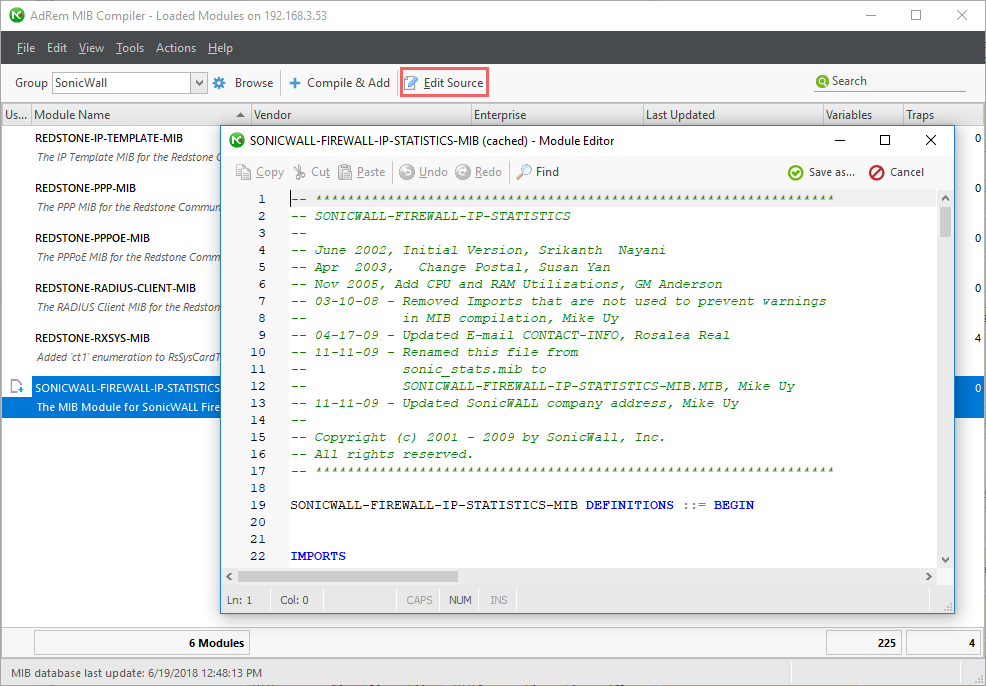
Edit Source
One of the challenges of importing MIBs can be the varying quality of MIB file content. NetCrunch makes easy to modify the MIB source file when import errors occur.
Edit Source
Manage your MIB Filters
Easy management of MIB files and MIB filters.
Edit
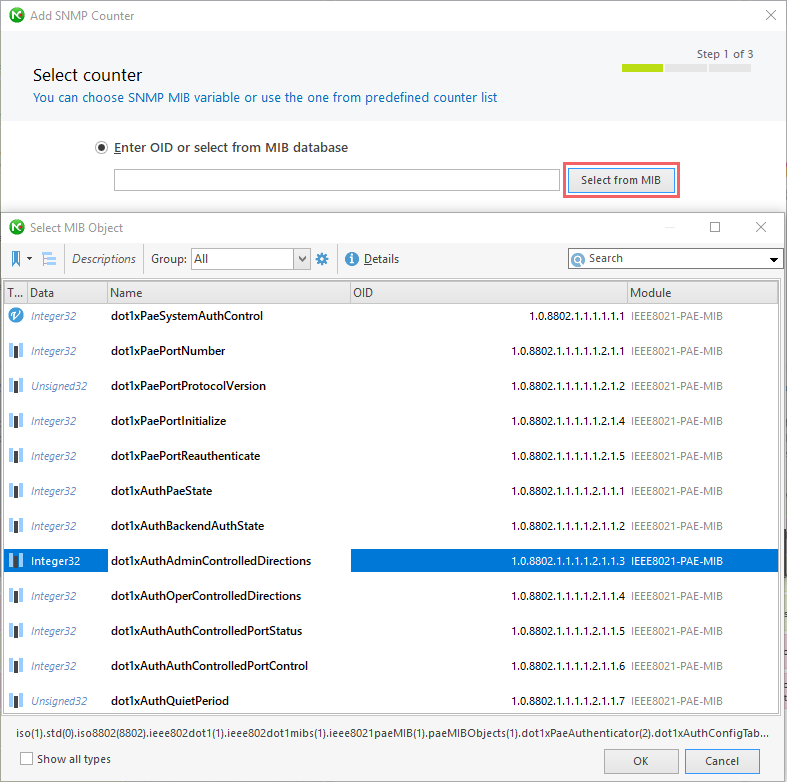
Add SNMP Counter > Select from MIB
Once you import your MIBs (update, edit, browse), you can easily access the complete SNMP library from within NetCrunch. Add SNMP Alerts or Data Collectors to Monitoring Packs (policy), or individually in a device's Node Settings: Monitoring > SNMP > Custom Monitoring Pack.
Evaluating device MIBs
Taking a quick look at raw device MIB files usually confuses more than it helps, that is until you import the MIB file into a usable database or library. NetCrunch provides this functionality:
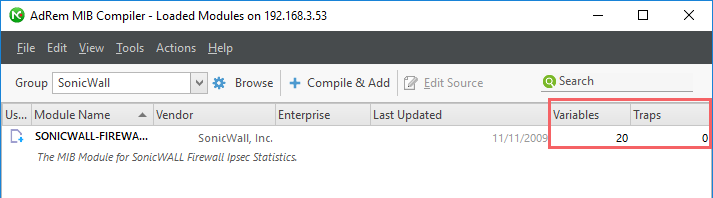
As you can see, the MIB offers two fundamental elements. 1. A mapping (OID) to a metric, counter or config component also known as a variable. 2. A mapping (OID) to an event description describing what just happened, a trap.
While both are vital to understanding the status of a device, trap-only support is often used to represent full SNMP support. Devices that do not present variables in their MIBs offer only event-based interpretation rather than metric-based performance views.
Syslog & Traps when SNMP support is 'light'
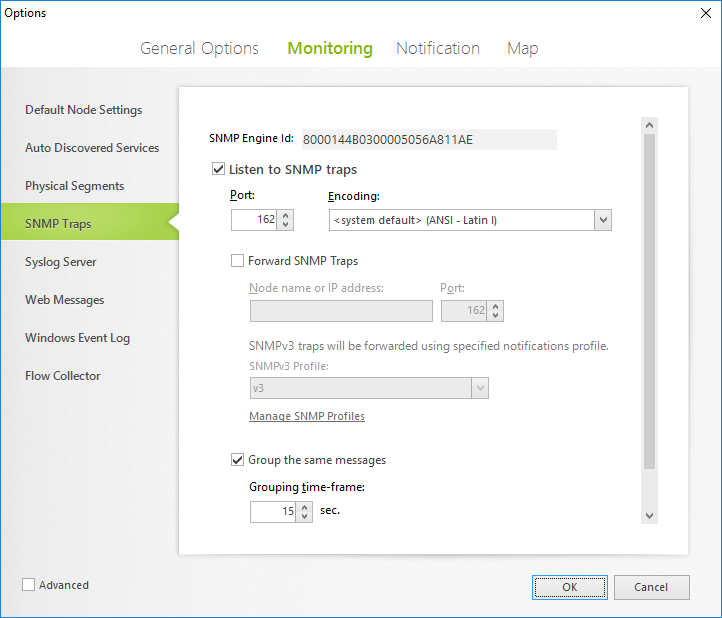
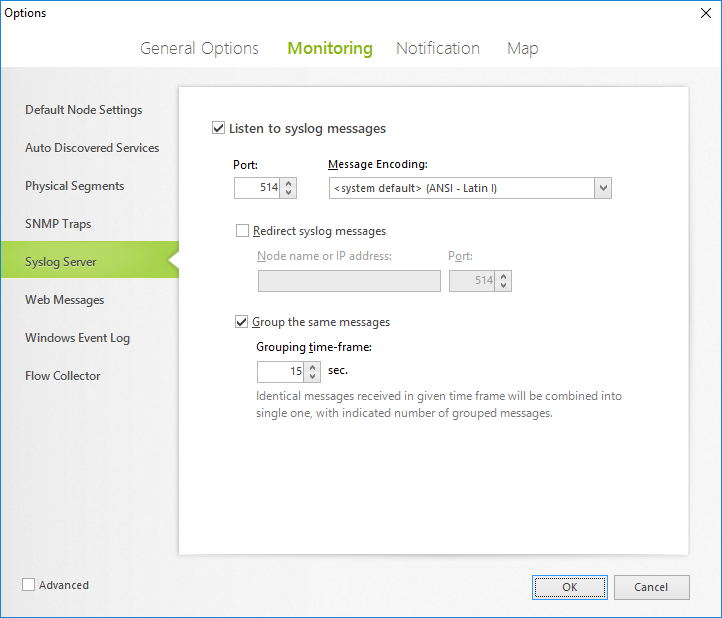
For devices that offer little in the way of counter-based MIBs, your primary option is to leverage the device's event generation support to alert you. It is configured on the device as a 'push' to NetCrunch, and can easily be incorporated into NetCrunch. Syslog and trap functionality are pre-configured on default ports and are hot out of the box.
ToolsOptionsMonitoringSNMP Traps
OR
ToolsOptionsMonitoringSyslog Server
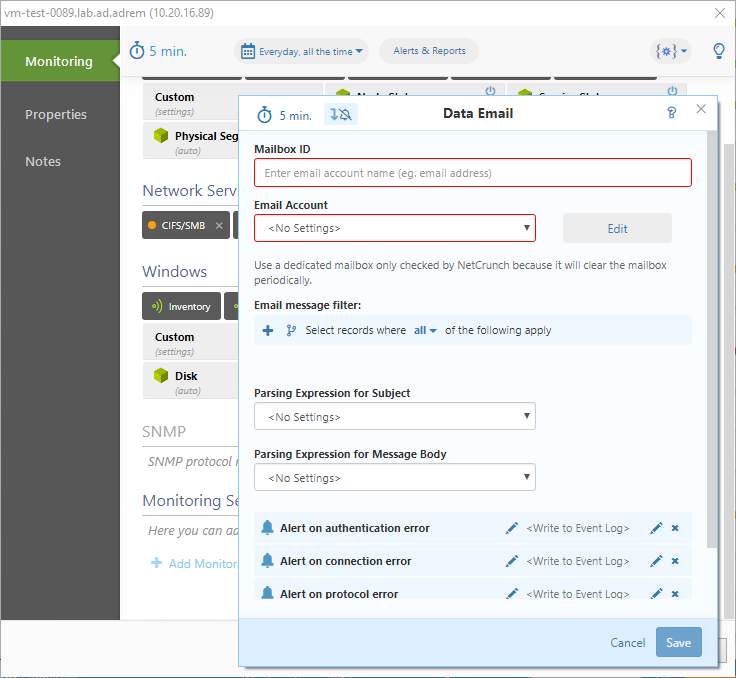
Email as a listener of last resort
So your storage device doesn't support SNMP polling? You can easily integrate email alerts into NetCrunch via the Data Email sensor. This integration provides event/alert consistency between the device and your monitoring strategy.
Leverage Manufacturer OS Images
Yes, I'm talking about the stack of disks that came with the server that is still in the box. The significant benefit is these install disks result in a pre-configured OS or hypervisor that includes all drivers and upgraded agents for SNMP as well as support for out-of-band monitoring (iDRAC, ILO, etc...). Installing from the manufacturer OS images streamlines and standardizes your server configurations, while ensuring all the necessary integration between your server's BMC and SNMP are in place. This procedure will provide the complete SNMP monitoring experience as is essential if you plan on using the Dell OpenManage or HP Insight Manager monitoring packs.
Leverage NetCrunch's unlimited metrics licensing via Data Collectors
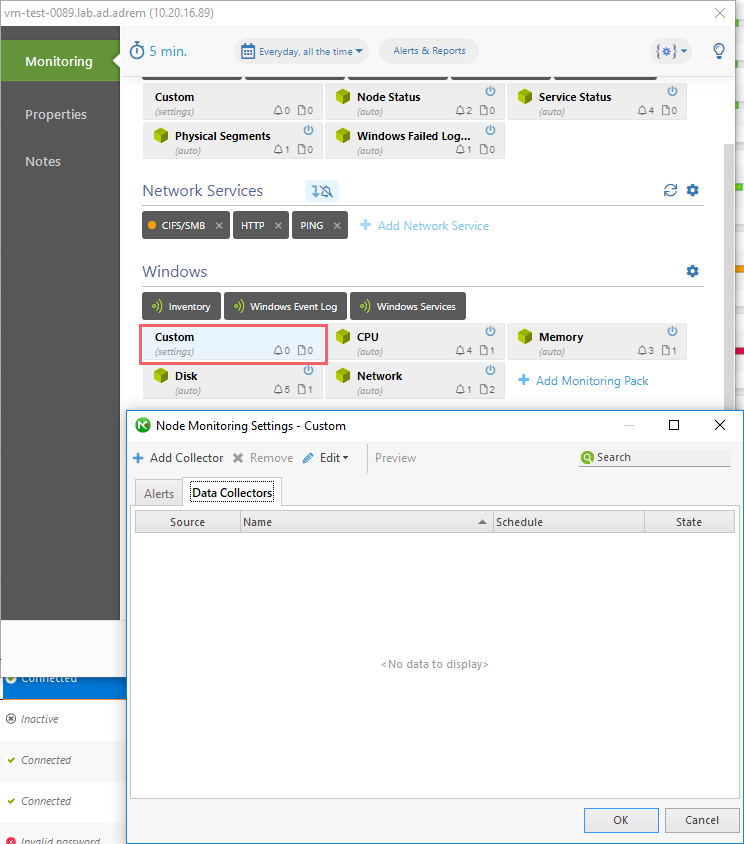
For devices that embrace SNMP, the challenge is often 'death-by-detail.' With so many possible metrics or counters available, you may be asking what should you watch. In this scenario, I recommend that you leverage Data Collectors as an expression of your interest. MIBs are usually tweaked and adjusted with OS and firmware revisions, so a simple process of keeping your MIB database consistent with your hardware versions is a Best Practice. Collectors are available under Node Settings, as well as Monitoring packs. Do your exploratory collection at a device level first (discovery, then progress to Monitoring pack (policy).
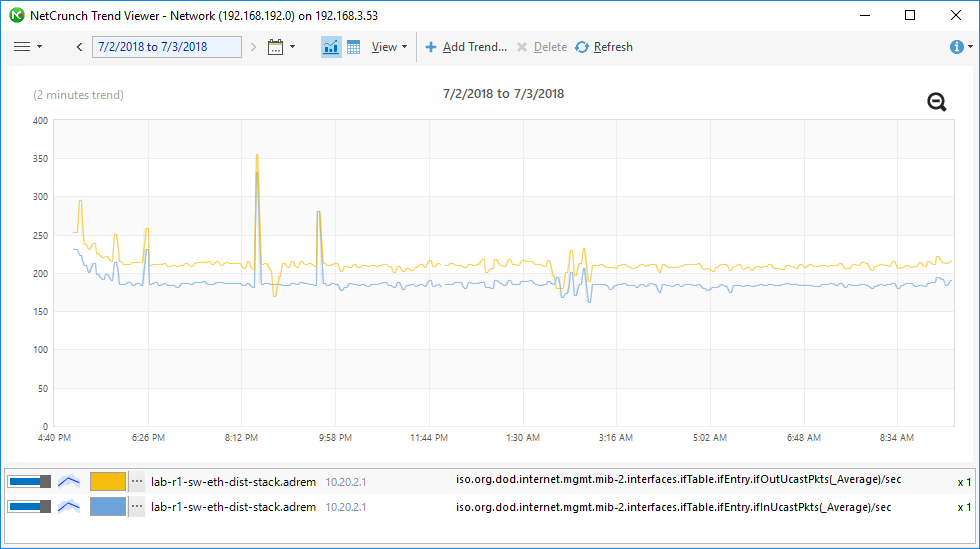
Collectors introduce counters into the trend record without associating them with an alert or event behavior, allowing you to interpret and assign a value to metric. As a real-life example provided is unicasting data, 'collected' without an alert, that revealed a broadcast storm in our Lab. Who knew? Me, and that's because I was looking.
- [05.04.2017] Using NetCrunch to track Port Security status of Cisco switches.
Cisco port security is a great feature to make your network safer. Learn how to configure NetCrunch to display the status of Cisco Port Security on the switch interfaces.
- [21.04.2016] Monitoring External Events in NetCrunch
Using multiple tools to catch every SNMP trap or SYSLOG message might be hard. NetCrunch simplifies this task with the External Events window and lets you fine-tune your log and SNMP monitoring:
- [07.04.2016] Optimizing SNMP Monitoring in NetCrunch
This article will explain reasons for most common SNMP monitoring problems, describing ways to fine-tune SNMP monitoring settings in NetCrunch. Learn how to monitor without stressing your SNMP device.