Linux/Unix Server Monitoring
Monitor your Linux servers comprehensively and automatically using NetCrunch. Skip basic configuration of monitoring strategies by leveraging NetCrunch's OS identification and automatic Monitoring Pack assignment. Extend your Linux monitoring strategies with sensors.
Linux Monitoring simplified
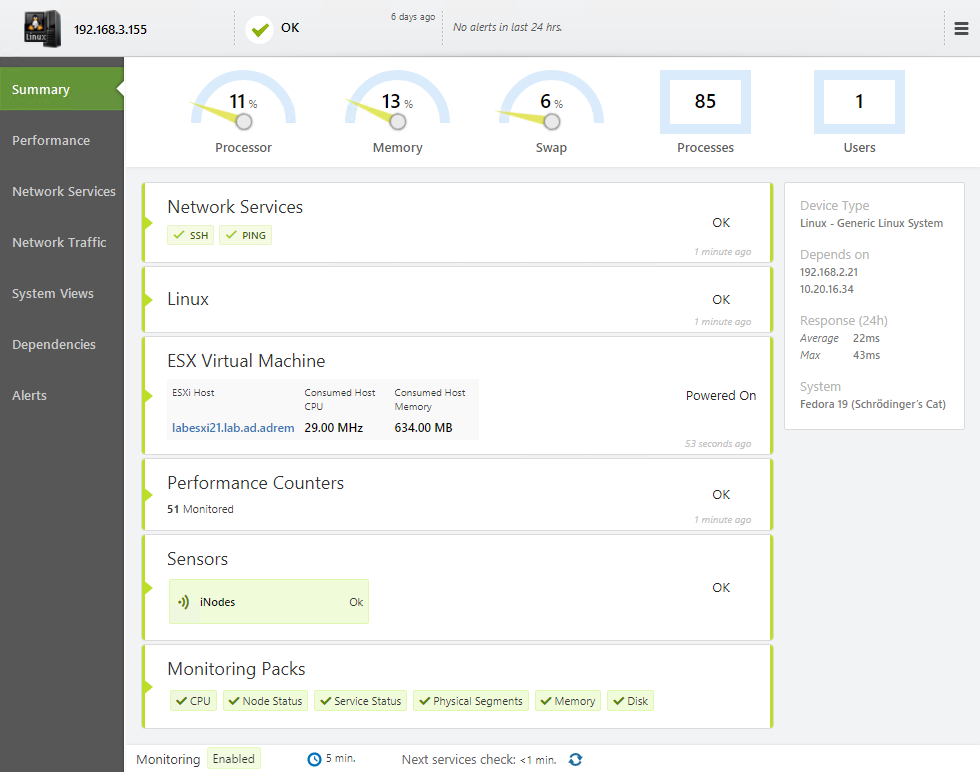
NetCrunch monitors your Linux systems and virtual machines with the same ease typically found in Windows Servers. With extra credential accommodations, such as SU, SUDO, and support for Private Keys, Linux System Administrators can access system metrics natively, and without the use of an agent, Monitor your Linux/Unix infrastructure automatically via Monitoring Packs that self-apply during device discovery. Gain easy access to Linux/Unix fundamental system counters, and bounce into Putty when the need for command line arises. NetCrunch Linux/Unix monitoring packs provide effortless access to:
- Traditional System metrics, such as CPU, Memory, Network Interface Cards, Disk partitions
- Processes
- Open files
- TCP Connections
- Unix Sockets
Monitor Linux delivered services directly
NetCrunch greatly simplifies issue detection by native service protocol hand-shaking. During device discovery, a system's externally presented services are evaluated against NetCrunch's Auto-Discovered Services list, providing a complete view of service and application availability. This enables a fundamental understanding of device availability based on service role, rather than whether it simply exists on your network. While bouncing ICMP packets off a device can tell you if it exists, it provides little detail on whether a device is capable of performing its job. NetCrunch's external service validation confirms a service's valid protocol specific response. Custom services are extensible and easily created, providing support for non-traditional ports and protocols. For Linux Administrators supporting DevOps and custom applications, NetCrunch provides full request-response with pattern matching in both text and binary (hexadecimal). Expand your service monitoring strategy into the non-traditional areas by:
- Simple TCP port service definition
- Standard service port remapping
- Custom service checking via protocol-specific request/response using TCP or UDP
Linux sensors
Linux Servers are often deployed in an application/database or a file-based services role due to their reliability and reduced cost. NetCrunch's sensor portfolio includes dedicated Linux/Unix sensors that supplement SSH based monitoring packs, as well as multi-protocol/multi-condition sensors that conduct evaluations of the sensor target with a single polling event. By combining monitoring packs and traditional/custom service handshaking with NetCrunch's portfolio of Linux/Unix sensors, Linux administrators have all the necessary tools to quickly build comprehensive monitoring strategies for evolving DevOps environments supporting open source operating systems and application delivery platforms. Linux sensors include the following:
-
SSH, Filesystem
- iNodes: space used/total/free, % free on file system inodes
- SSH Remote Ping: ping from target to any other target
- System Uptime: total uptime, signal system reboots
-
HTTP/S
- Web Page: authentication , page load statistics, content checks, resource errors
- Basic HTTP: GET, HEAD or POST, response code validation
- REST HTTP: request with response data parsing, validation, metrics
- Generic Agent: listener to receive external REST pushes, data parsing of results for counters & conditional alerts
- SSL Certificate: checks certificate properties, encryption levels, expiration
-
Oracle, PostgreSQL, MySQL, MariaDB, ODBC
- SQL Query - Object: returns a single row, test authentication, counts records, defines a single metric, supports multiple conditions.
- SQL Query - Data: returns multiple rows/columns, defines multiple metrics, supports multiple conditions
-
FTP/S, HTTP/S, SSH/Bash, sFTP, CIFS/SMB
- File: presence, size, authentication, modification date
- Folder: presence, size, authentication, modification date
- Data File: file load and data parsing, validation/alerts on metrics and extracted values
- Text File: content, authentication, file size, modification date, exists, empty/not empty
- Text Log: performs incremental log analysis. Full log analysis when using FTP or HTTP
- [08.02.2019]SNMP monitoring features in NetCrunch
There is a lot of the ways of how we can monitor the condition, performance and availability of the devices with available SNMP service running on them. Learn how to gather the counters and states from various devices with the tools available in the NetCrunch.
- [06.07.2018]Analyze Windows failed login events with a custom log view
Use NetCrunch to monitor and display failed logon activity on all Windows machines in your network by monitoring Windows Event Log.
- [12.02.2018]Process Monitoring with NetCrunch WMI Sensors.
Learn how to configure a node-specific WMI Object sensor to monitor a specific Windows process and generate an event when the process is restarted. This sensor-based monitoring strategy leverages the uniqueness of PID, against the generic name of a process.