Monitoring of Windows Shared Cluster
Monitoring Windows Shared Clusters can be achieved in many different ways. This article demonstrates the power of NetCrunch scripts combined with data parsers to show you how easy and fast it is to setup NetCrunch to collect data about free and used space on clusters
Pre-Requisites
- Machine with Cluster Shared Volume installed
- User with rights to login to the machine and access to Cluster Shared Volume
- NetCrunch Server added to the trusted hosts on the machine with Cluster Shared Volume (Remote invoke-command should be available from the NetCrunch Server machine)
The Script
Included script uses cmd-let to access Cluster Shared Volume information such as:
- Name of the cluster
- Free Space
- Used Space
- %Free
- Size
By default, information about all clusters is collected.
$objs = @()
$c = Get-ClusterSharedVolume
foreach ( $csv in $c )
{
$csvinfos = $csv | select -Property Name -ExpandProperty SharedVolumeInfo
foreach ( $csvinfo in $csvinfos )
    {
        $obj = New-Object PSObject -Property @{
        Clustername = $Clu
        Name = $csv.Name
        Size = $csvinfo.Partition.Size
        FreeSpace = $csvinfo.Partition.FreeSpace
        UsedSpace = $csvinfo.Partition.UsedSpace
        PercentFree = $csvinfo.Partition.PercentFree
    }
        $objs += $obj
    }
}
$objs | ConvertTo-Json
After executing the script, data is converted into JSON which will be parsed in NetCrunch in the next step
The script should be saved in the place accessible by NetCrunch e.g. C:\scripts\script.ps1
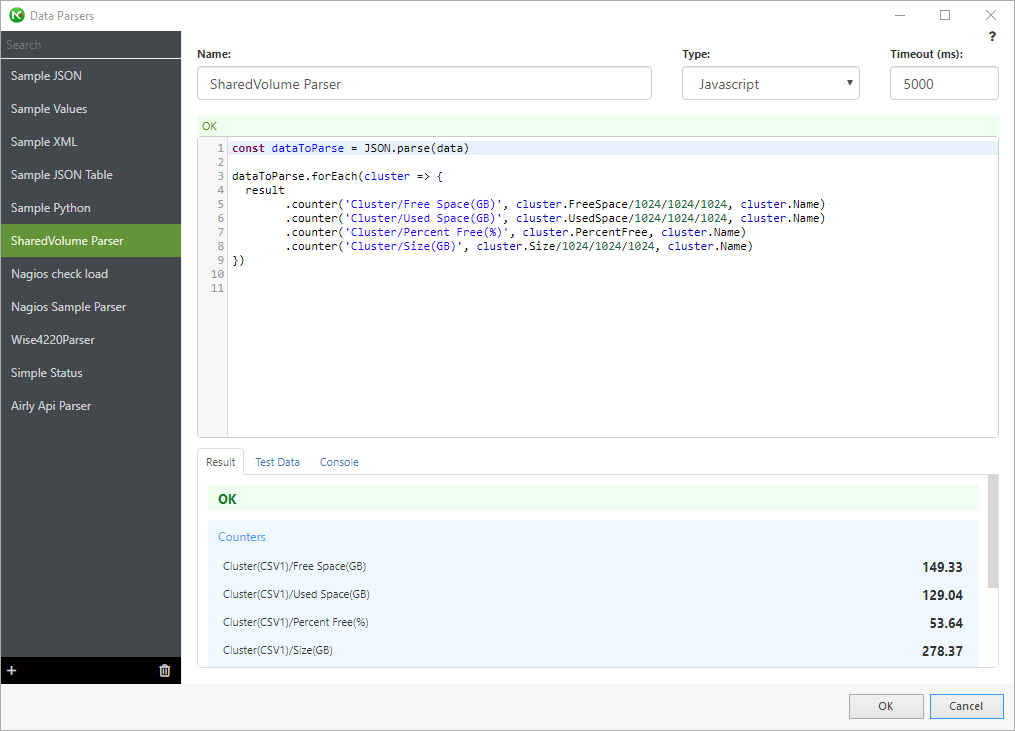
The Parser
The parser is a way for NetCrunch to understand the output of any script, program, file, etc.
Parser below takes data that is yielded by the script and transforms it into counters that can be understood by NetCrunch.
Since the data output of the script is JSON it's very easy to transform it into the counters.
Use Javascript as the type of the parser
const dataToParse = JSON.parse(data)
dataToParse.forEach(cluster => {
  result
  	.counter('Cluster/Free Space(GB)', cluster.FreeSpace/1024/1024/1024, cluster.Name)
  	.counter('Cluster/Used Space(GB)', cluster.UsedSpace/1024/1024/1024, cluster.Name)
	.counter('Cluster/Percent Free(%)', cluster.PercentFree, cluster.Name)
  	.counter('Cluster/Size(GB)', cluster.Size/1024/1024/1024, cluster.Name)
})
If you wish to know more about parsers, visit this Data Parsers page.
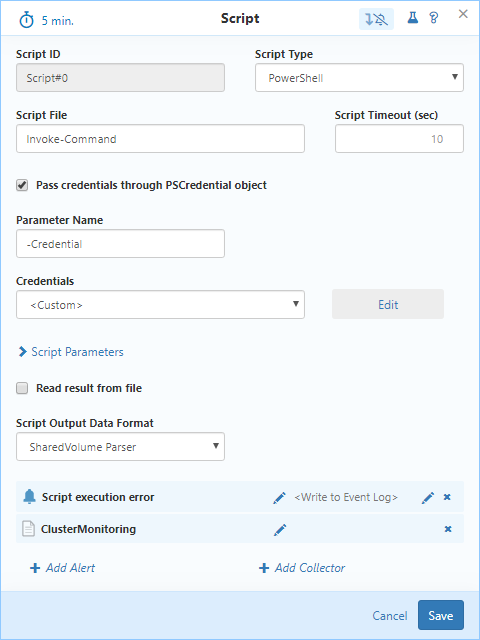
Sensor Configuration
- Script type: Powershell
- Script File: Invoke-Command
- Check 'Pass credentials through PSCredential object' - select proper credentials here (mentioned in pre-requisites)
-
Click on Script Parameters and provide two params.
- -FilePath path/to/your/file
- -ComputerName DNS name of computer with Cluster
- Set output data format to parser you've created in the previous step
Right now it's possible to check if the script works - click on the 'test' icon in the top right corner of the window. If the test is successful you should see output similar to the screen below:
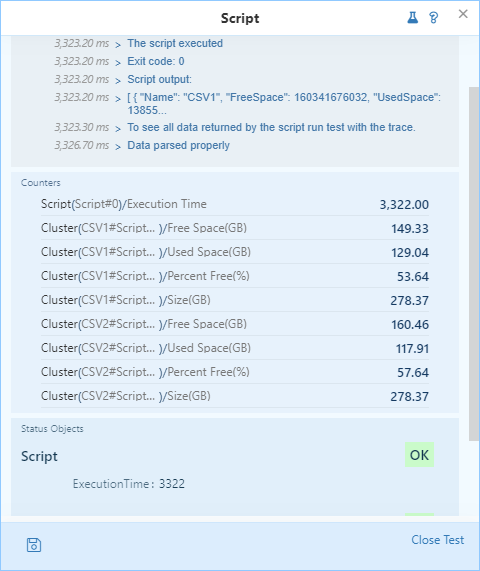
You should be able to see available counters with instances named after your cluster names.
Result
The last step is to either add collectors and/or alerts that are based on the counters. To do that - click either on 'add collectors' or 'add alerts' and follow steps of the 'editor' window.
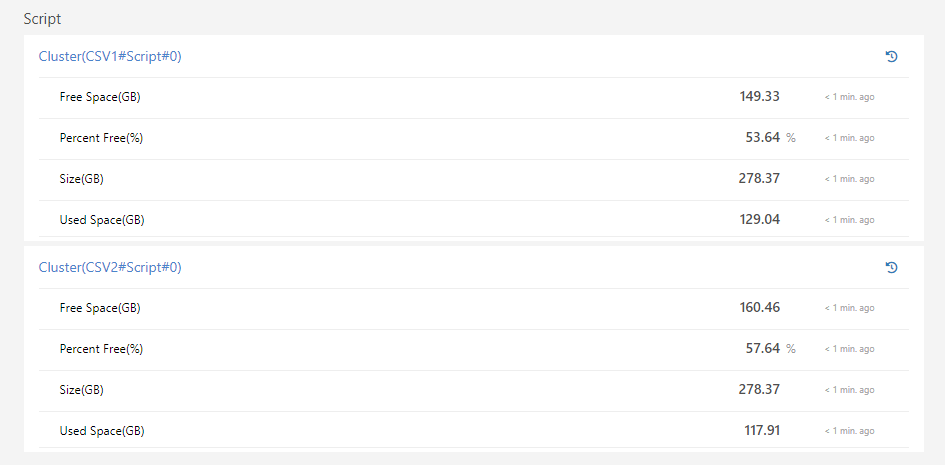
If everything is configured properly - monitoring should start and data should be gathered by NetCrunch like all other counters.
- [15.03.2020]Windows VPN Monitoring with NetCrunch
Remote work is growing and sometimes indispensable. There is a number of different VPN services that can be used to provide secure access to company networks for remote workers or those traveling away from the office. This article will describe how to set up VPN Monitoring in NetCrunch on the example of Windows VPN
- [26.02.2019] Script monitoring with NetCrunch
Despite huge capabilities of monitoring, NetCrunch offers the possibility of executing and parsing any given script, this allows monitoring almost everything with any script on any machine. This article shows a very simple example of how script monitoring can be used to get data in specific conditions.
- [20.01.2019] Monitoring operating systems - Windows System Views
System views is a powerful tool to see the status of various aspects of the given system in real time. This article will focus on System Views on Windows-based machines
- [12.11.2018] Windows Server Monitoring
Use NetCrunch to monitor Windows Server resources, services, and metrics. Gain control and insight of your Windows Server infrastructure health with full monitoring and trend data collection from the entire Windows Common Information Model (CIM).
- [06.07.2018]Analyze Windows failed login events with a custom log view
Use NetCrunch to monitor and display failed logon activity on all Windows machines in your network by monitoring Windows Event Log.
- [28.05.2018]Monitoring Windows Event Logs for Warnings and Errors.
Learn how to monitor Windows Event Log to receive alerts and notifications when event with specified id appears.
- [12.02.2018]Process Monitoring with NetCrunch WMI Sensors.
Learn how to configure a node-specific WMI Object sensor to monitor a specific Windows process and generate an event when the process is restarted. This sensor-based monitoring strategy leverages the uniqueness of PID, against the generic name of a process.
- [24.05.2016] Correct Monitoring of Windows Processes on multi-core machines
This article will explain how NetCrunch monitors Windows processes and why these values are wrong in perfmon.