Correct Monitoring of Windows Processes on multi-core machines
This article will explain how NetCrunch monitors Windows processes and why these values are wrong in perfmon.
When it comes to Windows monitoring, NetCrunch utilizes Windows Performance Monitor (perfmon) to get the data needed to properly inform a user about the state of the computers in their network.
Understanding Processor Utilization as shown by Perfmon.
Perfmon shows the utilization of processes as a % of CPU. The main reason for complications here is that if we compare data from Perfmon to data from Task Manager, the values may be significantly different.
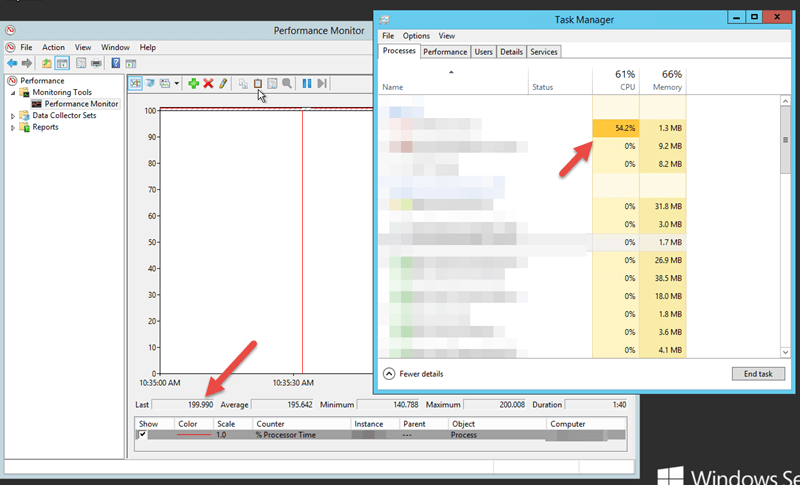
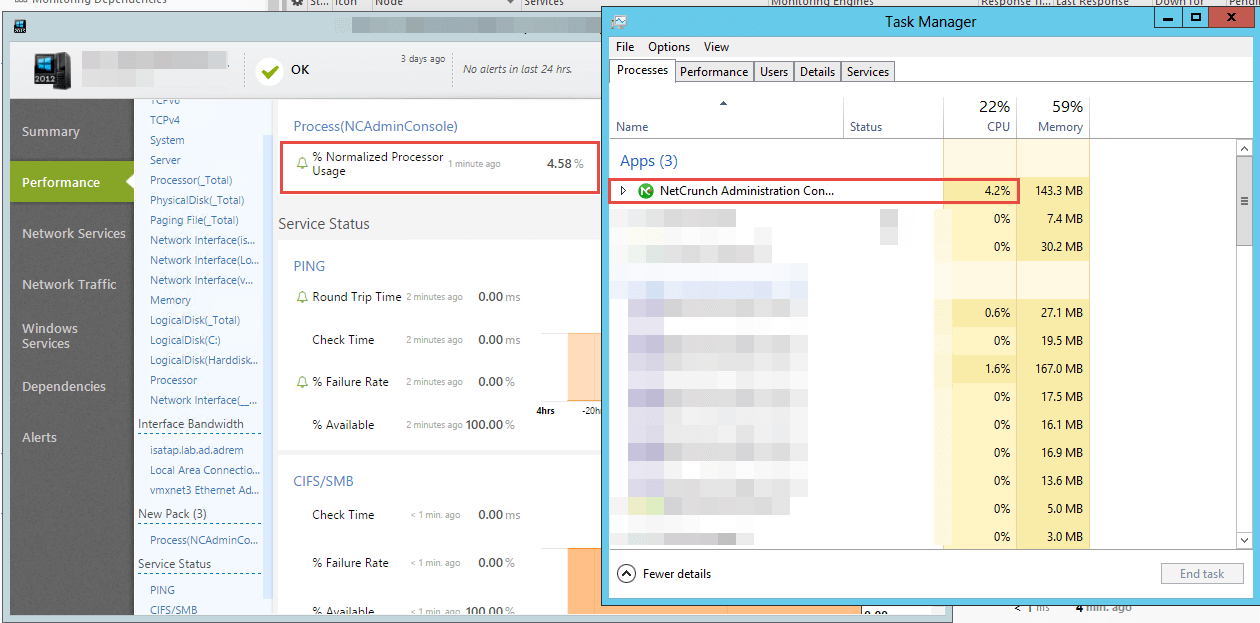
As presented on the screen above, the processor utilization of the same Windows process is monitored in Perfmon and Task Manager. Perfmon shows ~200% - which may look illogical, because processor utilization cannot be more than 100%. On the other hand, Windows Task Manager shows a more "reasonable" value of 50%. What's going on?
The reason Perfmon shows more than 100% is because of the way it was designed. For Perfmon, one core (logical processor) of the processor might be utilized from 0 to 100% and it shows the total utilization of all cores. So depending on how many cores are in the machine, the value of processor utilization can even be 400% (for a 4 core processor)
To sum up: 1 Logical Processor = 100%.
If a test machine has 4 logical processors, utilization of the processor will be 400% at max.
To properly calculate the processor utilization for NetCrunch when we measure it on a multi-core machine, we have added a Calculated Counter named: Process\Normalized Processor Usage which is used to measure utilization for processes.
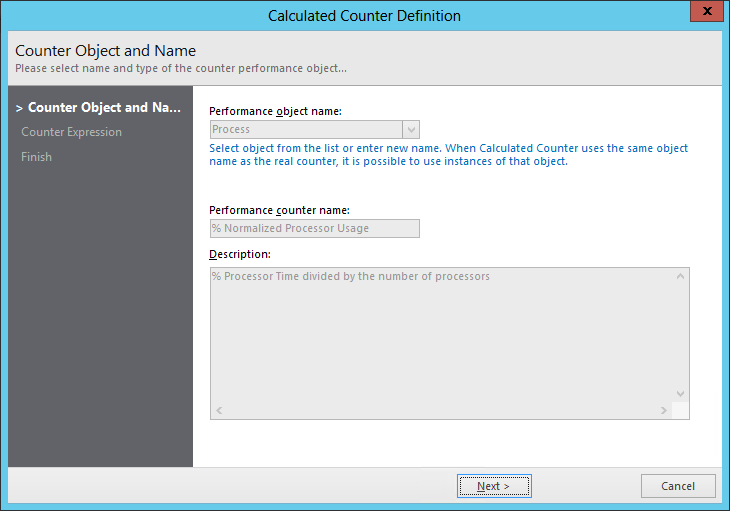
It takes the monitored process and divides it by the number of Logical Processors on the machine.
By doing so, it's possible to display values in a similar way to values presented in Task Manager.
Using Normalized Processor Usage to monitor processes.
Example of adding a process to monitor using monitoring packs.
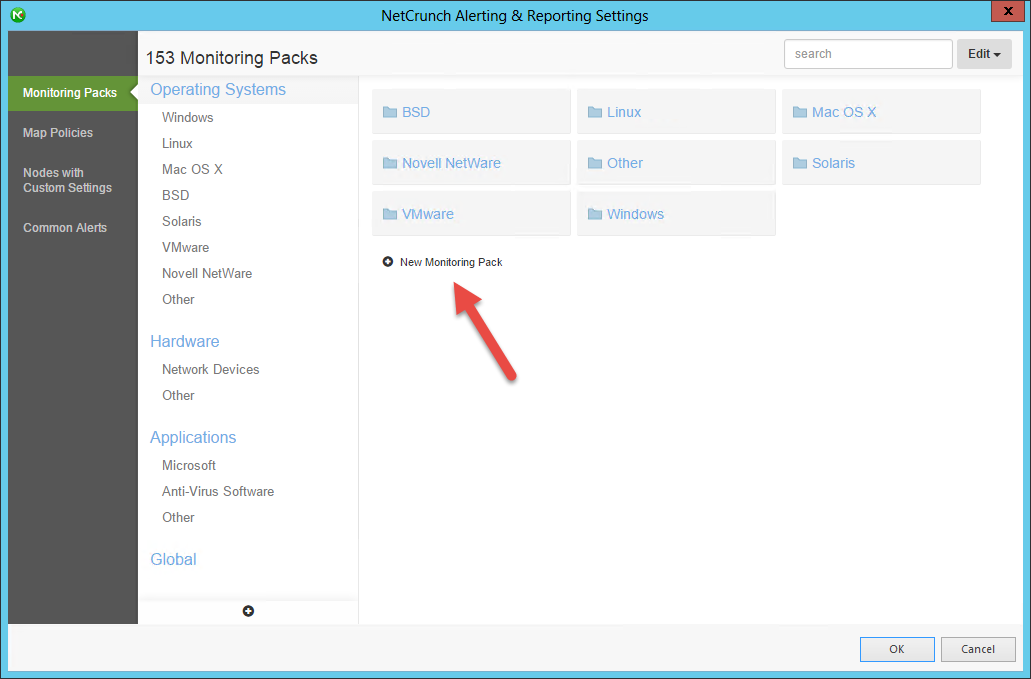
- Create a new monitoring pack (Tools->Alerting&Reporting->Settings, click on New Monitoring Pack)
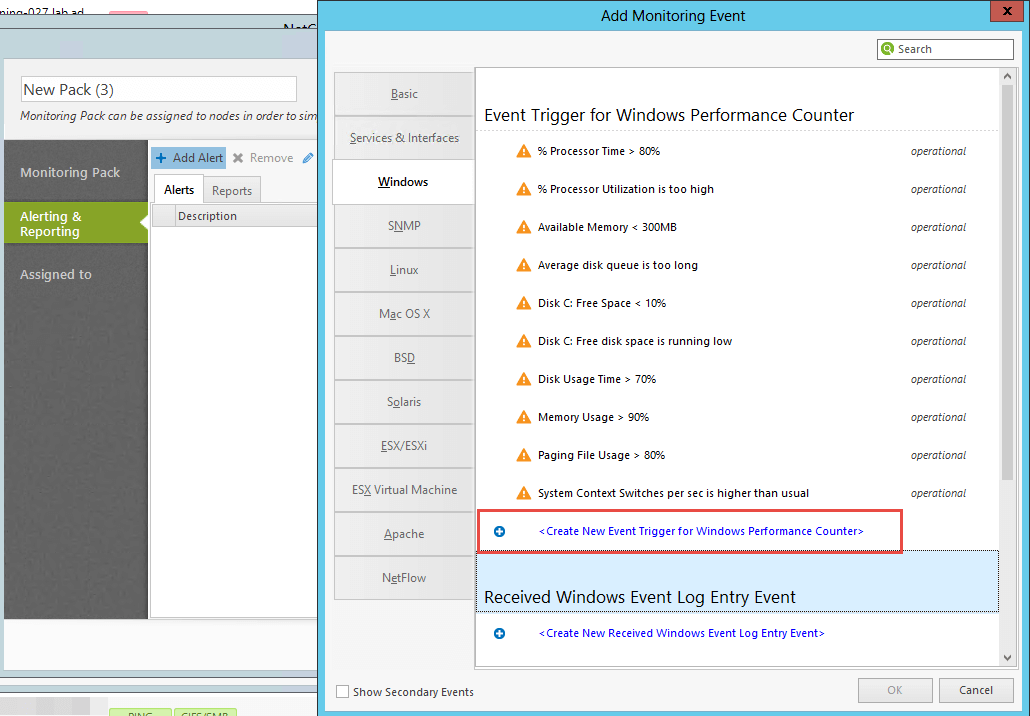
- Switch to the Alerting & Reporting tab and add alert, switch to Windows tab, select
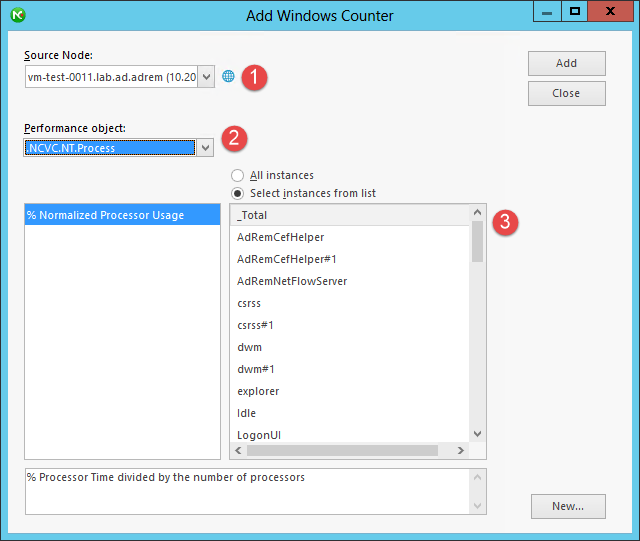
- (1) Select the node from which NetCrunch should get all processes.
- (2) Click on Select Counter, Expand Performance Object list and find .NCVC.NT.Process.
-
(3) Select the process you want to monitor from the list.
-
Add a counter: you can select the type of condition, when should an alert be raised and for how many samples or minutes a value should be calculated.
- Switch the tab to "Assigned to" and select the nodes on which you want to monitor the process you just selected.
- After everything is set, NetCrunch will start to monitor the process and it will raise an alert based on the conditions that are set.
Please take note that the value presented in task manager might be slightly different from that presented in NetCrunch, due to fact that Task Manager may poll data at different intervals.
- [06.07.2018]Analyze Windows failed login events with a custom log view
This article will demonstrate how to simply display the particular type of Event Log entries in a separate view for better analysis of the existing issues.
- [28.05.2018]Monitoring Windows Event Logs for Warnings and Errors.
This article will demonstrate how to specify Event Log entries for monitoring by setting alerting rules in Monitoring Packs and assigning Alert Escalation Scripts.
- [12.02.2018]Process Monitoring with NetCrunch WMI Sensors.
Learn how to configure a node-specific WMI Object sensor to monitor a specific Windows process and generate an event when the process is restarted. This sensor-based monitoring strategy leverages the uniqueness of PID, against the generic name of a process.