
NetCrunch Connection Cloud (NCC VPN)
A resilient, secure platform for zero-configuration access to NetCrunch from any location — ideal for modern, zero-trust environments.
Overview
NetCrunch Connection Cloud (NCC) provides a reliable, secure, and cost-effective way to access the NetCrunch Server from any location without requiring firewall changes or VPN configuration. Much like point-to-point VPNs, NCC establishes an encrypted HTTPS tunnel from the server to the cloud — enabling remote access without exposing any inbound ports.
Unlike traditional VPNs, NCC does not expose the internal network. Instead, it functions as a relay, brokering HTTPS connections from clients (e.g., Console, Browser, Probe) to the server.
The only requirement is that the server must be able to make an outbound connection on port 443.
Key Features
Zero Configuration Access
- No need to expose ports or reconfigure firewalls.
- The NetCrunch server connects outbound to the NCC service.
- Users connect using a simple ID (your license number).
Optimized for Zero Trust Environments
- No inbound connectivity required to your internal infrastructure.
- Minimizes attack surface and simplifies perimeter security.
- Works with any network that allows outbound HTTPS traffic.
High Availability & Regional Redundancy
- NCC runs in multiple regions for low-latency, fault-tolerant access.
- Connections are relayed via the geographically closest NCC node.
Secure Data Transmission
- No data is stored in the cloud — NCC functions purely as a tunnel.
- HTTPS is used end-to-end between client and server.
- NCC never sees decrypted monitoring data or credentials.
Enterprise Customization
- Enterprise customers can request a private NCC node, ensuring that connections bypass public relays entirely.
- Enables complete isolation and compliance with sensitive data requirements.
Full Client Compatibility
NCC supports secure connection from:
- Desktop Console — Choose “Connection Cloud” and enter your license ID
- Monitoring Probes — Use
@<license-id>instead of an IP address - Web Console — Open
https://ncconsole.net/rc/connect/<license-id>in your browser
The <license-id> is your NetCrunch license number, visible in the About box of the Console.
GDPR Compliance
NCC is designed from the ground up to comply with strict privacy laws like the GDPR.
Data Privacy by Design
- NCC stores no personal data or monitoring content.
- It acts solely as a connection broker, forwarding encrypted HTTPS traffic.
- No metadata is retained about sessions beyond what is required to establish routing.
Regional Data Flow
- Connections are routed through the closest NCC region.
- Regional relaying helps reduce cross-border data movement.
- For enterprise customers, private relays can be deployed in specific countries or data centers.
Enterprise-Level Security
- Exclusive nodes ensure single-tenant isolation.
- Supports secure TLS transport with certificate validation.
- Multi-factor authentication is supported now, on every connection type including NCC. See NetCrunch Security Features.
- Future roadmap includes support for SSO.
By meeting these criteria, NCC helps organizations stay compliant while maintaining top-tier network security.
Why Choose NCC?
- Perfect for remote workers, branch offices, and MPLS-free environments
- No NAT, port forwarding, or VPN configuration
- Maintains outbound-only security posture
- Enables a true zero trust deployment model
- Backed by high-availability relay infrastructure
Connecting
To connect using NCC:
- Desktop Console → choose Cloud Connection and enter your license ID (e.g.,
@YZ-123-456) - Monitoring Probe → enter
@<license-id>in the server field - Web Console → visit
https://ncconsole.net/rc/connect/<license-id>
The license-id is your NetCrunch license number.
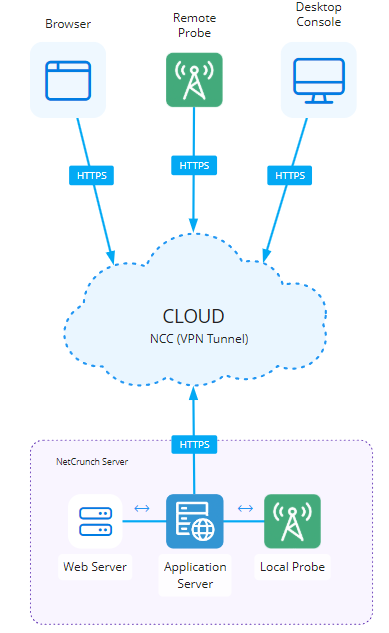 Excerpt from the NetCrunch Connections diagram — highlighting the Cloud Relay (NCC) communication model.
Diagram created using NetCrunch Graphical Views.
Related Topics
- Architecture and Concepts
Overview of NetCrunch Server architecture. Learn more about Monitoring Engines, NetCrunch Consoles, databases, additional tools, and critical concepts of advanced network visualization.
- What Is a Node in NetCrunch?
This topic explains the definition of a Node in NetCrunch. It clarifies why a Node is treated as a service endpoint rather than a physical device, and how this distinction improves monitoring accuracy for modern infrastructure.
- What can I monitor?
NetCrunch can monitor nearly anything: devices, applications, systems, databases, and files. The program can be extended using scripts; data from various sources can be sent to NetCrunch or polled from files, databases, or websites.
- NetCrunch Connections
Learn how clients and remote components connect to the NetCrunch Server — locally, through HTTPS, or via the NetCrunch Connection Cloud (NCC). Understand supported protocols, security levels, and available connection types.
- SSH Terminal
An interactive shell on a monitored node, opened from the node menu in either console. The session is carried by the probe that monitors the node, so a device on an isolated network is reachable without a separate jump host.
- Essential Sensors
DNS Query, System Uptime, RADIUS, SSL Certificate & SSH Remote Ping.
- Monitoring SNI SSL Certificates
This topic explains how to monitor multiple SSL certificates on a single IP address (SNI) by treating each domain as a separate Node in NetCrunch, and how to accurately aggregate their status using a Composite Status Node.
- Windows Monitoring Setup
Reading this topic will make your Windows monitoring experience much better.
- Monitoring Web Pages & Data
NetCrunch can monitor requests, pages, and data on the web.
- Device Config Sensor
The sensor enables tracking changes to device configurations and stores multiple backups of device configurations using the
telnetorsshprotocol. - Azure API Management Sensor
Azure API Management sensor allows you to monitor the performance and behavior of the Azure API Management service. Azure API Management is a reliable, secure, and scalable way to publish, consume and manage APIs running on the Microsoft Azure platform.
- Azure Cosmos DB Sensor
This sensor monitors Azure Cosmos Database Service using Azure Monitor metrics.
- Azure Cost Sensor
The sensor monitors the estimated cost of resources in Azure subscription, and the progress of expenses within budgets defined in Azure subscription.
- Azure Insights Components
Azure Insights Components Sensor monitors Azure Insights Components resource, using Azure Monitor metrics. Application Insights is a feature of Azure Monitor and an extensible Application Performance Management (APM) service. You can use it to monitor your live applications. It will automatically detect performance anomalies and includes powerful analytics tools to help in diagnosing issues and understanding what users do with the app.
- Azure Logic Apps Sensor
Azure Logic Apps sensor allows you to monitor the performance and behavior of the Microsoft Cloud technology called Azure Logic Apps. Azure Logic Apps is a service in Microsoft Cloud that allows you to schedule, automate, and orchestrate tasks, business processes, and workflows when you need to integrate apps, data, systems, and services across enterprises or organizations.
- Azure Server Farm Sensor
Azure Server Farm Sensor monitors Azure Server Farm resources, using Azure Monitor metrics. The Microsoft Server Farm simplifies the provisioning, scaling, and management of multiple servers for administrators and hosting providers.
- Azure Service Bus Sensor
Azure Service Bus sensor allows monitoring the metrics of the cloud apps connected to the Service Bus namespace. Azure Service Bus is a messaging service on the cloud used to connect any applications, devices, and services running in the cloud to any other applications or services. As a result, it acts as a messaging backbone for applications available in the cloud or across any device.
- Azure Storage Account Sensor
Azure Storage Account Sensor monitors Azure Storage Accounts service, using Azure Monitor metrics. Microsoft Azure Storage Accounts service allows to create a group of data management rules and apply them all at once to the data stored in the account: blobs, files, tables, and queues.
- Azure Web Site Sensor
With the Azure Web Site sensor, you can monitor the usage and performance of the web applications that are deployed to the cloud with Azure Web Apps. Azure Web Apps is a managed cloud service that allows the deployment of a web application and makes it available to customers on the Internet in a very short amount of time.
- AWS Alarm Sensor
The Alarm Sensor monitors the status of Amazon alarms with CloudWatch API.
- AWS Auto Scaling Sensor
AWS Auto Scaling Sensor monitors the parameters of AWS Auto Scaling Group. AWS Auto Scaling automatically adjusts capacity to maintain steady, predictable performance for your applications.
- Azure SQL DB Sensor
This sensor allows you to monitor the performance and behavior of the databases managed in Azure SQL DB. Azure SQL DB is Microsoft’s cloud database service, that enables organizations to store relational data in the cloud and quickly scale the size of their databases up or down as business needs change.
- AWS Cost Sensor
The sensor monitors the estimated cost of services in the AWS cloud and the progress of expenses within AWS Budgets.
- AWS EBS Sensor
The sensor allows monitoring of key metrics of AWS Elastic Block Store.
- AWS EC2 Sensor
AWS EC2 Sensor allows monitoring usage of Amazon Cloud service Elastic Compute Cloud (EC2) Instance resources.
- AWS ElastiCache Sensor
AWS ELB Sensor allows monitoring of the performance of the AWS ElastiCache service.
- AWS ELB Sensor
AWS ELB Sensor allows monitoring metrics of AWS Elastic Load Balancers.
- AWS SQS Sensor
AWS SQS Sensor allows monitoring of key metrics of AWS Simple Queue Service (SQS). SQS is a fully managed message queuing service that enables you to decouple and scale microservices, distributed systems, and serverless applications.
- Cloud Drives
This sensor allows monitoring of Microsoft OneDrive storage usage.
- Microsoft 365 Service Status
This sensor allows you to monitor the health of Microsoft 365 services.
- Google Analytics Sensors
Google Analytics sensors allow monitoring of various metrics provided by the Analytics Reporting API.
- Cisco Meraki Cloud
This monitoring solution provides visibility into Cisco Meraki cloud-managed wireless infrastructure, including device availability, wireless performance, network client statistics, connection health, and license status using the Meraki Dashboard REST API.
- Administration Console
Window-by-window reference for the Desktop Console: how to navigate it, what each settings page does, and the tools it puts on the node menu.
- Navigation
How the console is laid out — the two navigation layouts, the five main sections, the Home screen, and the Atlas Tree panel with its search and ordering options.