
We recently audited the NetCrunch documentation against the shipped product, feature by feature. The result was uncomfortable: aseveralthings that work, that customers pay for, and that nobody outside the development team could find out about. They were built, tested, released — and then never written up.
Those pages exist now. This article is a short version of five of them, spanning NetCrunch 13 to NetCrunch 15, oldest first. If you have been running NetCrunch for a few years, there is a fair chance that at least one of these has been sitting in your console the whole time.
Quick answer
The five features are SSH Terminal (open a shell on a monitored node from the console, NetCrunch 13.0.0), Windows software and hotfix inventory (collected automatically, with alerts when anything changes, NetCrunch 13.0.0), End-of-Life Monitoring (know when an OS stops getting security patches, months ahead, NetCrunch 14.0.3), the Oracle Tablespaces sensor (capacity measured against how far a tablespace can grow, not how full it is today, NetCrunch 15.0.1), and Custom Node Tools (put your own commands on the node menu, NetCrunch 15.3.0).
1. SSH Terminal — since NetCrunch 13.0.0
Monitoring tells you a Linux host is out of disk space; the next step is almost always to log in to it. NetCrunch has had one built in since version 13.
Node menu Tools SSH Terminal
It is a full interactive VT-compatible session, not a command runner. It sizes itself to the window and tells the remote pty the new geometry, so top, less, and vi draw correctly.
The design detail that makes it more than a convenience: the session is opened by the monitoring probe responsible for the node, not by your browser or your workstation. The reachability that matters is the probe's. A device sitting in an isolated network that your workstation has no route to is reachable without a separate jump host. A device the probe cannot reach will not open, however well you can reach it yourself.
Credentials come from one of three places — the node's own monitoring credentials (the default), a named credential profile, or a username and password typed for that session only. Only typed credentials leave the browser; choose the node or a profile, and only the reference travels, with the password resolved where the session is opened.
In the Web Console the terminal opens only over HTTPS, or on the server itself via localhost. Over plain HTTP, it refuses with Not available due to a lack of a secure connection. If you plan to use it, install a certificate for the web server. The Desktop Console hosts the same page in its own window and is not affected.
Opening a shell on a device is an administrative action, and NetCrunch treats it as one: a NetCrunch administrator can open it anywhere, and everyone else needs the Administrator access right on that specific node. The connection is made to port 22, and the port is fixed.
2. Software and hotfix inventory, with change alerts — since NetCrunch 13.0.0
NetCrunch is an inventory database and a monitoring system, and on a credentialed Windows estate, the inventory is there — nobody has to switch it on.
Three sensors do the collecting, and the Windows monitor adds them by itself using the node's Windows credentials:
| Sensor | What it records |
|---|---|
| Windows Hardware Config | Processor, memory, storage, video, monitors |
| Windows Software Config | Every installed application, with versions |
| Windows Hotfix Config | Every installed update |
The Software and Hotfix sensors arrived together in 13.0.0; the Hardware sensor predates them.
Each runs daily at 12:00 out of the box (weekly and monthly are also available), with a first run immediately after the sensor is added, and each keeps 10 previous versions of what it collected — adjustable from 1 to 999.
That retention is the point, because it allows the feature most people have missed entirely: NetCrunch not only records the current state, it compares it to the last one and raises an alert when something moves.
- Hardware configuration changed
- Software installed, uninstalled, or updated
- Hotfixes installed or uninstalled
The hardware alert is part of the Basic Windows Monitoring pack by default, so it is already active on your Windows nodes.
Read that list again as a security control rather than an inventory feature. Software appearing on a server that nobody installed, or a hotfix disappearing, is exactly the signal an inventory system is well placed to catch, and a monitoring system is well placed to alert on. The same data serves both purposes.
Per node, the data is under Node Status -> System Views -> Hardware / Software / Hotfixes.
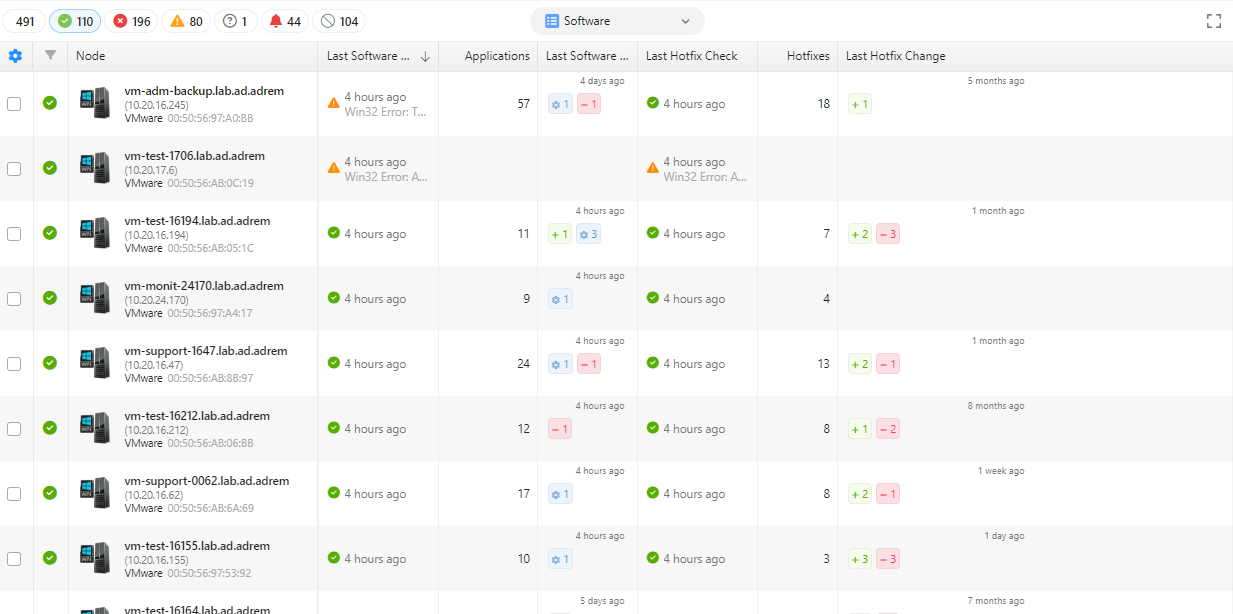
Across the estate, there are two places to look, each answering a different question. The Software view on the Nodes tab reports the state of the collection itself - when each node was last checked, how many applications and hotfixes it carries, and what changed at the last check, shown as plus and minus counts against the node.
Image: The Software view on the Nodes tab - applications and hotfixes per node, with the change at the last check
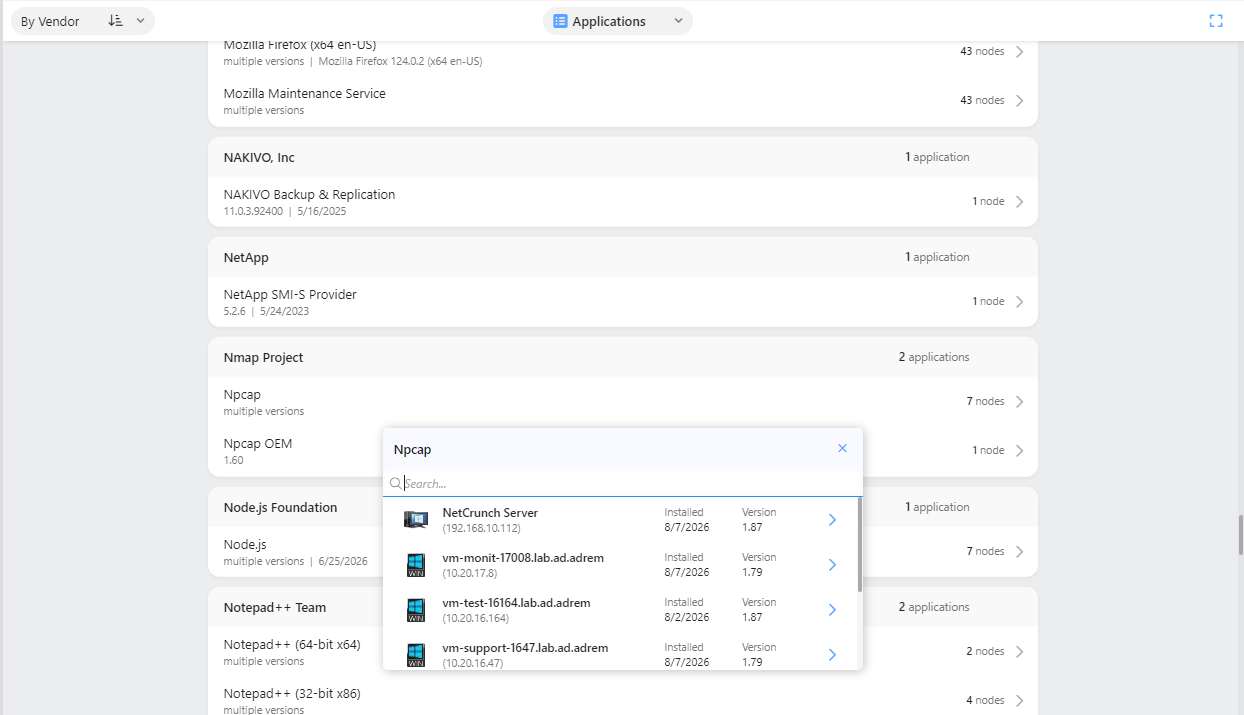
The Software page answers the inventory question instead. Its Applications view lists every application found across the estate, grouped by vendor, with each entry showing its version and the number of nodes that have it. Where an application is installed at more than one version, the entry reads multiple versions, and clicking it opens the nodes that have it, each with its own version and install date - which is how you find the one machine nobody upgraded. From there, a node leads to its own software page. A Hotfixes view does the same for updates.
Image: Applications grouped by vendor, with one opened to show which nodes have it and at which version
One boundary to be clear about: installed-software inventory is Windows only. Linux, macOS, BSD, and Solaris nodes are monitored, but nothing collects their installed packages.
NetCrunch as an Inventory Database
3. End-of-Life Monitoring — since NetCrunch 14.0.3
An unsupported operating system stops receiving security patches while still working perfectly. That is precisely what makes it dangerous: nothing fails, nothing alerts, and the machine quietly becomes the weakest thing on the network.
NetCrunch already knows which version every monitored host runs. End-of-life monitoring turns that into a date, and the date into an alert raised early enough to plan around. It covers Windows and ESXi, resolving versions against the public endoflife.date database — Windows matched by build number, so a host reports against the servicing branch it is actually running.
Windows has two ends, and NetCrunch tracks both. Active Support is where feature updates and general fixes stop — a planning problem. Security Support is where patches of any kind stop — an exposure. ESXi has a single Support date.
Where to look: Monitors -> Windows and Monitors -> ESXi include the support columns, showing how much time is left (or how long ago it ran out) as a relative time. Sort on those columns and you have the estate ordered by how close it is to the edge, which is the view to bring to a budget conversation.
Alerts on those monitors are ordinary, so they carry the usual actions, notifications, and restrictions. Each rule specifies whether it watches active or security support, and whether it fires when the date has passed or a number of months before.
The default lead time is three months. Set it to match your replacement cycle instead. Three months is enough to raise a purchase order and too little to plan a fleet migration — for an estate that needs budgeting a year ahead, an alert at twelve months is the one that changes the outcome.
Two practical touches, both added in 14.2.0: a custom end-of-life date can be set per monitor and replaces the looked-up value everywhere, for extended support contracts or an internal policy that retires hardware earlier than the vendor does. And a server with no outbound internet access reads lifecycle data from a local eol.json file instead, so an isolated installation stays current by replacing a file rather than opening a hole in the firewall.
4. Oracle Tablespaces sensor — since NetCrunch 15.0.1
An Oracle tablespace runs out of space when its datafiles can no longer grow, which is not the same as the tablespace's datafiles being full. A tablespace whose files are 99% used but set to autoextend has plenty of room left. One at 70% with autoextend off is much closer to the trouble zone.
This is where most tablespace monitoring goes wrong, and it is what the NetCrunch sensor gets right: the percentages are measured against the size the tablespace could grow to, not against its current size. A threshold set on it means what an administrator expects it to mean.
Each tablespace becomes an instance of the sensor, named as Oracle names it, so a threshold defined once applies to every tablespace and alerts identify which one crossed it. The counters are Total Space MB, Free Space MB, Used Space MB, Max Autoextend Space MB, % Current Usage, and % Available Space.
Setup is minimal: it uses the same database connection profiles as the other SQL sensors, and it discovers the tablespaces itself. The monitoring account needs to read two data dictionary views:
GRANT CREATE SESSION TO netcrunch_mon;
GRANT SELECT ON sys.dba_data_files TO netcrunch_mon;
GRANT SELECT ON sys.dba_free_space TO netcrunch_mon;
SELECT_CATALOG_ROLE covers both and rather more besides; the two explicit grants are the smaller privilege and the better choice for a monitoring account.
The tablespace list is read once, when the sensor first runs, and kept for as long as the sensor is loaded. A tablespace created afterward is not picked up until the sensor starts again — reopening and saving its settings, or restarting the NetCrunch Server, does that.
5. Custom Node Tools — since NetCrunch 15.3.0
The newest of the five, and the one most likely to be sitting unused in a console you look at every day.
Monitoring tells you a node is in trouble. Fixing it almost always means reaching for something else: a remote desktop client, a vendor's management utility, an internal script. Custom Node Tools puts those commands on the node menu, launched against the node you are already looking at.
SettingsNetCrunch SystemAtlasCustom Node Tools
A tool is a name, a command, its parameters, an optional Run as administrator flag, and a node filter that determines which nodes it is offered on — all nodes, Windows only, a single node, or a node group.
The part worth knowing is the parameters field. It is not plain text. Press Ctrl+Space and you insert a placeholder — DNS Name, IP Address, MAC Address, or Identification — which becomes a labeled token in the field and is replaced with that node's values when the tool runs. There is no substitution syntax to memorize.
Identification is the interesting one: it resolves to whichever of address or name NetCrunch uses to identify that particular node. A tool built on it addresses each node the way NetCrunch does, rather than assuming every device is reachable by name or by address.
Two behaviors worth knowing before you build a toolbox around this:
- The command runs on the machine where the Desktop Console is running — not on the server and not on the monitored node.
- Because of that, tools are offered only for IP nodes in the server's own address space. Nodes behind a remote probe, cloud service nodes, and other non-IP nodes do not appear.
Fewer than three tools apply to a node, and they are listed inline on the menu. Three or more, and they collect under a Custom Tools submenu.
Why this happened, and what we are doing about it
None of these is new. They were built, released, and then quietly left out of the documentation — usually because the release note that announced them was treated as the write-up. A one-line entry in a change log is not documentation, and three major versions in a row proved it.
We are fixing that the slow way: going through the shipped product against the documentation, feature by feature, and writing the missing pages. Several dozen topics have been added or rewritten in the last week alone, and this article covers five of them.
If you have been using NetCrunch for years and something here is news to you, that is on us, not on you. It is worth ten minutes in the console to check which of these you already have running.
Summary
| Feature | In NetCrunch since | What it gives you |
|---|---|---|
| SSH Terminal | 13.0.0 | A shell on a monitored node, opened by the probe — so isolated networks are reachable |
| Windows software & hotfix inventory | 13.0.0 | Automatic inventory plus alerts when software or hotfixes change |
| End-of-Life Monitoring | 14.0.3 | Support-expiry dates in the monitor grids, with alerts months ahead |
| Oracle Tablespaces sensor | 15.0.1 | Capacity measured against the real ceiling, not today's file sizes |
| Custom Node Tools | 15.3.0 | Your own commands on the node menu, with node data passed in automatically |
