How to monitor failed login attempts in Linux
One of the things administrators often do is check multiple failed login attempts in Linux. Monitoring them allows you to assess whether illegal or unwanted attempts to our network have occurred. In this article, we will show you how to track it automatically using NetCrunch.
Configuring RHEL and Debian based Linuxes
The first thing you need to do to monitor login attempts is to configure Linux properly. We'll show you how to do this on the example of Debian and RHEL based systems. If your Linux is not configured, you will first need to install Audit. How to do it? Most Linuxes have an Audit repository included in the official repositories. So just use the simple commands:
- for Debian based systems:
sudo apt-get install auditd - for RHEL based systems:
sudo yum install audit
The Audit daemon should start automatically, but if it didn't happen for some reason, use the following commands:
- for Debian based systems:
sudo systemctl start auditd - for RHEL based systems:
sudo systemctl start audit
After configuring the system, the logs should be saved in these locations:
- for Debian based systems:
/var/log/auth.log - for RHEL based systems:
/var/log/secure
Of course, you can try to read files using commands such as more, less or grep. Unfortunately, log files are not very easy to read, therefore NetCrunch will be much more efficient and convenient to achieve it. Just take a moment to configure, and then NetCrunch will automatically inform you if there are any suspicious login attempts.
Create Text Parsing Expression
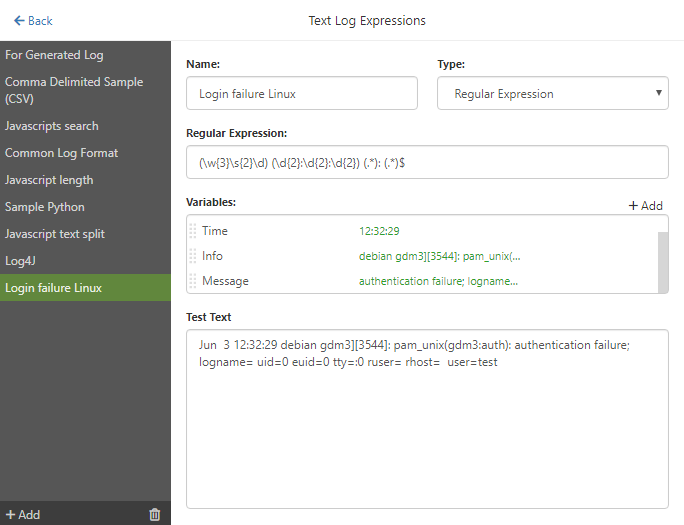
The logs that we want to monitor contain a lot of interesting information. You can check in them, among others, whether there were any failed login attempts, successful login attempts, and many more. For the purposes of this article, we will create Text Parsing Expression, using Regular Expression, which allows to easily find the phrase 'authentication failure' in the following entry in the log:
Jun 3 12:32:29 debian gdm3] [3544]: pam_unix (gdm3: auth): authentication failure; logname = uid = 0 euid = 0 tty =: 0 ruser = rhost = user = test
- From the Top Menu select Monitoring Text Parsing Expressions
- Click Text Log Expressions button
- Click +Add button located in the bottom-left corner of the window
- Enter any Name and select Regular Expression Type
- In the Test Text field paste a single line of the log
- In the Regular Expression field write proper expression, in our example it should be
(\w{3}\s{2}\d) (\d{2}:\d{2}:\d{2}) (.*): (.*) - In the Variables section click +Add button 4 times, and name your variables (e.g. Date, Time, Info, Message)
- Click OK button to save settings
If you've done everything correctly, in the seventh step, values should appear next to the variable names:
If you would like to search for other log entries, you will most likely have to create a new Text Parsing Expression.
Add Text Log sensor to the Linux Node
A good way to save yourself a job (especially if you have or plan to have many Linux nodes that you want to monitor) is to create the appropriate Template. Please refer to one of the previous articles on templates - read it if you are not familiar with template usage scenarios yet. Here I will focus on adding the right sensor directly to the node.
- Open Node Settings on the appropriate Node
- Click on + Add Monitoring Sensor button and add the Text Log sensor
- Configure all settings
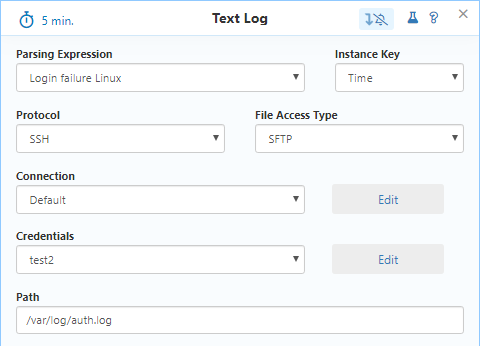
- Add
New Alert on Text Log Entry - Enter alert description and set filtering condition to
Messagecontainsauthentication failure - Save all settings
Usually illegal attempts are not a single failed login event, but rather a series of them in a short time. So to actually track illegal attempts, you should select Event happened more than in the Trigger Alerting Action On section of Alerting Rule window, and set the number of occurrences per unit of time according to your needs.
- [08.06.2020]How to add Monitoring Sensor to multiple nodes using Monitoring Template
For larger infrastructures, applying sensors one by one can be tedious. Nevertheless, NetCrunch provides tools for more convenient management for both small and large numbers of nodes. Below you will find a simple example of adding Pending Reboot sensor to a large number of nodes.
- [05.02.2020]Monitoring Backup files
Backups are a vital part of any network infrastructure- they can contain personal data files, configurations or any important data. NetCrunch can help you track if backups are successfully created and if files are present in the designated directory
- [21.02.2019] Monitoring of Windows Updates and Pending Reboots
Updates are essential to keep network infrastructure safe and solid, NetCrunch 10.5 provides new functionality that allows monitoring of update status, missing updates, and failed installations. It can also notify when the system is running for too long without installing updates. This article shows how to check which updates are available and how to set these two essential sensors.
- [28.01.2019]Monitoring IPMI Logs
React to changes in the configuration of monitored devices and alerts related to their stats by checking the System Event Log entries using the IPMI Log Sensor.
- [15.11.2018]Linux/Unix Server Monitoring
Monitor your Linux servers comprehensively and automatically using NetCrunch. Skip basic configuration of monitoring strategies by leveraging NetCrunch's OS identification and automatic Monitoring Pack assignment. Extend your Linux monitoring strategies with sensors.
- [10.05.2018]How to use NetCrunch data parsers with REST sensor
See how easy it is to use REST sensor in NetCrunch to get any data, and process it with parsers for counters and statuses. It can be added to any view as a widget for live visibility.
- [26.02.2018]Using Templates in NetCrunch
Learn how to setup monitoring templates - new way of managing and adjusting nodes in NetCrunch.