7 types of data to include in your network documentation
Here's a handy list of aspects that need to be documented and tracked for changes. When transferring to another position, preparing for retirement, or even planning for vacation without constant calls from your colleagues or boss - here's what you need to dump from your brain into an outside data store.
Why you should document your network
Detailed and updated network documentation is part of the business continuity plan. It is often required when your company is undergoing an audit (for example after a security breach or other crisis). It is also necessary for reviewing your network capacity or validating the IT budget proposal.
Network documentation is never complete, and it easily degrades - each change should be updated (manually or automatically), to ensure you can confidently refer to it any time you (or your boss) need to.
What should be documented
Network hardware
A current automatically refreshed and searchable list of all network hardware that is plugged into your network helps you easily identify or filter devices based on any criteria.
Info such as Location, Network Role, and Organizational Unit that a device belongs to are automatically detected by NetCrunch, others (such as Building, Network Assignment, or any other field) can be added and defined based on your organization's needs. Simply add a new field and use multiselection to add populate it with info that is relevant for a group of devices, avoiding one-by-one typing.
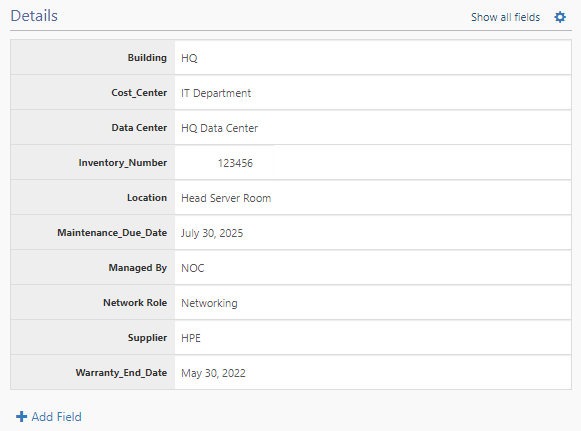
Some of the above fields can be automatically filled by NetCrunch using SNMP. If e.g. Location is set on your SNMP Device, NetCrunch easily reads this and put it in the appropriate field.
Daily network housekeeping info - vendors, suppliers contacts, maintenance contracts, dates, etc.
Notes
Include info that is relevant to a given node or a group of nodes - you can treat it as a knowledge base that is part of your network. It can for example include implementation instructions - what drivers and software need to be installed there. All notes for nodes that belong to a particular network view can be found in the Notes view in NetCrunch. You can also see the notes on individual nodes. To do this, just go to the Node Settings of a given node and go to the Notes tab.
Device types
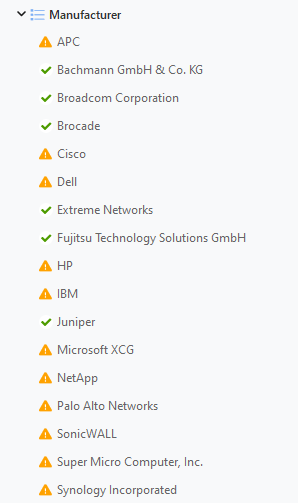
Nodes in NetCrunch usually have an automatically assigned device type. If for some reason NetCrunch was unable to detect the device type, you can also set it manually by selecting one of the predefined ones. If you need you can also add your own device type.
You can view the above information in the Node Status (in the Summary tab), in the Node Settings (in the Properties tab), or on the Nodes Page (by adding theType column). You can even create a Dynamic Views Folder with separate views for every vendor.
Dynamic views
As mentioned earlier in this article, various Custom Fields can be added to NetCrunch. Among other things, on their basis, you can later create Dynamic Views Folders and Dynamic Node Views. Some of them are created automatically e.g. Device Groups, Workstation Types, Server Types, Locations, VLANS, Unresponding Nodes, and Nodes with Monitoring Issues. Some you can create on your own. For example, if you added the 'Managed By' field and you would like to see the division of nodes due to this managing them - use Dynamic Views Folders, if you added the Cost Center field and you would like to see which cost group each node belongs to - also use Dynamic Views Folders.
By adding custom fields with warranty/support dates that can be displayed in the table view and part of the Dynamic Views Folders in the network atlas. Other fields frequently added include a serial number, vendor, and supplier.
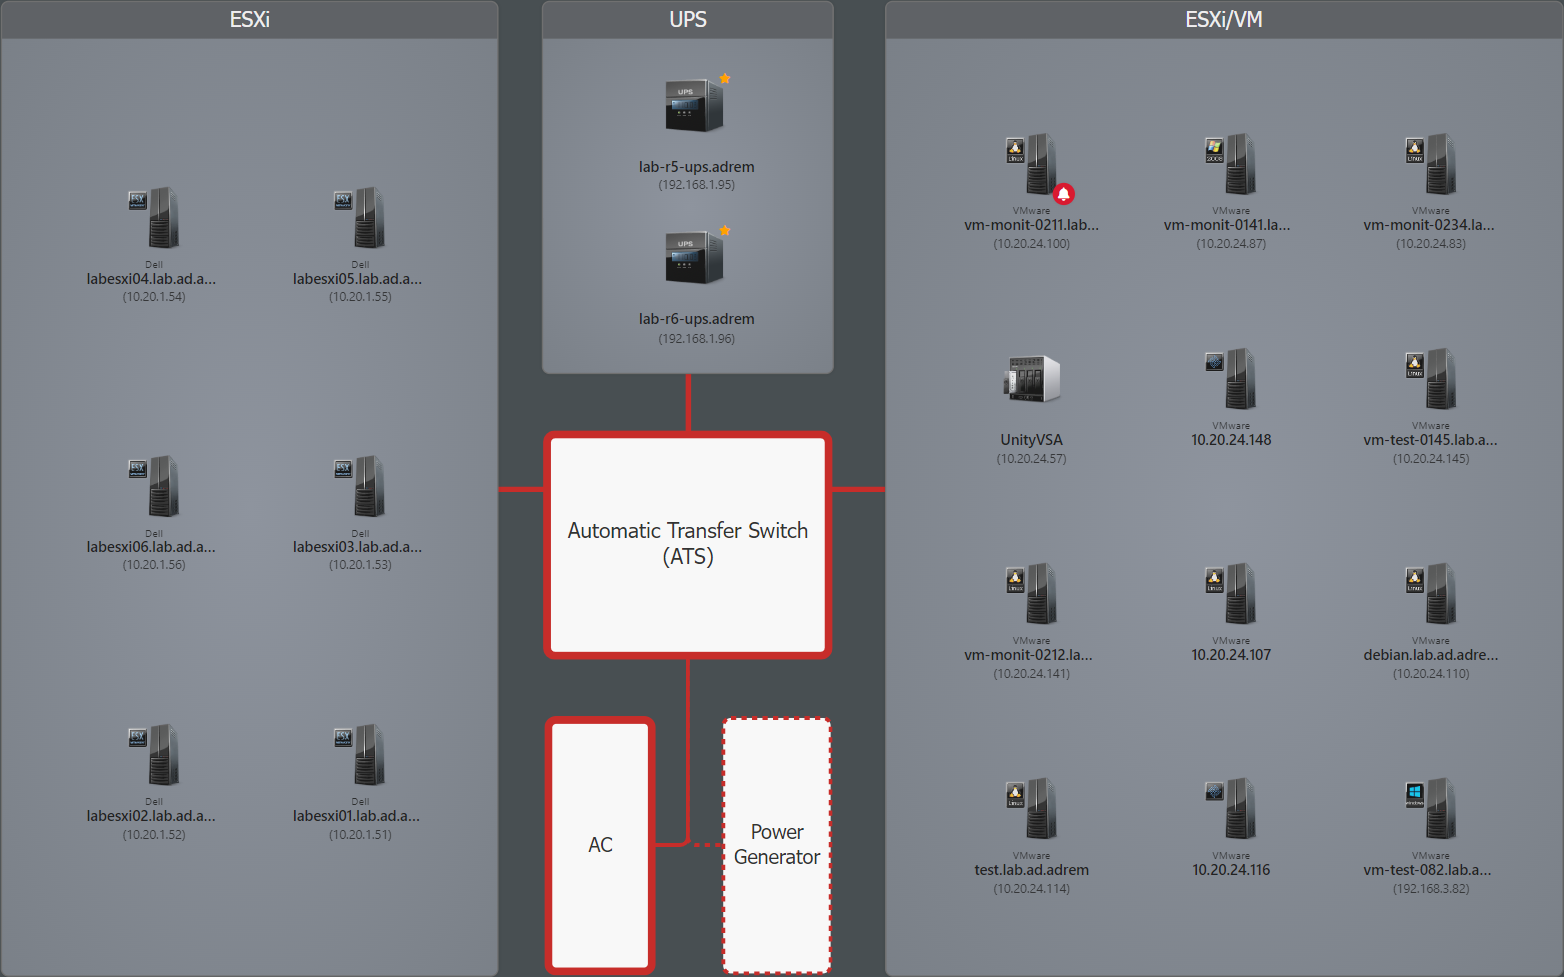
Another example of network views that is recommended and used by other NetCrunch admins is a network view with a background that illustrates the power diagram below.
Physical network connections
What port and what switch is this device connected to?
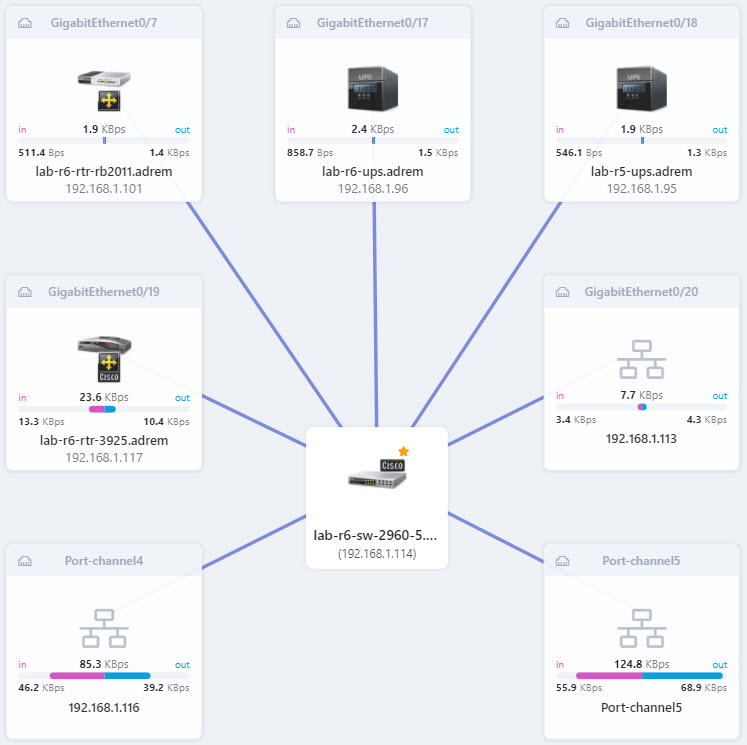
Layer 2 network views graphically represent physical connections between computers and manageable switches in your network. They are automatically drawn and refreshed based on data read from Forwarding Tables and (if available) Spanning Tree, Cisco Discovery Protocol, and Link Layer Discovery Protocol.
Physical Segments map displays Layer 2 devices, the connections between them, and the bandwidth utilization expressed as a percentage value. When troubleshooting and looking for a source of the problem, you can drill down on any map section to see details of individual segments, including port numbers with devices attached to them. In NetCrunch such data is automatically refreshed to reduce maintenance and resolution time.
Subnetworks, locations, and other network groups
Such info is crucial to avoid
Logical network connections (VLANs, Port Mapping)
Can quickly identify what devices belong to a particular VLAN and vice versa. This is another perspective of your network structure that aims to save you on travel and instead helps you reduce troubleshooting time.
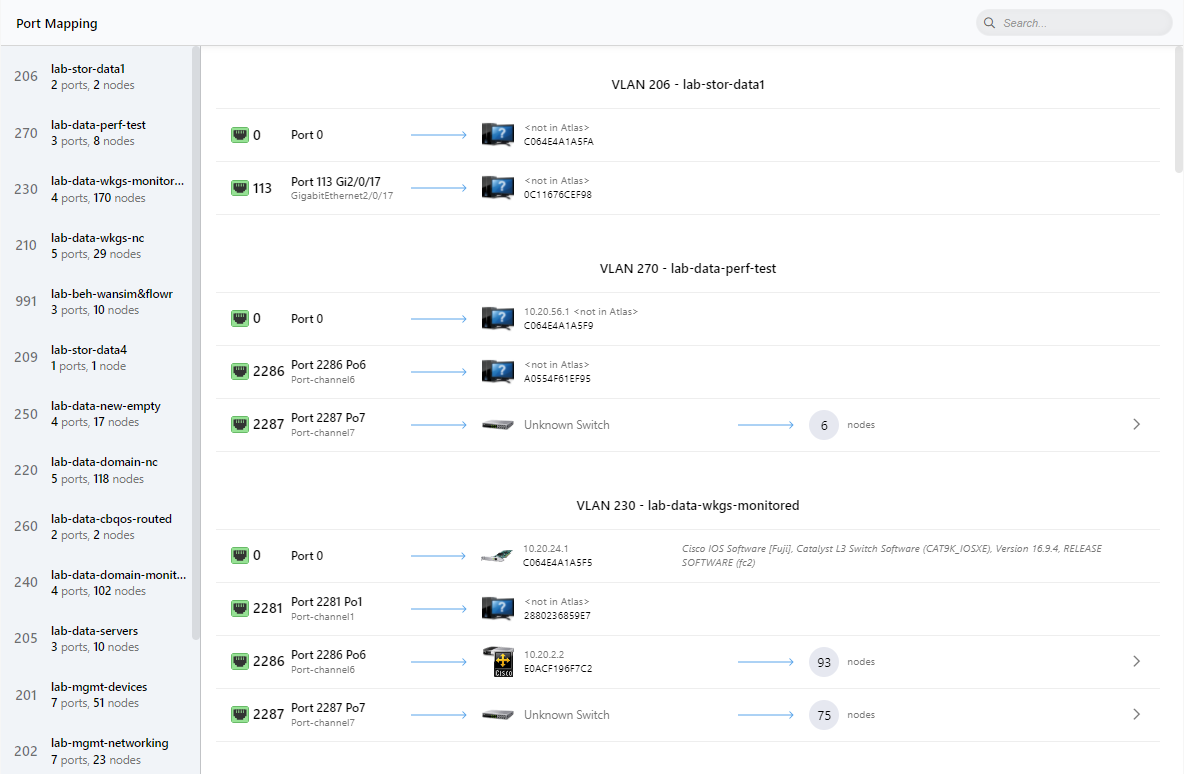
In Port Mapping, you can see VLANS configured on your device. Just open Port Mapping in the Node Status of any switches. You can also check the ports and what devices are connected to them. If a port has a switch attached to it, you can even see what nodes follow it! In addition to VLANs, port numbers, and their names, you will also be able to see node names, their IP addresses, and physical MAC addresses.
Operating systems, virtualization, and services
Have a detailed list of what devices and hosts run what systems can be further filtered by multiple criteria. This info comes in handy when we want to check how many new Windows licenses we need or to escalate service tasks according to the specialization of network administrators - or their physical location.
These views also document Active Directory Domain membership and scheme and reflect update/upgrade procedures.
Furthermore, you can use it to automatically get an inventory of the quantity, type, IP, etc. of virtual machines on virtualization hosts and, on the other hand, on which host each virtual machine is located.
NetCrunch has several views where you can find helpful information. Some of them are called 'View Pages' - depending on Node Type, they display e.g. the IP address of the machine, the name of it, the type of the operating system, Virtualization Host, Organizational Unit, on which host the virtual machine is located, Data Center, Data Store, and more.
Another place is a Node Status window. Similar to View Pages - you can find different information, depending on Node Type, e.g. IP Address, device type, location, virtual machines located on the host, pending updates, and more.
Device Config Management
If you want to automatically store configuration and detect changes in the configuration of your devices, you can use the Device Config sensor.
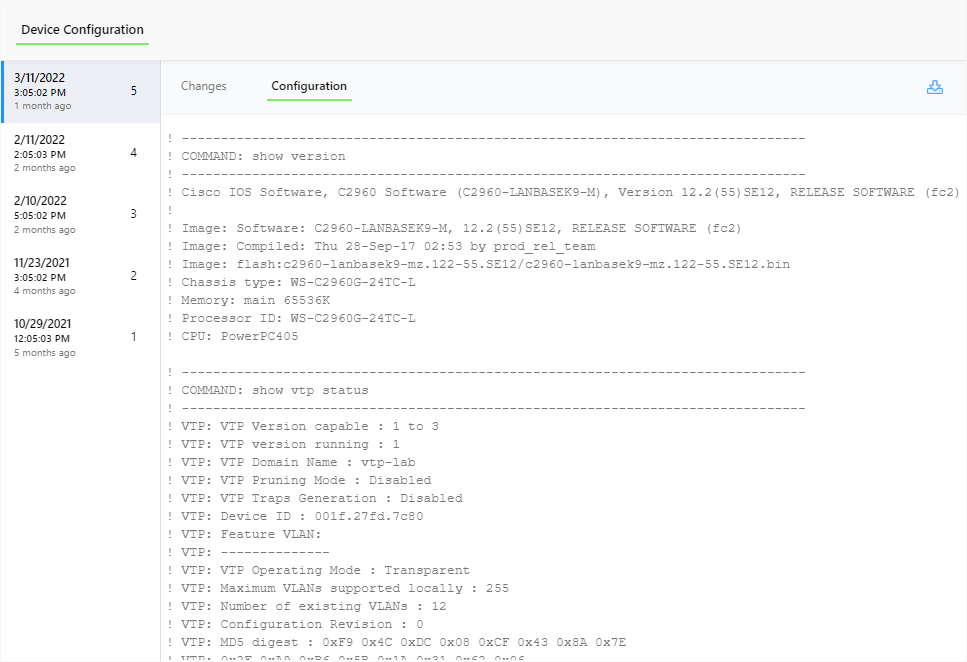
You can easily configure monitoring on devices supporting SSH and Telnet protocols. NetCrunch stores configurations for devices such as routers, switches, and others. Configurations can be saved with frequency up to every hour.
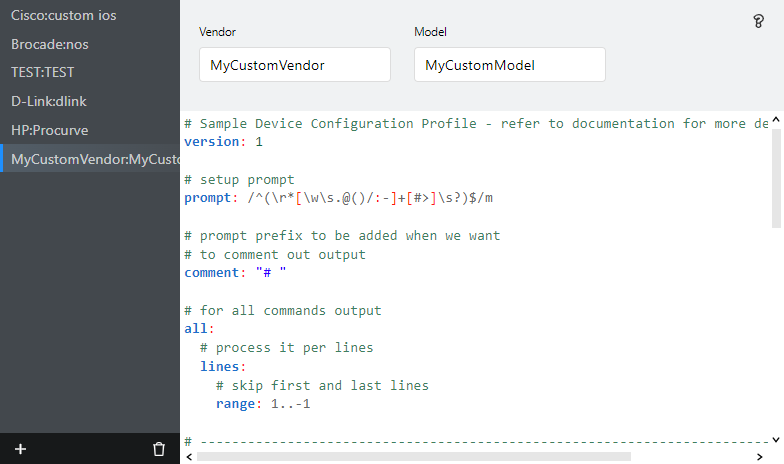
NetCrunch has over 100 built-in device profiles, and, if needed, you can add Custom Device Config Profile using the built-in YAML editor.
- [15.04.2021]Top 5 network views for daily operations and diagnostics
What views are most popular for a quick network health overview? Tips from fellow engineers and sysadmins for starting your day well informed.
- [08.02.2019]SNMP monitoring features in NetCrunch
There is a lot of the ways of how we can monitor the condition, performance and availability of the devices with available SNMP service running on them. Learn how to gather the counters and states from various devices with the tools available in the NetCrunch.
- [19.11.2018]Network Auto-Discovery
NetCrunch discovers all your critical IT infrastructure and deploys foundation monitoring strategies 20-50 times faster than other Network Monitoring Systems. Automatically discover new devices as you deploy them, without having to reconfigure your monitoring.